GSK Consumer: Horlicks strengthens its position as No.1 brand across India
•
1 like•736 views

GlaxoSmithKline Consumer Healthcare Ltd engages in the manufacture and sale of nutritional foods and over the counter drugs primarily in India.

Recommended
Recommended
More Related Content
What's hot
What's hot (20)
Viewers also liked
Viewers also liked (17)
Similar to GSK Consumer: Horlicks strengthens its position as No.1 brand across India
Similar to GSK Consumer: Horlicks strengthens its position as No.1 brand across India (20)
More from IndiaNotes.com
More from IndiaNotes.com (20)
Recently uploaded
Recently uploaded (20)
GSK Consumer: Horlicks strengthens its position as No.1 brand across India
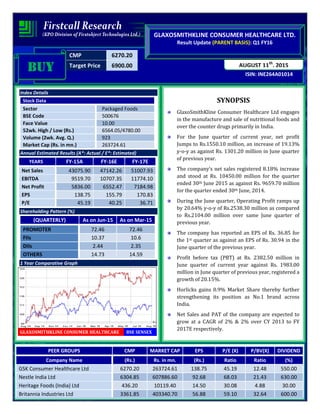
- 1. CMP 6270.20 Target Price 6900.00 ISIN: INE264A01014 AUGUST 11th , 2015 GLAXOSMITHKLINE CONSUMER HEALTHCARE LTD. Result Update (PARENT BASIS): Q1 FY16 BUYBUYBUYBUY Index Details Stock Data Sector Packaged Foods BSE Code 500676 Face Value 10.00 52wk. High / Low (Rs.) 6564.05/4780.00 Volume (2wk. Avg. Q.) 923 Market Cap (Rs. in mn.) 263724.61 Annual Estimated Results (A*: Actual / E*: Estimated) YEARS FY-15A FY-16E FY-17E Net Sales 43075.90 47142.26 51007.93 EBITDA 9519.70 10707.35 11774.10 Net Profit 5836.00 6552.47 7184.98 EPS 138.75 155.79 170.83 P/E 45.19 40.25 36.71 Shareholding Pattern (%) (QUARTERLY) As on Jun-15 As on Mar-15 PROMOTER 72.46 72.46 FIIs 10.37 10.6 DIIs 2.44 2.35 OTHERS 14.73 14.59 1 Year Comparative Graph GLAXOSMITHKLINE CONSUMER HEALTHCARE BSE SENSEX SYNOPSIS GlaxoSmithKline Consumer Healthcare Ltd engages in the manufacture and sale of nutritional foods and over the counter drugs primarily in India. For the June quarter of current year, net profit Jumps to Rs.1550.10 million, an increase of 19.13% y-o-y as against Rs. 1301.20 million in June quarter of previous year. The company’s net sales registered 8.18% increase and stood at Rs. 10450.00 million for the quarter ended 30th June 2015 as against Rs. 9659.70 million for the quarter ended 30th June, 2014. During the June quarter, Operating Profit ramps up by 20.64% y-o-y of Rs.2538.30 million as compared to Rs.2104.00 million over same June quarter of previous year. The company has reported an EPS of Rs. 36.85 for the 1st quarter as against an EPS of Rs. 30.94 in the June quarter of the previous year. Profit before tax (PBT) at Rs. 2382.50 million in June quarter of current year against Rs. 1983.00 million in June quarter of previous year, registered a growth of 20.15%. Horlicks gains 0.9% Market Share thereby further strengthening its position as No.1 brand across India. Net Sales and PAT of the company are expected to grow at a CAGR of 2% & 2% over CY 2013 to FY 2017E respectively. PEER GROUPS CMP MARKET CAP EPS P/E (X) P/BV(X) DIVIDEND Company Name (Rs.) Rs. in mn. (Rs.) Ratio Ratio (%) GSK Consumer Healthcare Ltd 6270.20 263724.61 138.75 45.19 12.48 550.00 Nestle India Ltd 6304.85 607886.60 92.68 68.03 21.43 630.00 Heritage Foods (India) Ltd 436.20 10119.40 14.50 30.08 4.88 30.00 Britannia Industries Ltd 3361.85 403340.70 56.88 59.10 32.64 600.00
- 2. QUARTERLY HIGHLIGHTS (PARENT BASIS) Results updates- Q1 FY16, GlaxoSmithKline Consumer Healthcare Ltd has a strong marketing and distribution network in India comprising over 7000 distributors and a direct coverage of over 8 lakh retail outlets. The company has reported its financial results for the quarter ended 30th June, 2015. The company’s net profit Jumps to Rs.1550.10 million for the June quarter of current year 2015-16, an increase of 19.13% y-o-y as against Rs. 1301.20 million in June quarter of previous year. Net sales registered 8.18% increase and stood at Rs. 10450.00 million for the quarter ended 30th June 2015 as against Rs. 9659.70 million for the quarter ended 30th June, 2014.During the June quarter, Operating Profit ramps up by 20.64% y-o-y of Rs.2538.30 million as compared to Rs.2104.00 million over same June quarter of previous year. The company has reported an EPS of Rs. 36.85 for the 1st quarter as against an EPS of Rs. 30.94 in the June quarter of the previous year. Break up of Expenditure Rs. In million June-15 June-14 % Change Net Sales 10450.00 9659.70 8.18% PAT 1550.10 1301.20 19.13% EPS 36.85 30.94 19.13% EBITDA 2538.30 2104.00 20.64% Break up of Expenditure (Values in millions) Q1 FY16 Q1 FY15 Chng % Cost of Material Consumed 2751.00 3469.50 -21% Purchase of Stock in Trade 337.80 390.30 -13% Employee Benefit Expenses 1213.80 1054.30 15% Advertising & Promotions 1492.20 1414.00 6% Dep & Amortzation Exp 153.70 119.10 29% Other Expenditure 2549.1 2025.7 26%
- 4. COMPANY PROFILE GlaxoSmithKline Consumer Healthcare Limited engages in the manufacture and sale of nutritional foods and over the counter drugs primarily in India. It offers malt based foods, cereal based beverages, protein rich food, biscuits, nutrition bar sweetmeat, ready-to-drink, and instant noodles with seasoning, and ghee, milk fluid and milk cream. The group exports to Bangladesh, Myanmar, Sri Lanka, Middle East, Nepal and other markets. It was incorporated in 1958 as a 40% subsidiary of Smithkline Beecham Plc of UK. GSKCH’s manufacturing facilities are located at Nabha (Punjab), Sonepat (Haryana) and Rajahmundry (Andhra Pradesh) continue to be certified to the latest version of ISO 9001: 2008, ISO 22000: 2005, ISO 14001: 2004 and OHSAS 18001: 2007 by SGS, a leading International certification company. Apart from that the company has contract manufacturing arrangements with nine third-party manufacturers for the production of its various brands. GSK Consumer Healthcare globally owns some of the world’s best loved healthcare brands, successful in over 100 countries. These include Sensodyne, Voltaren, Theraflu, Paradontax, Panadol, Polident, Otrivin, Horlicks and Physiogel. GSK consumer healthcare has a strong marketing and distribution network in India comprising over 7000 distributors and a direct coverage of over 8 lakh retail outlets. Its Flagship product, Horlicks, is a widely regarded and highly respected brand for over 150 years. The company also manufactures and markets boost, viva and maltova and in additional markets and distributes a number of products in diverse categorie, which include prominent names such as eno, crocin and iodex as well as products from the global portfolio like sensodyne. The Gurgaon-based R&D center of GLAXOCON has been fully functional. The company plans to leverage its expertise in the food processing industry to innovate and serve the domestic consumers who are becoming more and more health conscious. GLAXOCON wants to improve its out-of-home business by boosting its vending business. Products • Nutritional o Horlicks o Boost o Maltova o Viva • Vending • OTC o Crocin o Eno o Iodex
- 5. FINANCIAL HIGHLIGHT (PARENT BASIS) (A*- Actual, E* -Estimations & Rs. In Millions) Balance sheet for the period of CY 2013 to FY 2017E CY-13A (15m) FY-15A FY-16E FY-17E I EQUITY & LIABILITIES A) Shareholder's Funds Share Capital 420.60 420.60 420.60 420.60 Reserves and Surplus 17707.90 20709.80 24023.37 27386.64 Sub-Total-Total Net worth 18128.50 21130.40 24443.97 27807.24 B) Non Current Liabilities Other Long term liabilities 92.80 99.30 104.66 109.27 Long term Provisions 1577.50 2076.00 2561.78 3125.38 Sub-Total-Total Non Current liabilities 1670.30 2175.30 2666.45 3234.64 C) Current Liabilities Trade payables 6715.90 7597.80 8463.95 9310.34 Other Current liabilities 4631.90 5340.60 5981.47 6579.62 Short term Provisions 2968.10 3951.40 4955.06 5946.07 Sub-Total- Current Liabilities 14315.90 16889.80 19400.48 21836.03 TOTAL EQUITY & LIABILITIES (A + B + C) 34114.70 40195.50 46510.89 52877.91 II ASSETS D) Non-Current Assets Fixed Assets i. Tangible assets 3364.20 4875.40 6069.87 7253.50 ii. Intangible assets 34.90 42.02 48.32 54.60 iii. Capital Work in Progress 384.50 423.14 448.53 469.16 Total Fixed Assets 3783.60 5340.56 6566.72 7777.26 Long Term loans and advances 1888.80 757.38 492.30 334.76 Deferred Tax Asset 903.00 1043.40 1168.61 1285.47 Sub-Total-Non-Current Assets 6575.40 7141.34 8227.63 9397.49 E) Current Assets Inventories 4074.20 4662.51 5208.02 5728.83 Trade receivables 2993.40 3133.61 3334.16 3480.86 Cash and Bank Balances 18387.80 22965.21 27236.74 31567.38 Short-terms loans & advances 754.70 852.48 954.78 1050.26 Other current assets 1329.20 1440.35 1549.56 1653.09 Sub-Total-Current Assets 27539.30 33054.16 38283.26 43480.42 TOTAL ASSETS (D + E) 34114.70 40195.50 46510.89 52877.91
- 6. Annual Profit & Loss Statement for the period of CY 2013 to FY 2017E Value(Rs.in.mn) CY13 FY15A FY 16E FY 17E Description 15m 12m 12m 12m Net Sales 48685.80 43075.90 47142.26 51007.93 Other Income 2069.10 2218.90 2551.74 2796.70 Total Income 50754.90 45294.80 49694.00 53804.63 Expenditure -39958.00 -35775.10 -38986.65 -42030.53 Operating Profit 10796.90 9519.70 10707.35 11774.10 Interest -10.50 -7.40 -8.17 -8.90 Gross profit 10786.40 9512.30 10699.18 11765.19 Depreciation -625.50 -620.90 -695.41 -762.17 Profit Before Tax 10160.90 8891.40 10003.77 11003.03 Tax -3413.30 -3055.40 -3451.30 -3818.05 Net Profit 6747.60 5836.00 6552.47 7184.98 Equity capital 420.60 420.60 420.60 420.60 Reserves 17707.90 20709.80 24023.37 27386.64 Face value 10.00 10.00 10.00 10.00 EPS 160.43 138.75 155.79 170.83 Quarterly Profit & Loss Statement for the period of 31st Dec, 2014 to 30th Sep, 2015E Value(Rs.in.mn) 31-Dec-14 31-Mar-15 30-Jun-15 30-Sep-15E Description 3m 3m 3m 3m Net sales 10124.80 12155.40 10450.00 11850.30 Other income 547.90 594.80 549.20 738.12 Total Income 10672.70 12750.20 10999.20 12588.42 Expenditure -9065.90 -9517.10 -8460.90 -9740.95 Operating profit 1606.80 3233.10 2538.30 2847.48 Interest -1.90 -1.70 -2.10 -2.27 Gross profit 1604.90 3231.40 2536.20 2845.21 Depreciation -131.30 -249.10 -153.70 -135.26 Profit Before Tax 1473.60 2982.30 2382.50 2709.95 Tax -509.50 -1014.50 -832.40 -934.93 Net Profit 964.10 1967.80 1550.10 1775.02 Equity capital 420.60 420.60 420.60 420.60 Face value 10.00 10.00 10.00 10.00 EPS 22.92 46.79 36.85 42.20
- 7. Ratio Analysis Particulars CY-13A (15M) FY-15A (12M) FY-16E (12M) FY-17E (12M) EPS (Rs.) 160.43 138.75 155.79 170.83 EBITDA Margin (%) 22.18% 22.10% 22.71% 23.08% PBT Margin (%) 20.87% 20.64% 21.22% 21.57% PAT Margin (%) 13.86% 13.55% 13.90% 14.09% P/E Ratio (x) 39.08 45.19 40.25 36.71 ROE (%) 37.22% 27.62% 26.81% 25.84% ROCE (%) 63.01% 47.99% 46.65% 45.08% EV/EBITDA (x) 22.72 25.29 22.09 19.72 Book Value (Rs.) 431.02 502.39 581.17 661.13 P/BV 14.55 12.48 10.79 9.48 Charts
- 8. OUTLOOK AND CONCLUSION At the current market price of Rs. 6270.20, the stock P/E ratio is at 40.25 x FY16E and 36.71 x FY17E respectively. Earning per share (EPS) of the company for the earnings for FY16E and FY17E is seen at Rs.155.79 and Rs.170.83 respectively. Net Sales and PAT of the company are expected to grow at a CAGR of 2% & 2% over CY 2013 to FY 2017E respectively. On the basis of EV/EBITDA, the stock trades at 22.09 x for FY16E and 19.72 x for FY17E. Price to Book Value of the stock is expected to be at 10.79 x and 9.48 x respectively for FY16E and FY17E. We expect that the company surplus scenario is likely to continue for the next three years, will keep its growth story in the coming quarters also. We recommend ‘BUY’ in this particular scrip with a target price of Rs. 6900.00 for Medium to Long term investment. INDUSTRY OVERVIEW The global economy in the recent years has experienced a slowdown and uncertainty that has made growth and profitability increasingly elusive. There is a tremendous focus on the Emerging Markets due to continuous pressure and stress at global level. Indian economy faced its own set of challenges in terms of low GDP, high fiscal deficit, high inflation initially and weak consumer confidence leading to low growth in volume and value in FMCG and HFD. Towards the latter half of the financial year global fuel and commodity prices eased, Central Bank decision to cut rates and Government focus on key sectors to improve investment sentiment have helped to reduce the general inflation. However, the food inflation still remains at moderate level and low consumer disposable income have not improved the short term prospects. The Government evident focus on reviving economic growth by new policies and improve partnering with foreign countries underlines the major changes in the future. According to A C Nielsen, market researcher, FMCG volume growth slowed down to 7% for PAN India. The impact was high in Southern market, where growth slowed down to 3%. The Rural growth has also slowed down on account of below average monsoon and unseasonal rains. The rural business continues to grow consistently despite category slowdown due to macroeconomic challenges, through sustained focus on brand connect and driving execution excellence in coverage expansion. Through 13,000 rural sub distributors the Company’s products are nowavailable in over 2 lacs outlets across 27,000 villages. The company’s two key growth drivers in Rural Programme are Horlicks Swasthya Abhiyan (HSA) and Village Level Entrepreneurs (VLE); HSA program aims to improve the standard of living in the rural areas, engaging with rural medical practitioners and community workers, thus creating awareness, education and
- 9. relevance for our brands. VLE is company’s new initiative that has reached 390 villages by which reaching out to bottom of the pyramid, and in this process, economically empowering rural women. The Indian food industry is poised for huge growth, increasing its contribution in world food trade every year. In India, the food sector has emerged as a high-profit sector on the back of the scope it offers for value addition, particularly with the food processing industry getting recognised as a high-priority area. Accounting for about 32 per cent of the country’s total food market, the food processing industry is one of the largest industries in India and is ranked fifth in terms of production, consumption, export and expected growth. The total food production in India is likely to double in the next 10 years with the country’s domestic food market estimated to reach US$ 258 billion by 2015. The role of the Indian government has been instrumental in the growth and development of the industry. The government through the Ministry of Food Processing Industries (MoFPI) is making all efforts to encourage investments in the sector. It has approved proposals for joint ventures (JV), foreign collaboration, industrial licences and 100 per cent export oriented units. Market Size • The Indian food and grocery market is the world’s sixth largest, with retail contributing 70 per cent of the sales. It is projected to grow at the rate of 104 per cent, touching US$ 482 billion by 2020. • The Indian food processing industry accounts for 32 per cent of the country’s total food market, 14 per cent of manufacturing GDP, 13 per cent of India’s exports and six per cent of total industrial investment. • Indian food service industry is expected to reach US$ 78 billion by 2018. • The Indian gourmet food market is currently valued at US$ 1.3 billion and is growing at a CAGR of 20 per cent. It is expected to cross US$ 2.8 billion by 2015. • Indian food brands are increasingly finding prime shelf space in retail chains abroad. These include Bikanervala Foods, MTR ready to eat foodstuff and ITC’s Kitchens of India. • The online food ordering business in India is in its nascent stage. Share of online food ordering would be in single digits of the overall food ordering business which in 2014 was estimated to be around Rs 50000.00 mn to 60000.00 mn (US$ 800.19-960.12 million). • The poultry sector of India is expected to register double-digit growth in 2015 on the back of stable feed prices and encouraging rural demand.
- 10. Road Ahead Further, the adoption of food safety and quality assurance mechanisms such as Total Quality Management (TQM) including ISO 9000, ISO 22000, Hazard Analysis and Critical Control Points (HACCP), Good Manufacturing Practices (GMP) and Good Hygienic Practices (GHP) by food processing industry enable adherence to stringent quality and hygiene norms and thereby protect consumer health, prepare the industry to face global competition, enhance product acceptance by overseas buyers and keep the industry technologically abreast of international best practices. The allocation of Rs 20000.00 mn (US$ 319.98 million) as a separate National Bank for Agriculture and Rural Development (NABARD) fund for food processing industries during the Union Budget 2014–15 is all set to give a big boost to this sector in India. Disclaimer: This document is prepared by our research analysts and it does not constitute an offer or solicitation for the purchase or sale of any financial instrument or as an official confirmation of any transaction. The information contained herein is from publicly available data or other sources believed to be reliable but we do not represent that it is accurate or complete and it should not be relied on as such. Firstcall Research or any of its affiliates shall not be in any way responsible for any loss or damage that may arise to any person from any inadvertent error in the information contained in this report. Firstcall Research and/ or its affiliates and/or employees will not be liable for the recipients’ investment decision based on this document.
- 11. Firstcall India Equity Research: Email – info@firstobjectindia.com C.V.S.L.Kameswari Pharma & Diversified U. Janaki Rao Capital Goods B. Anil Kumar Auto, IT & FMCG M. Vinayak Rao Diversified G. Amarender Diversified Firstcall Research Provides Industry Research on all the Sectors and Equity Research on Major Companies forming part of Listed and Unlisted Segments For Further Details Contact: Tel.: 022-2527 2510/2527 6077 / 25276089 Telefax: 022-25276089 040-20000235 /20000233 E-mail: info@firstobjectindia.com www.firstcallresearch.com