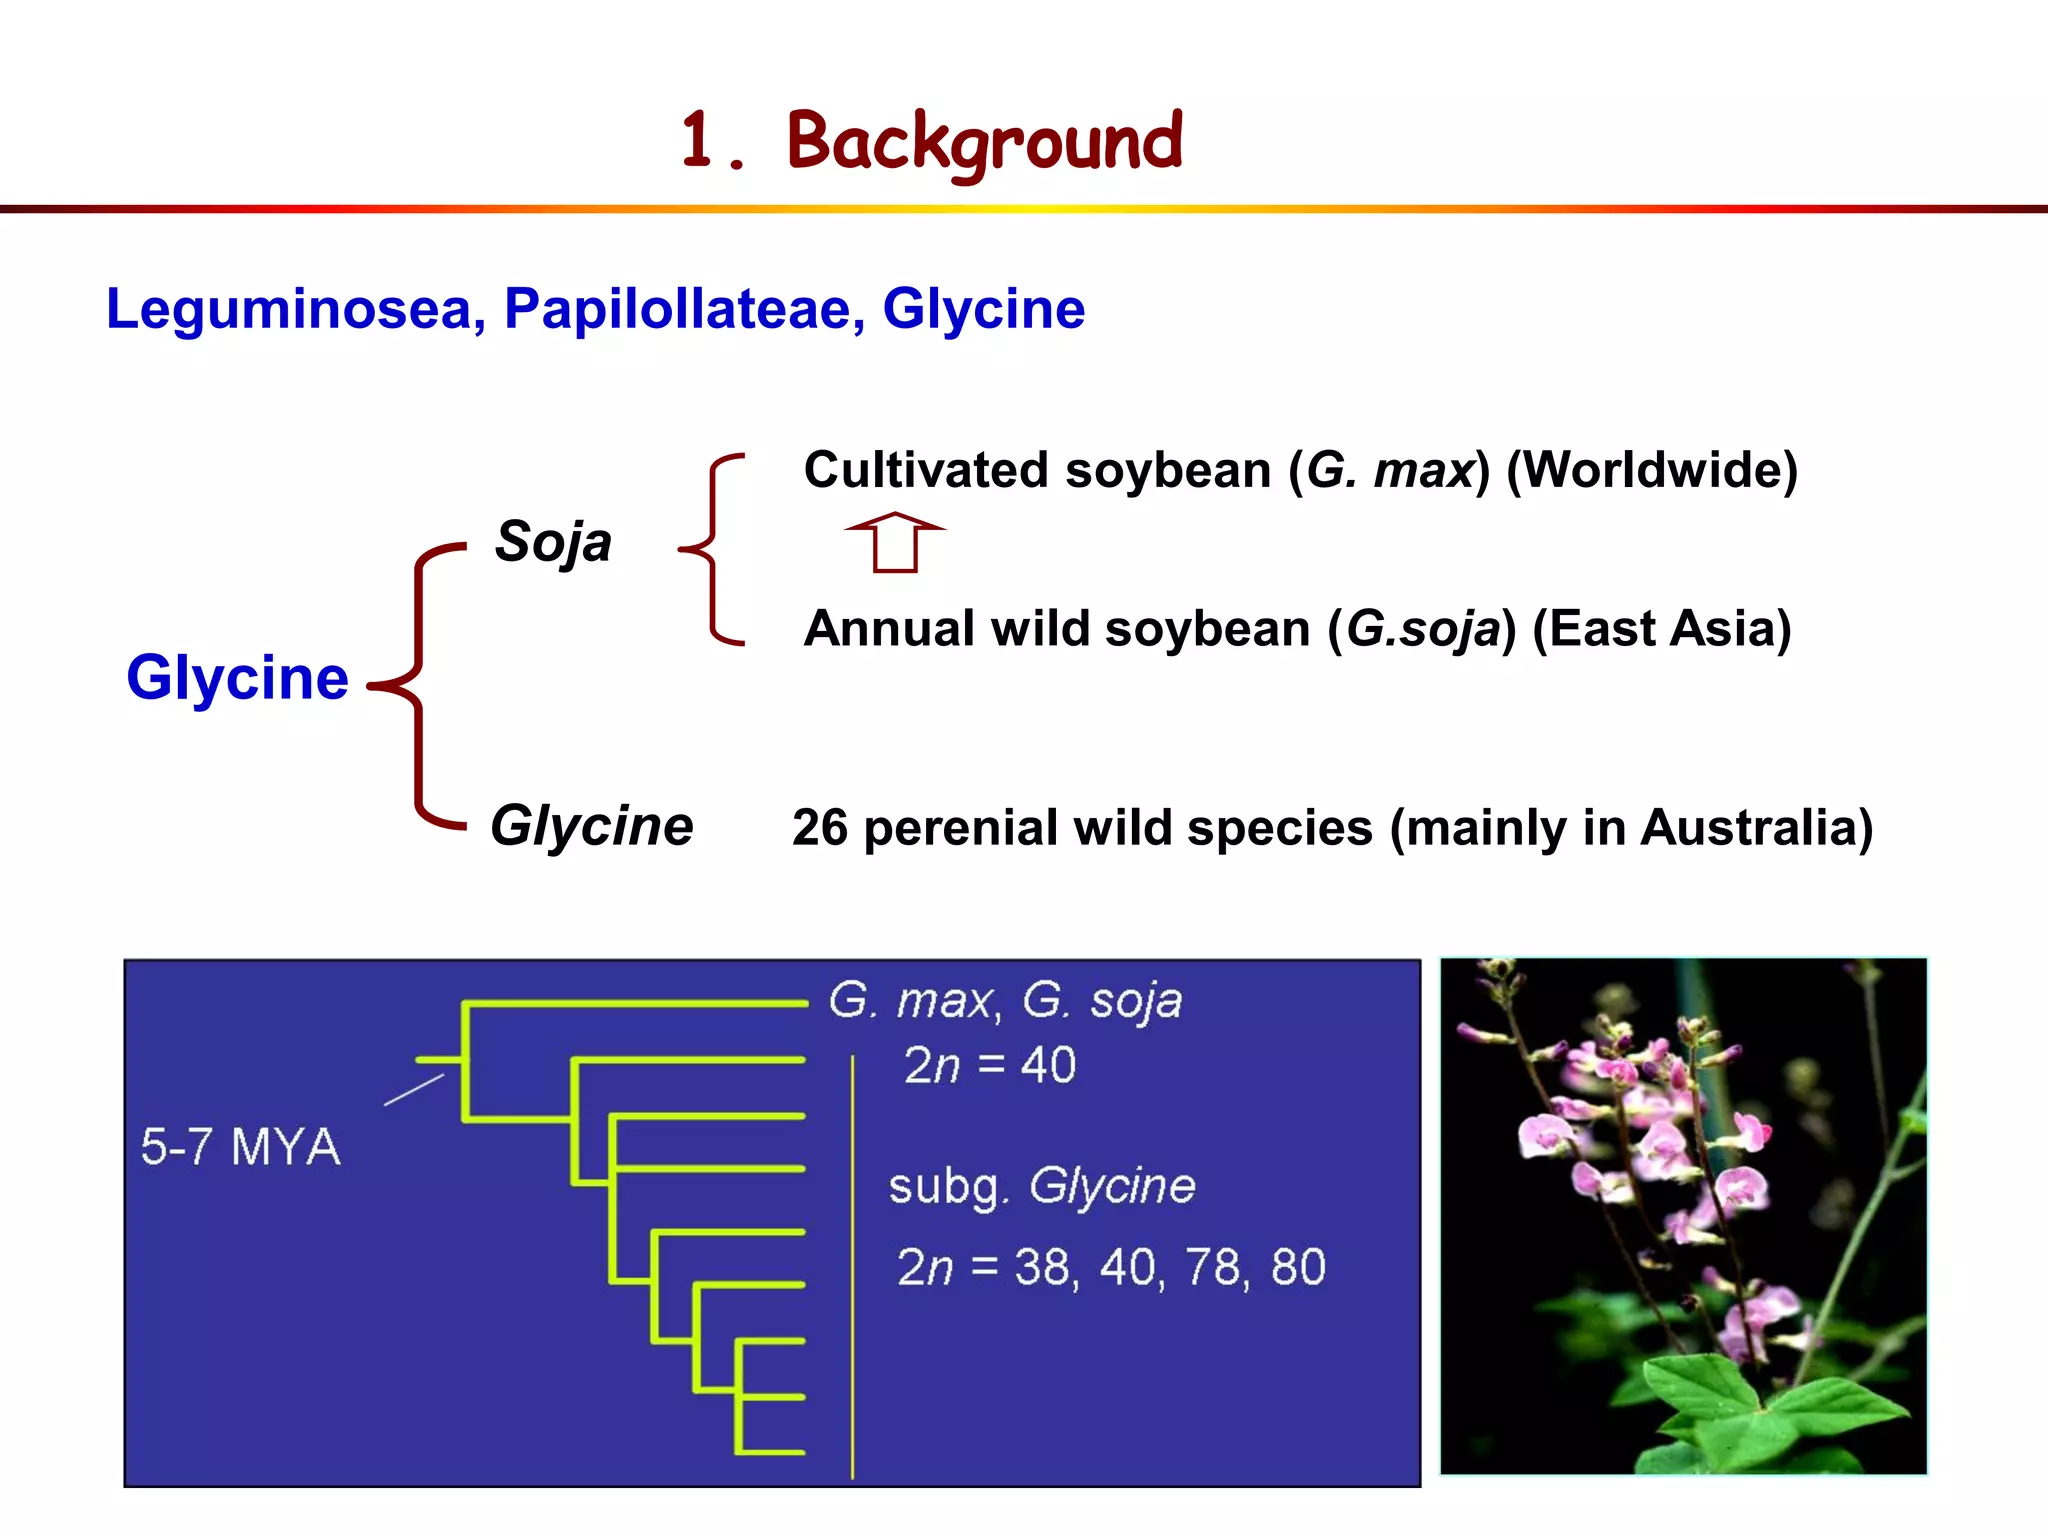
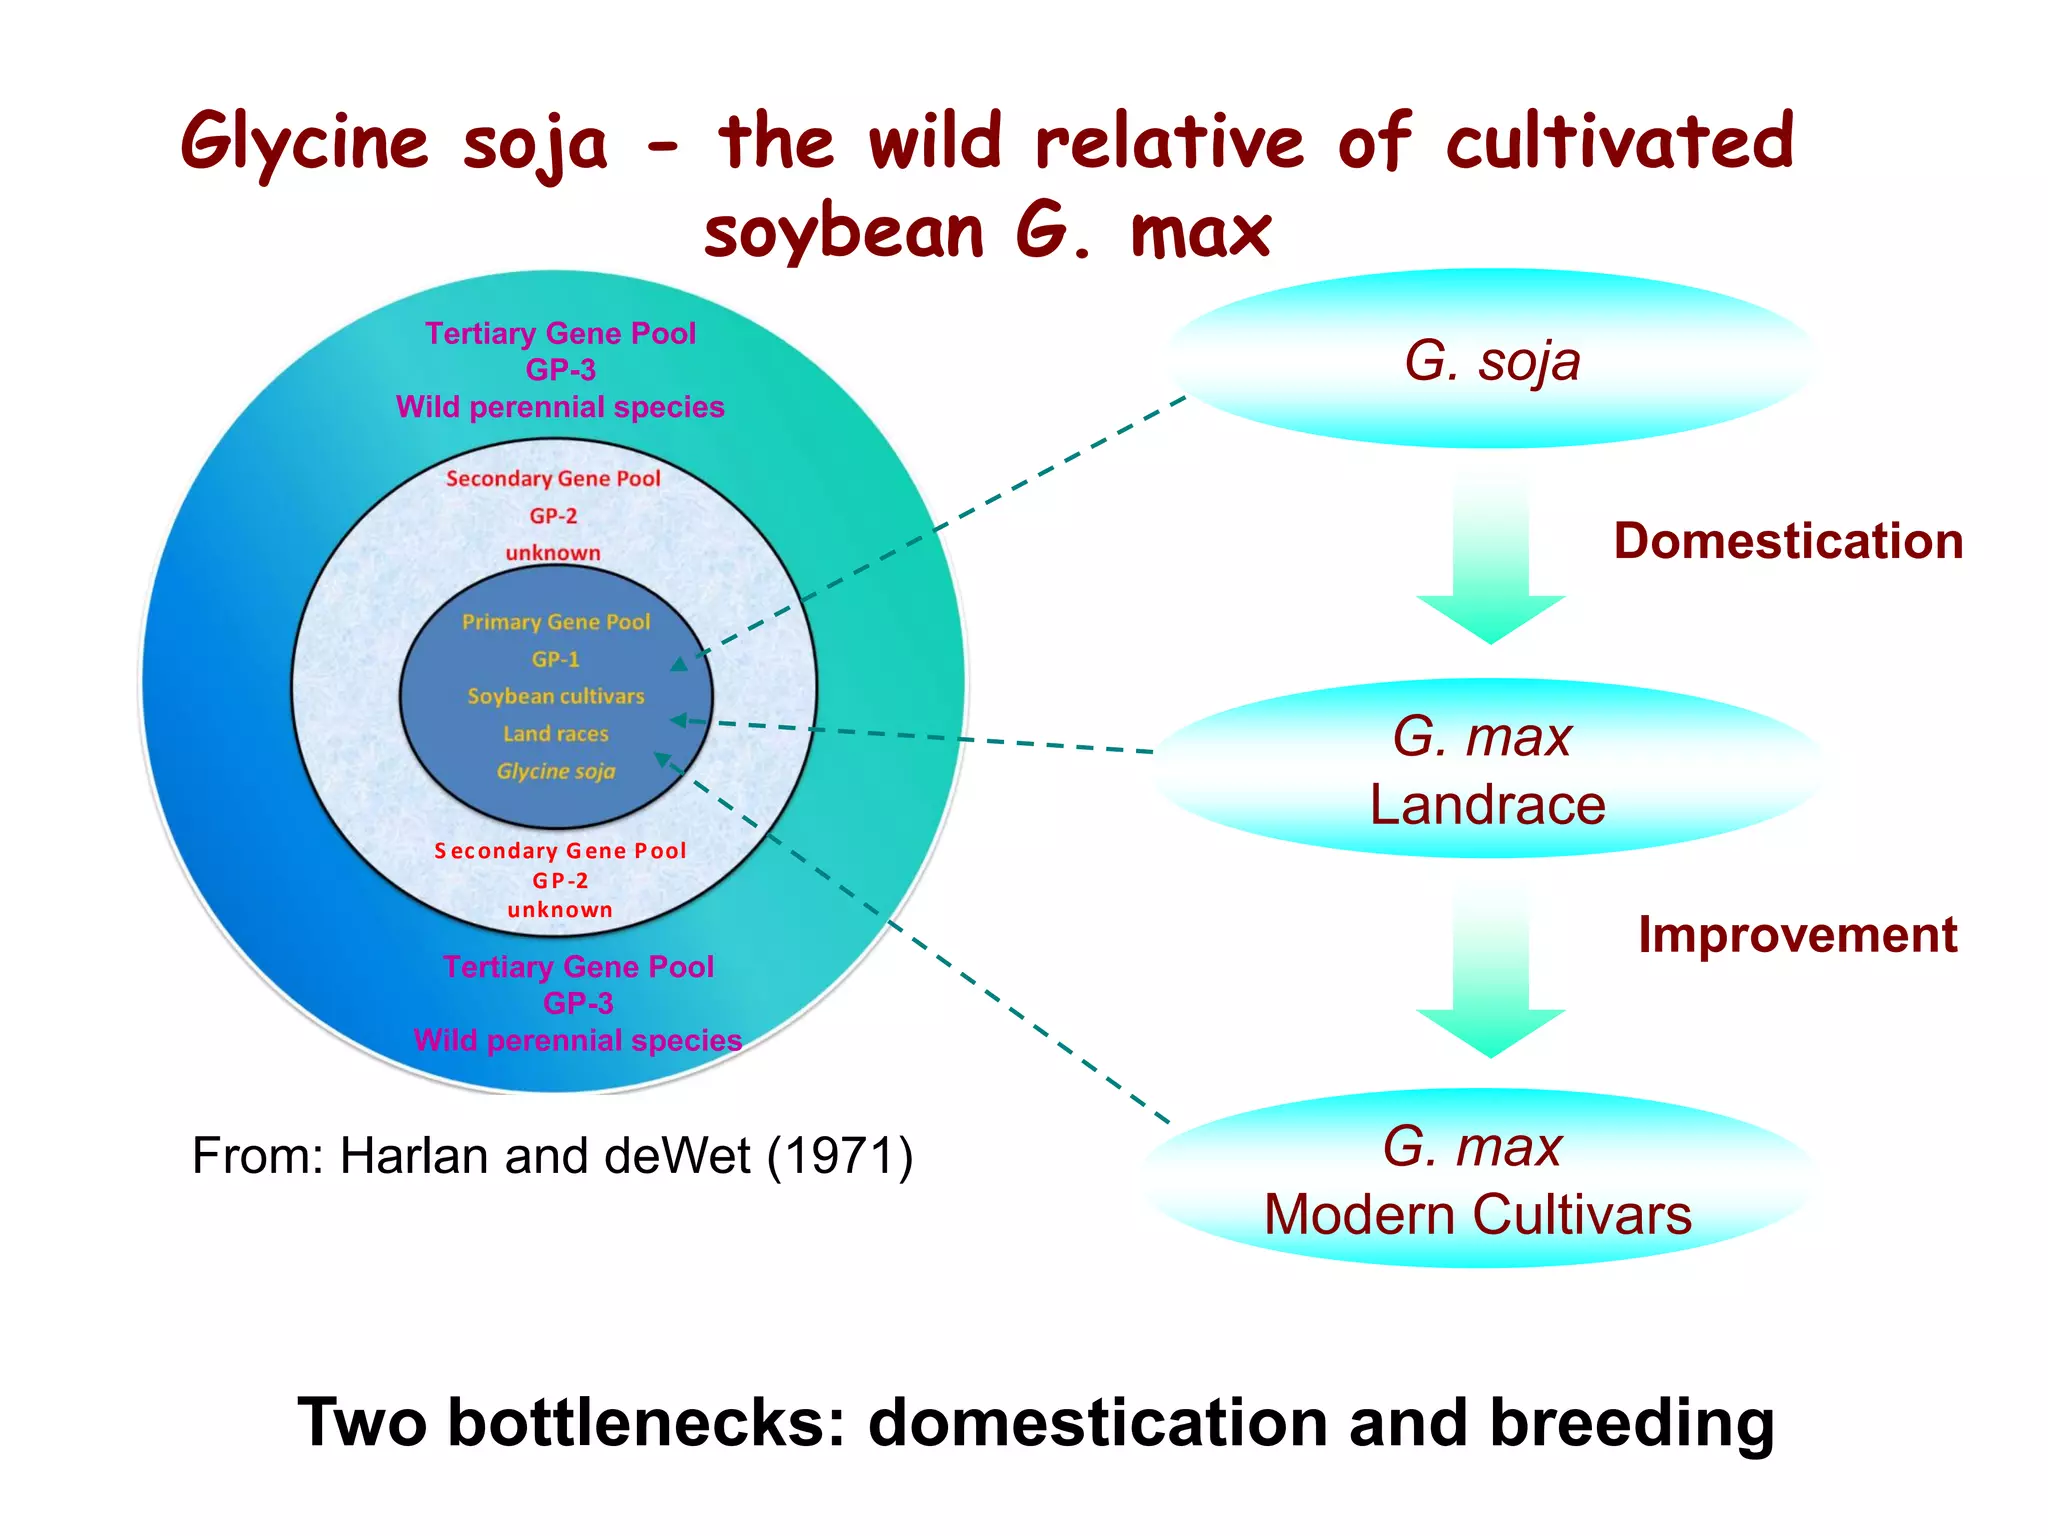
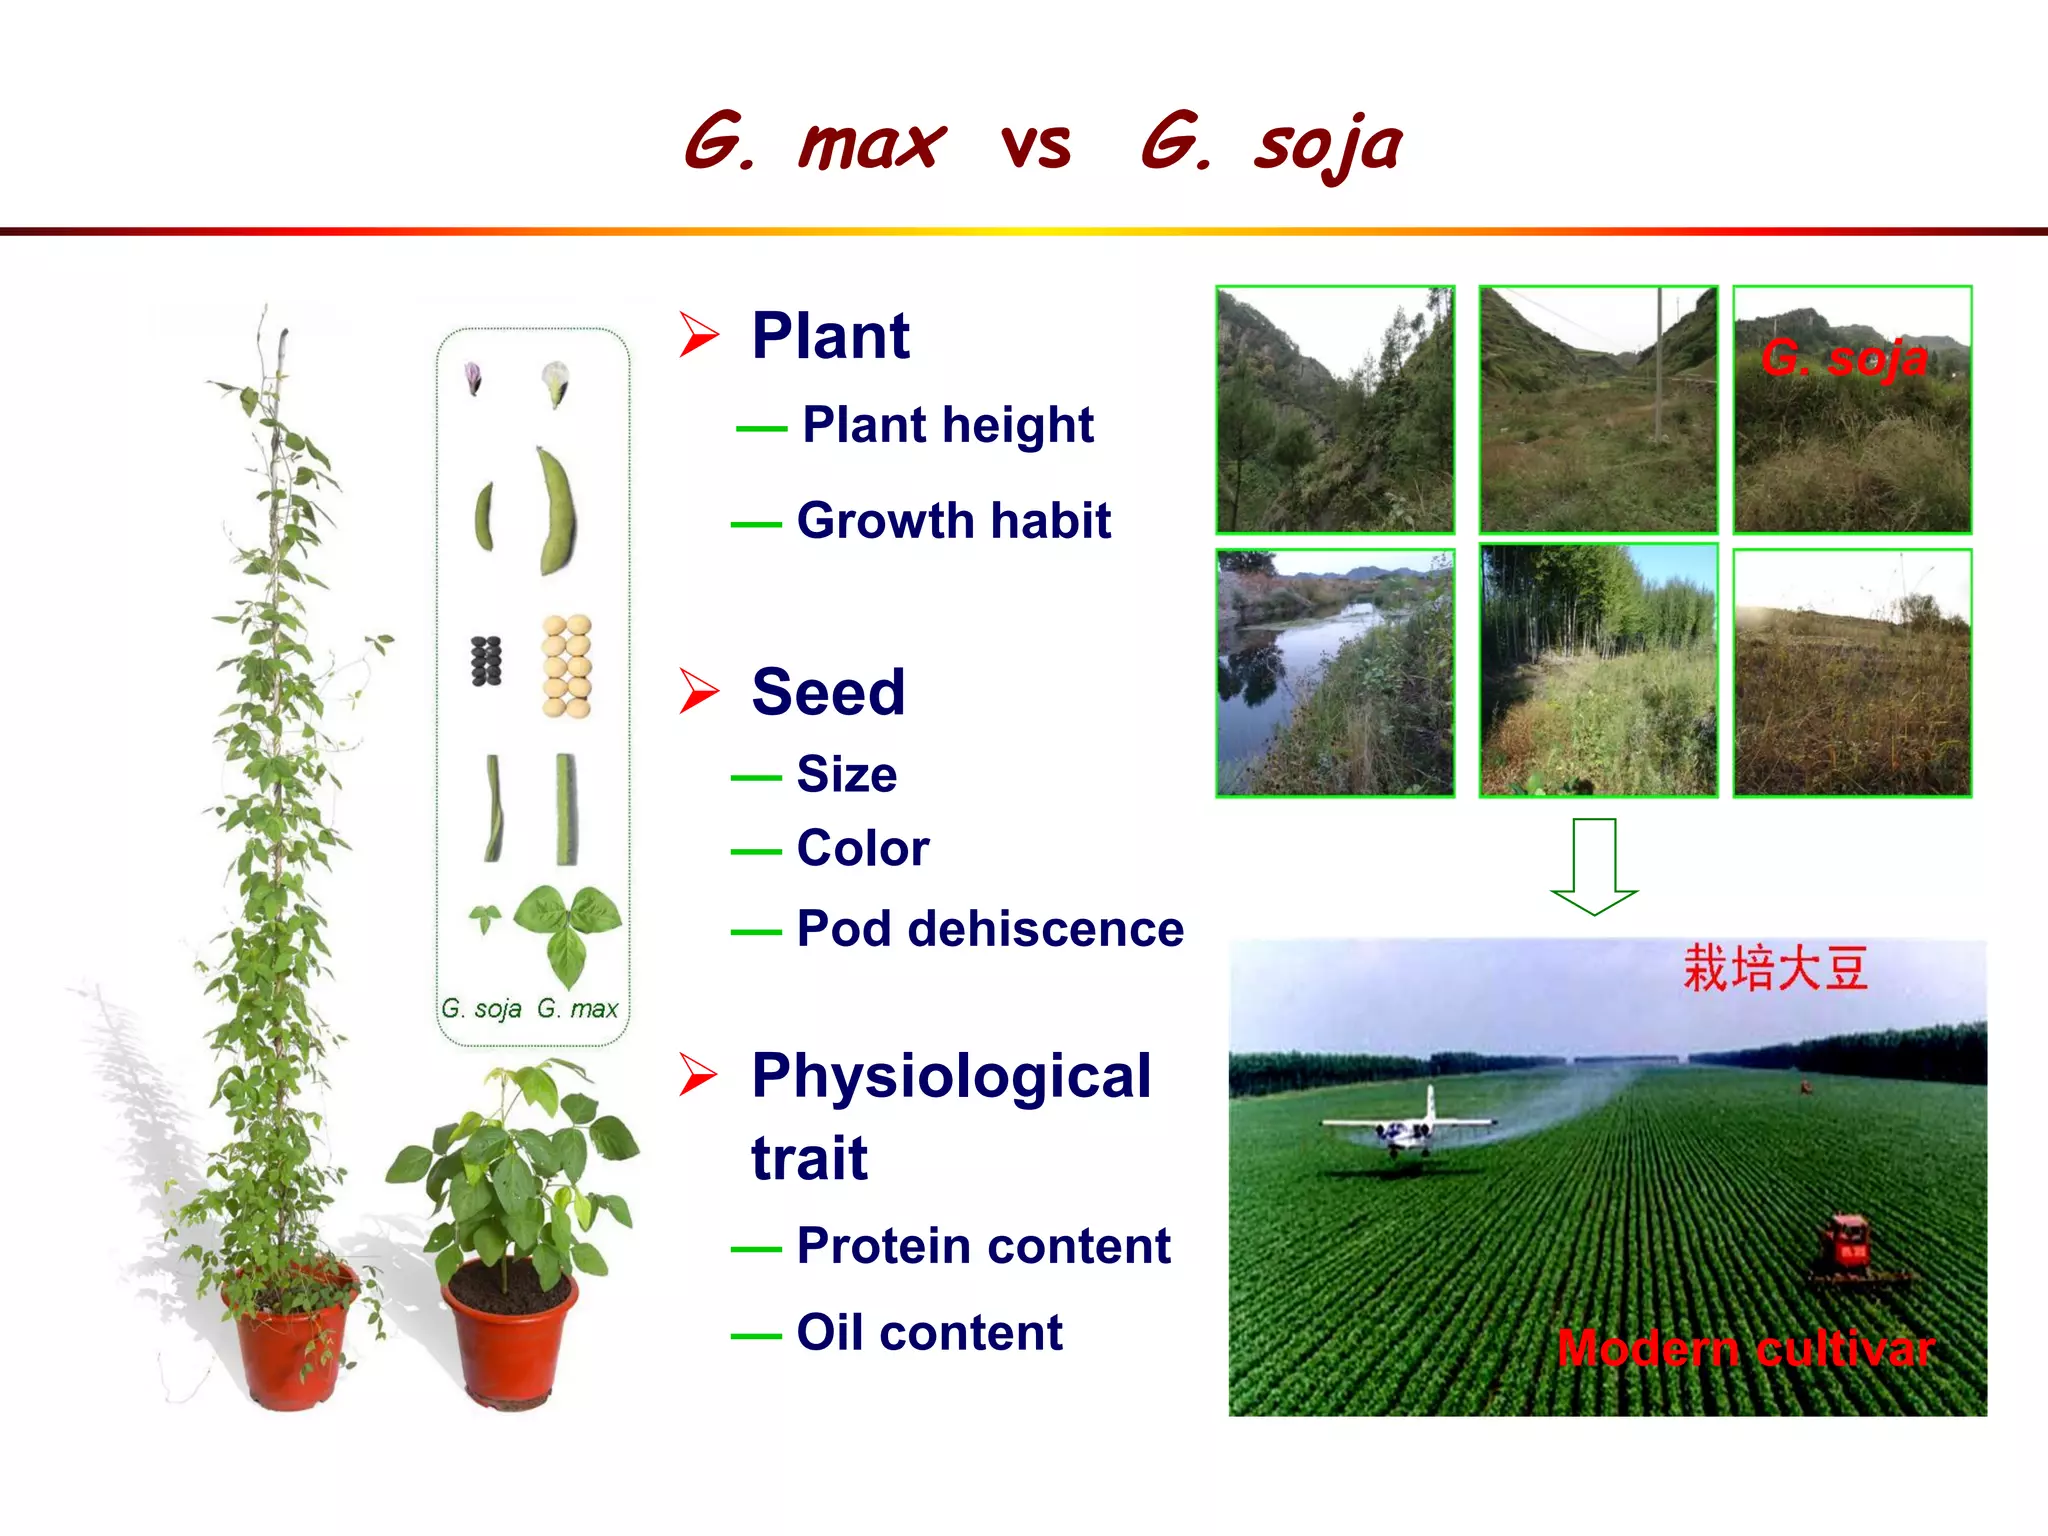
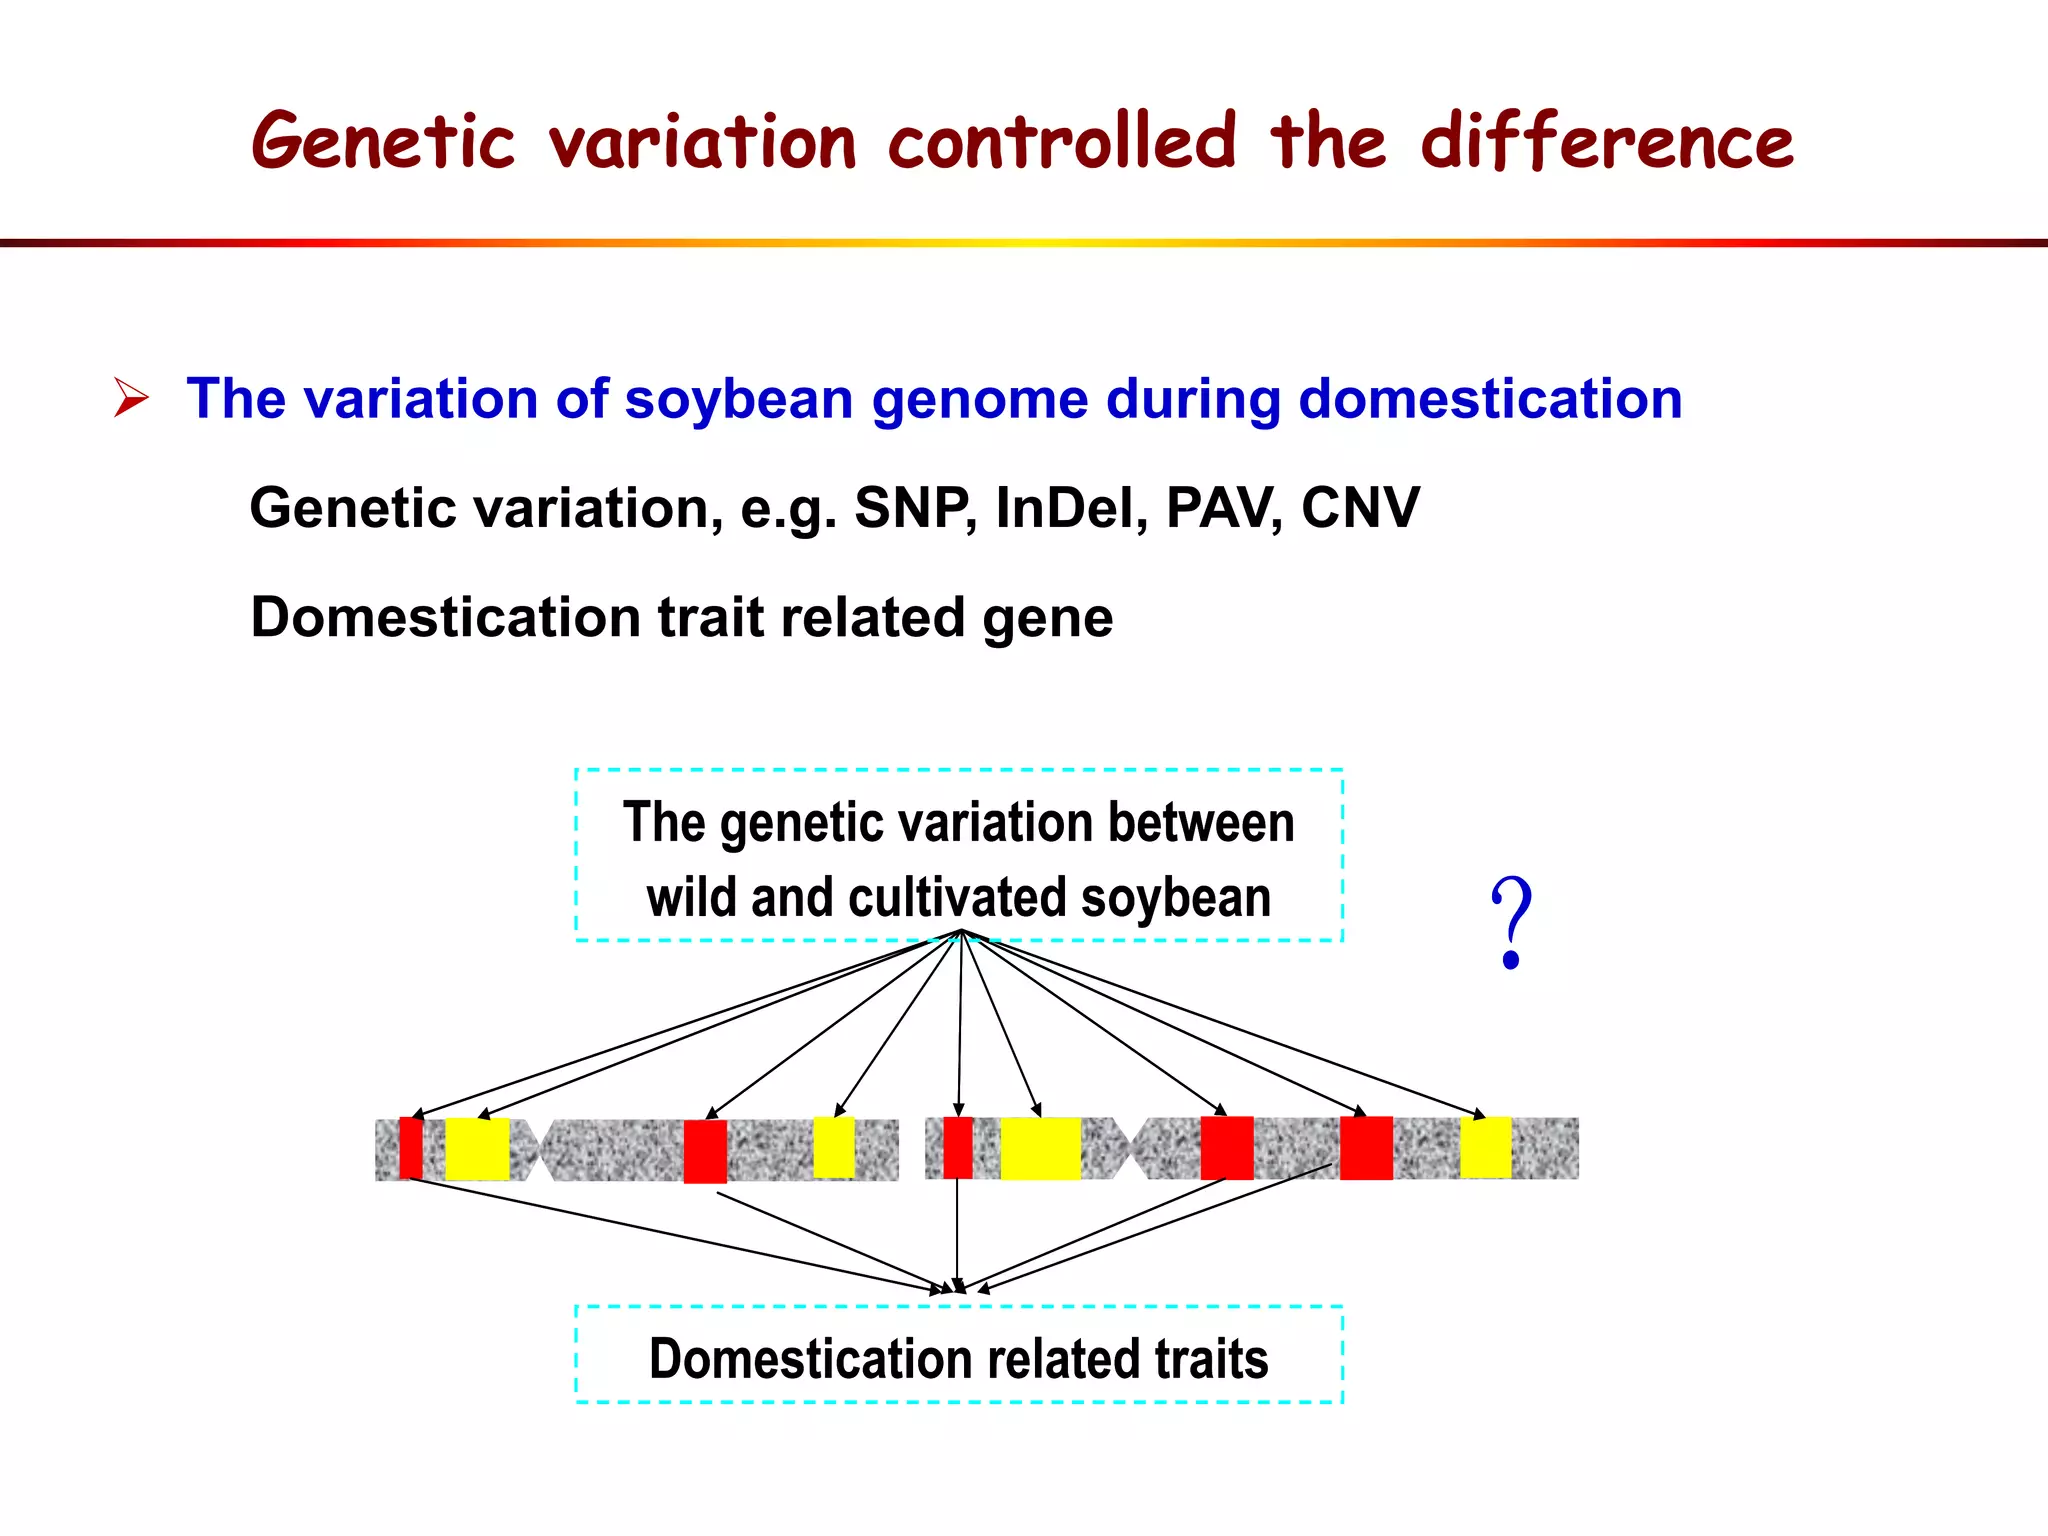
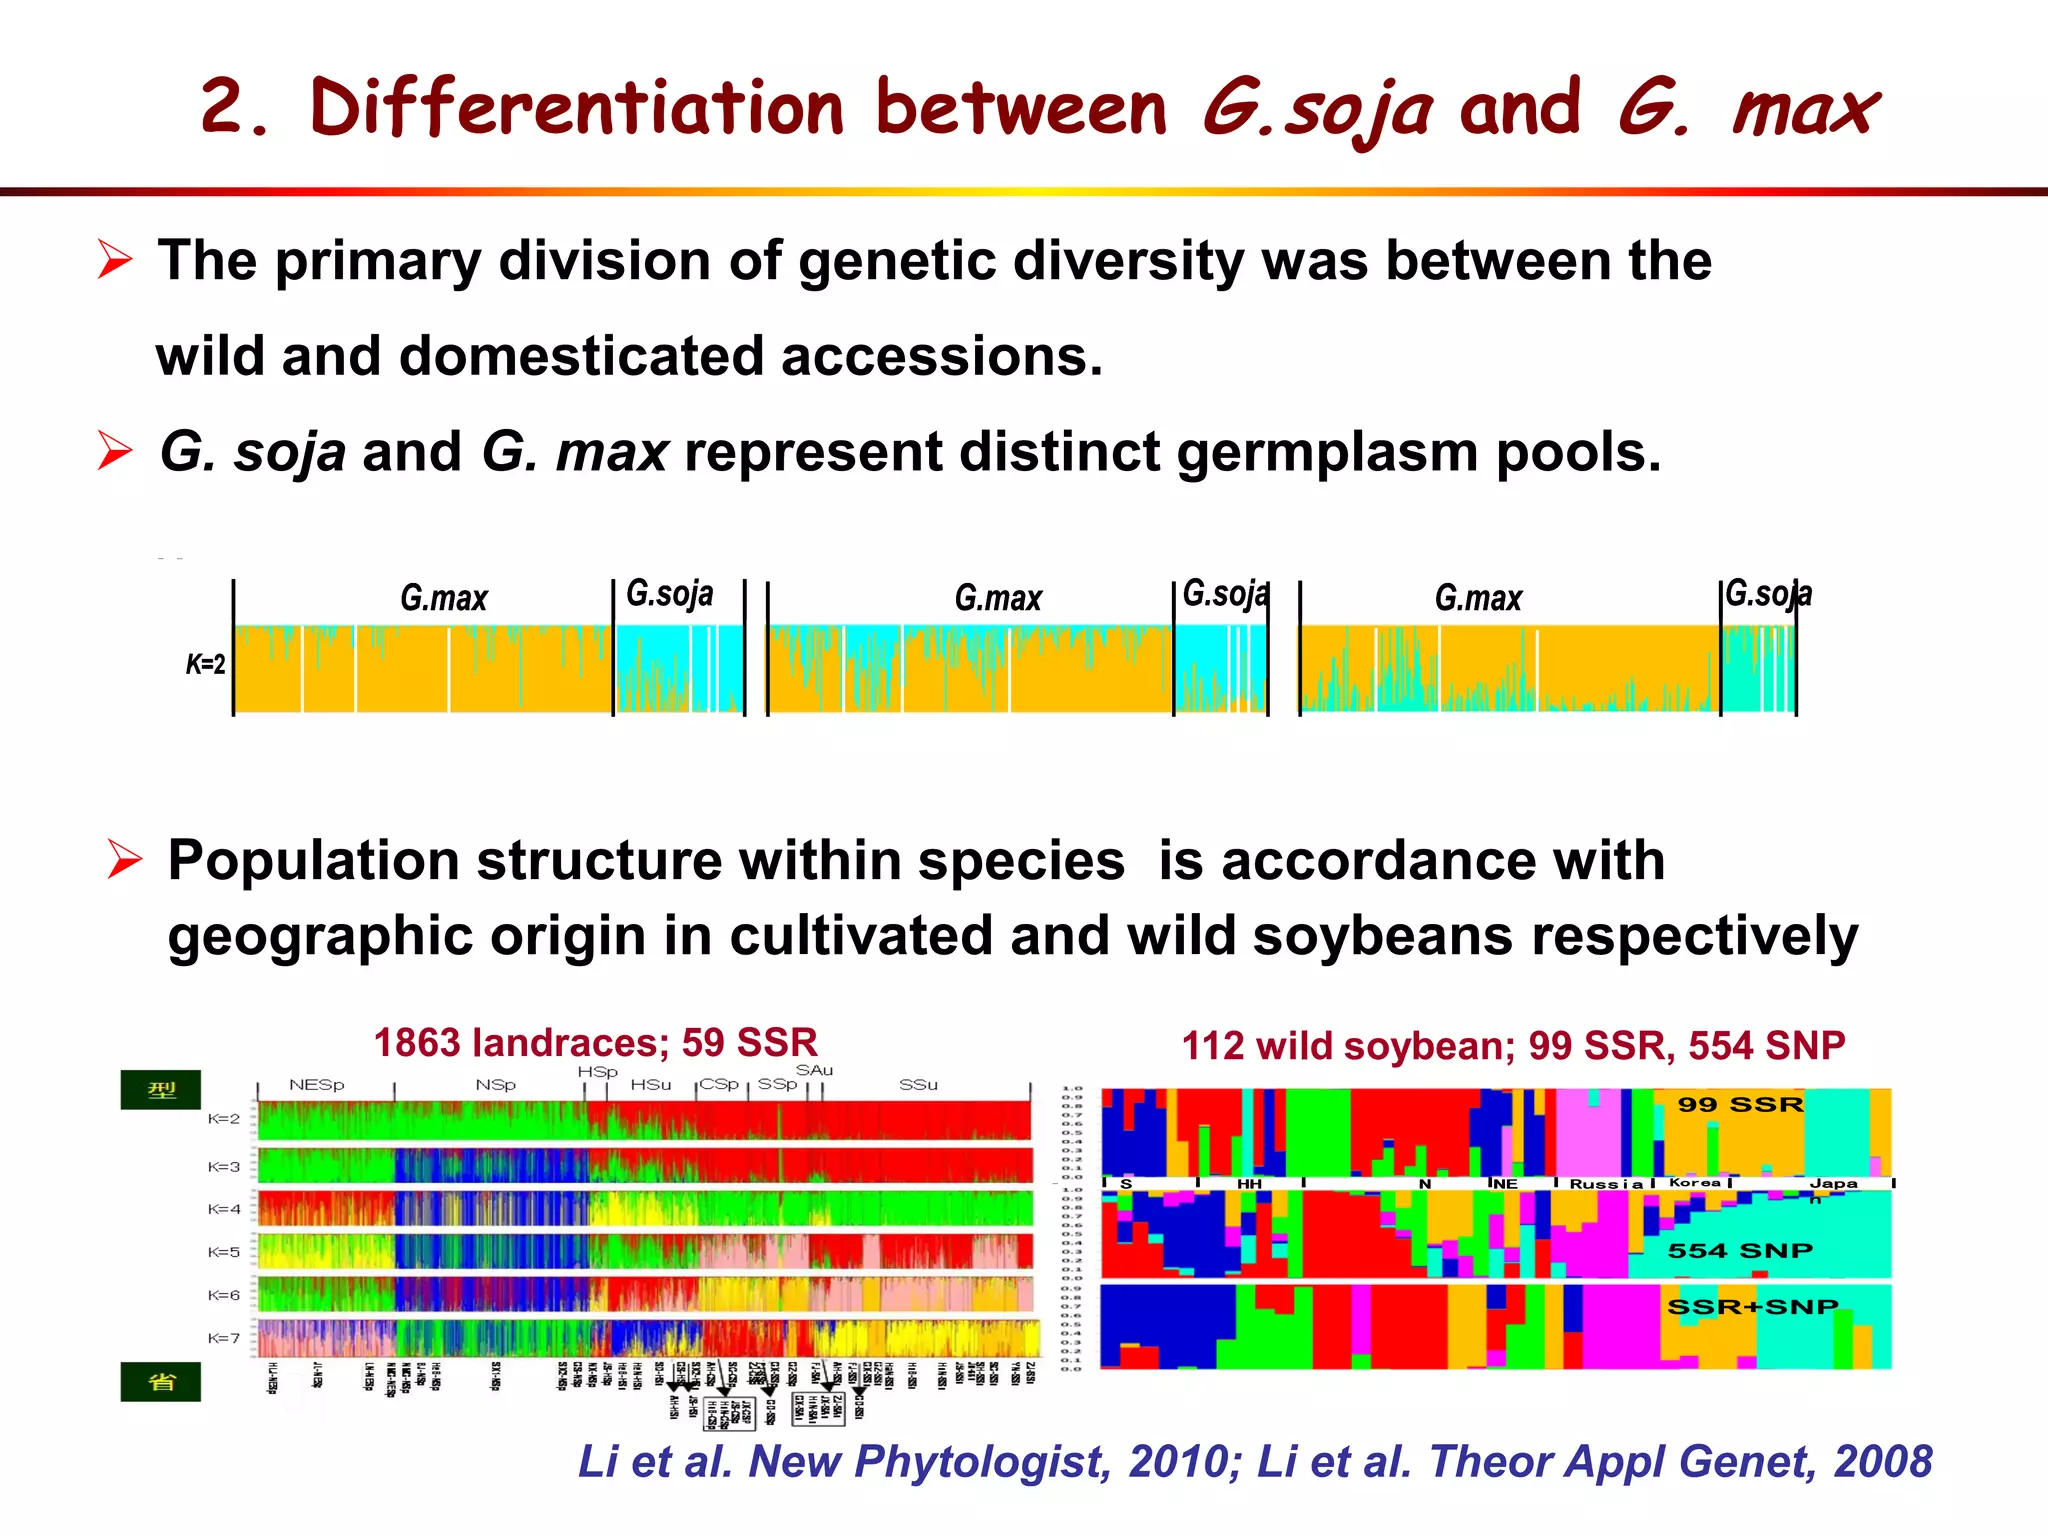
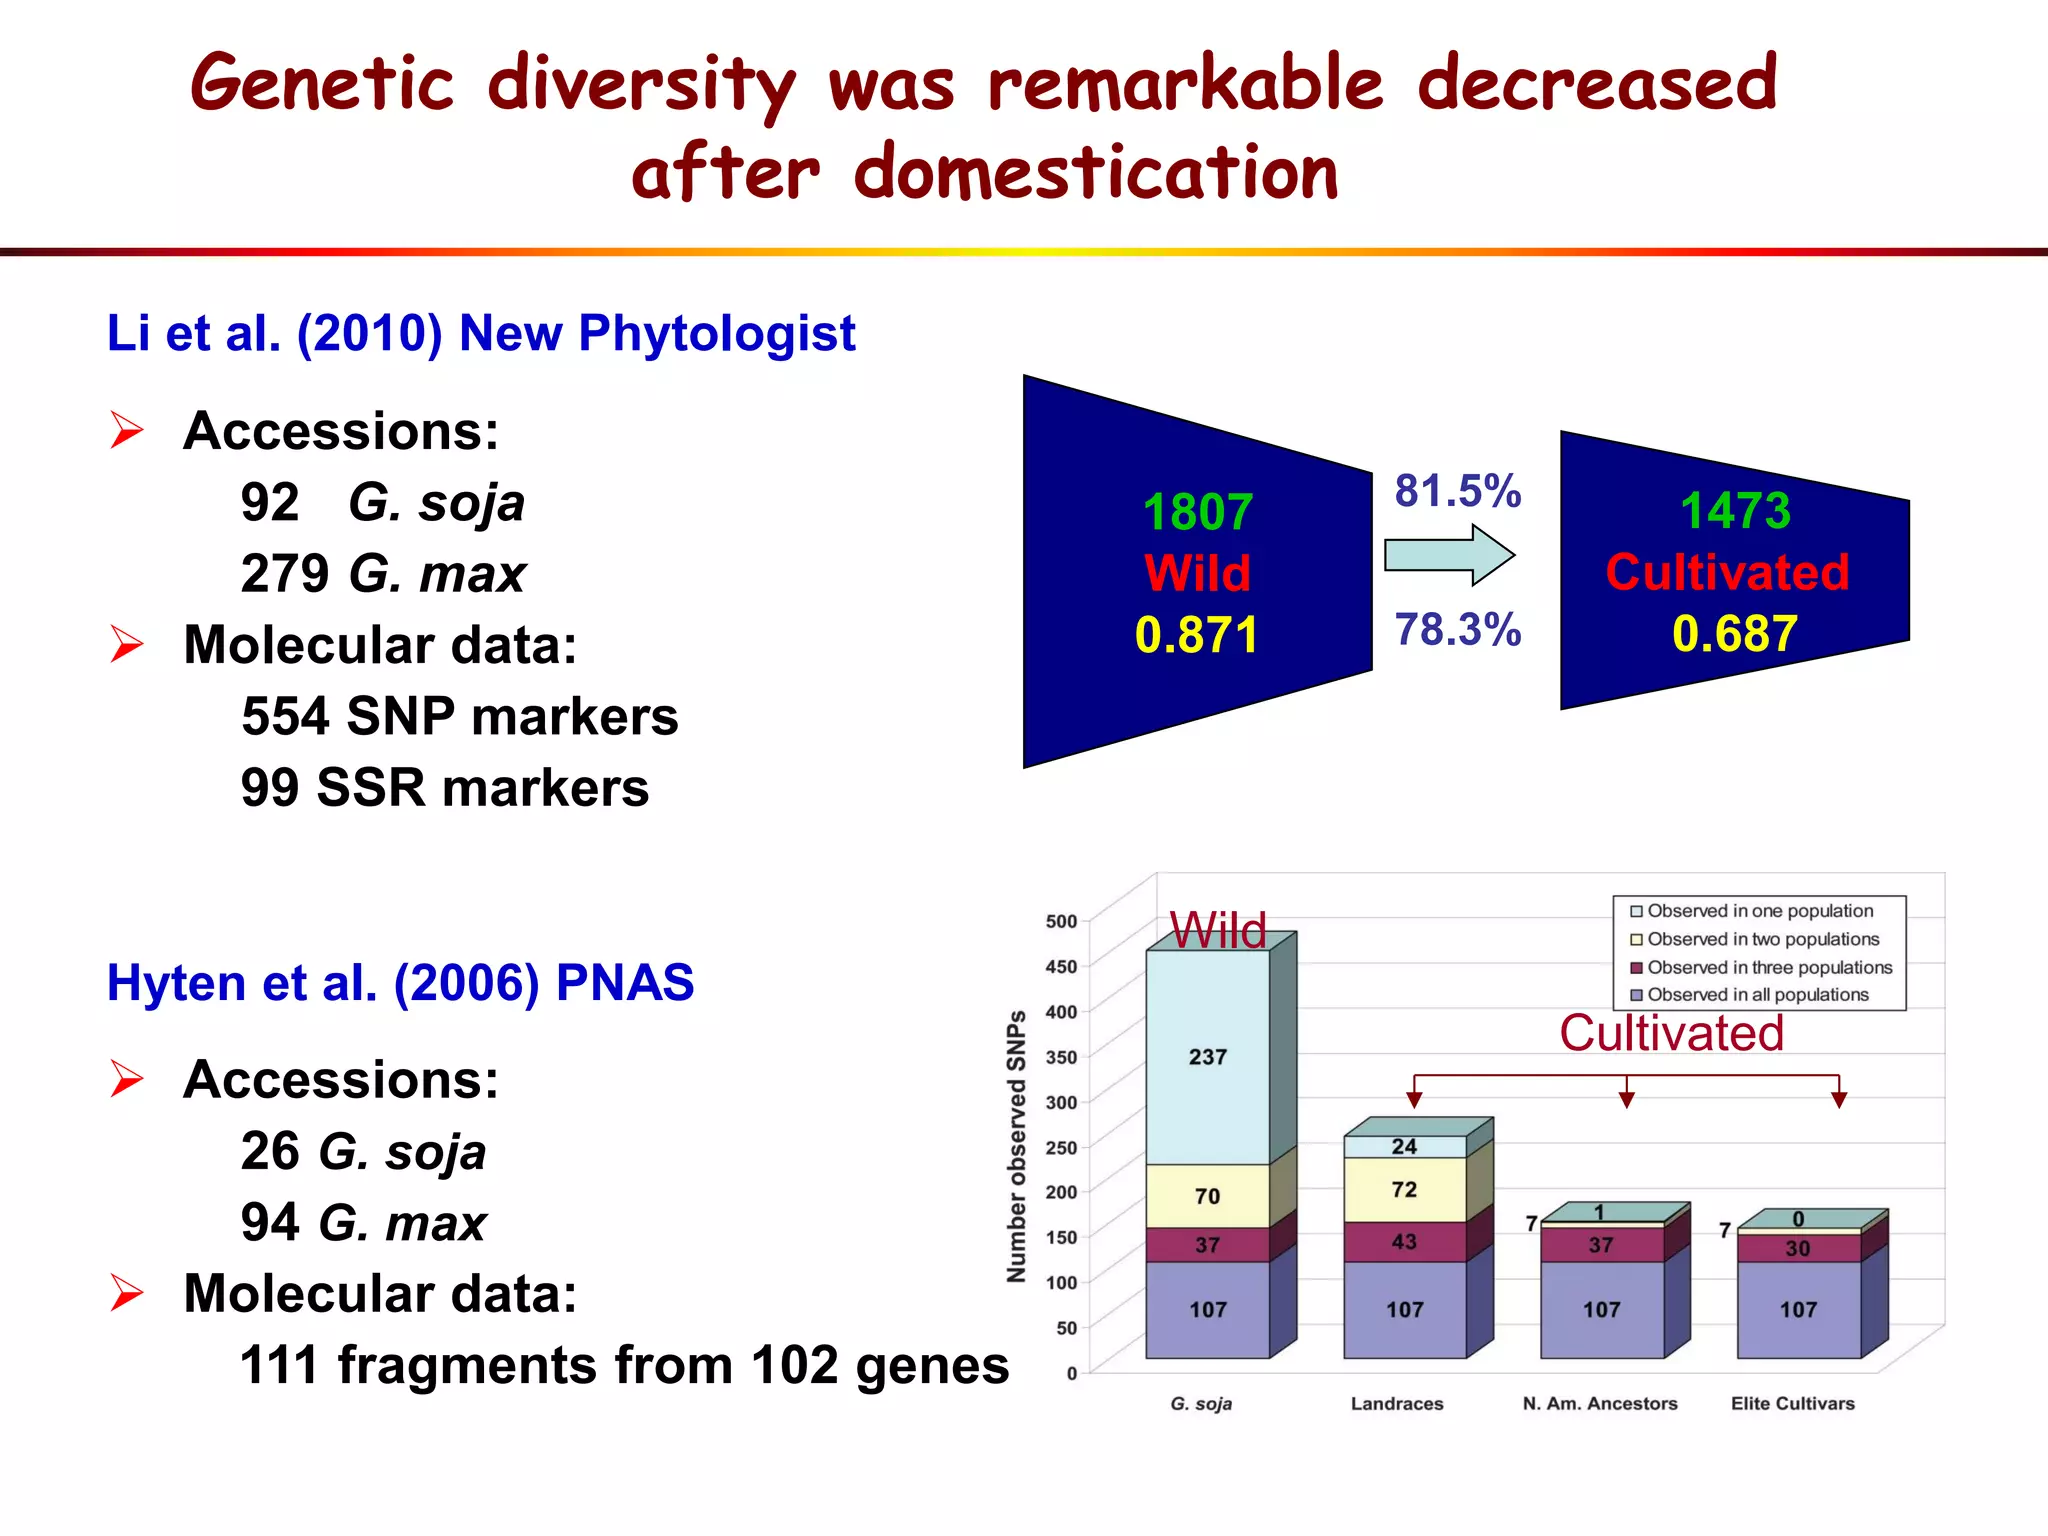
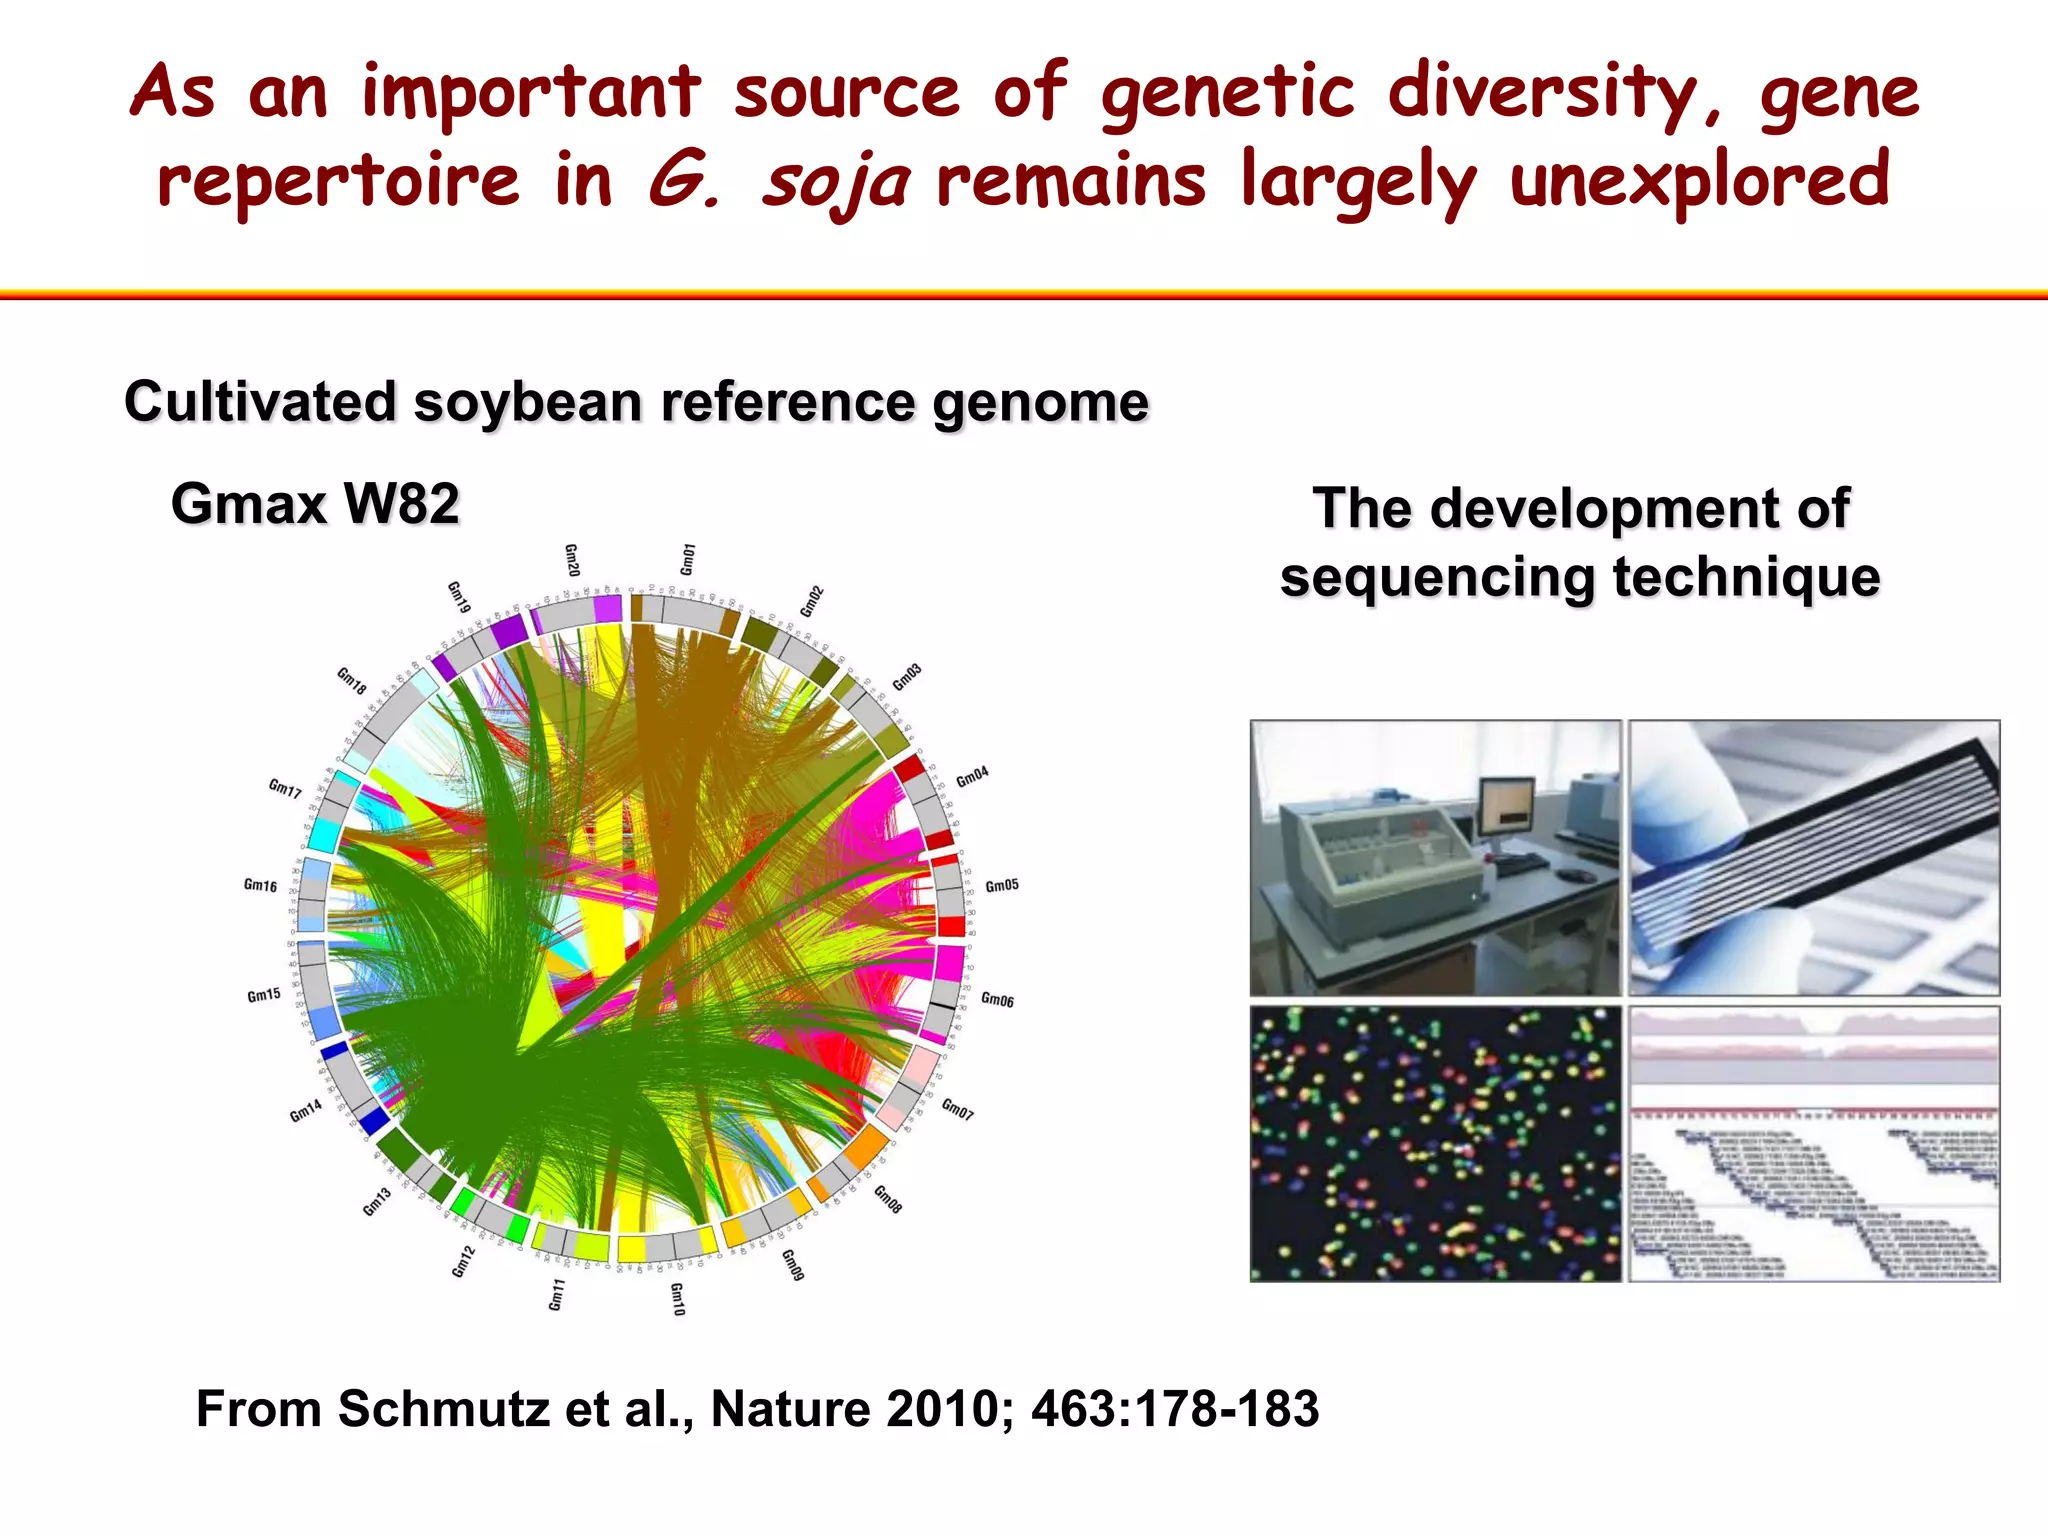
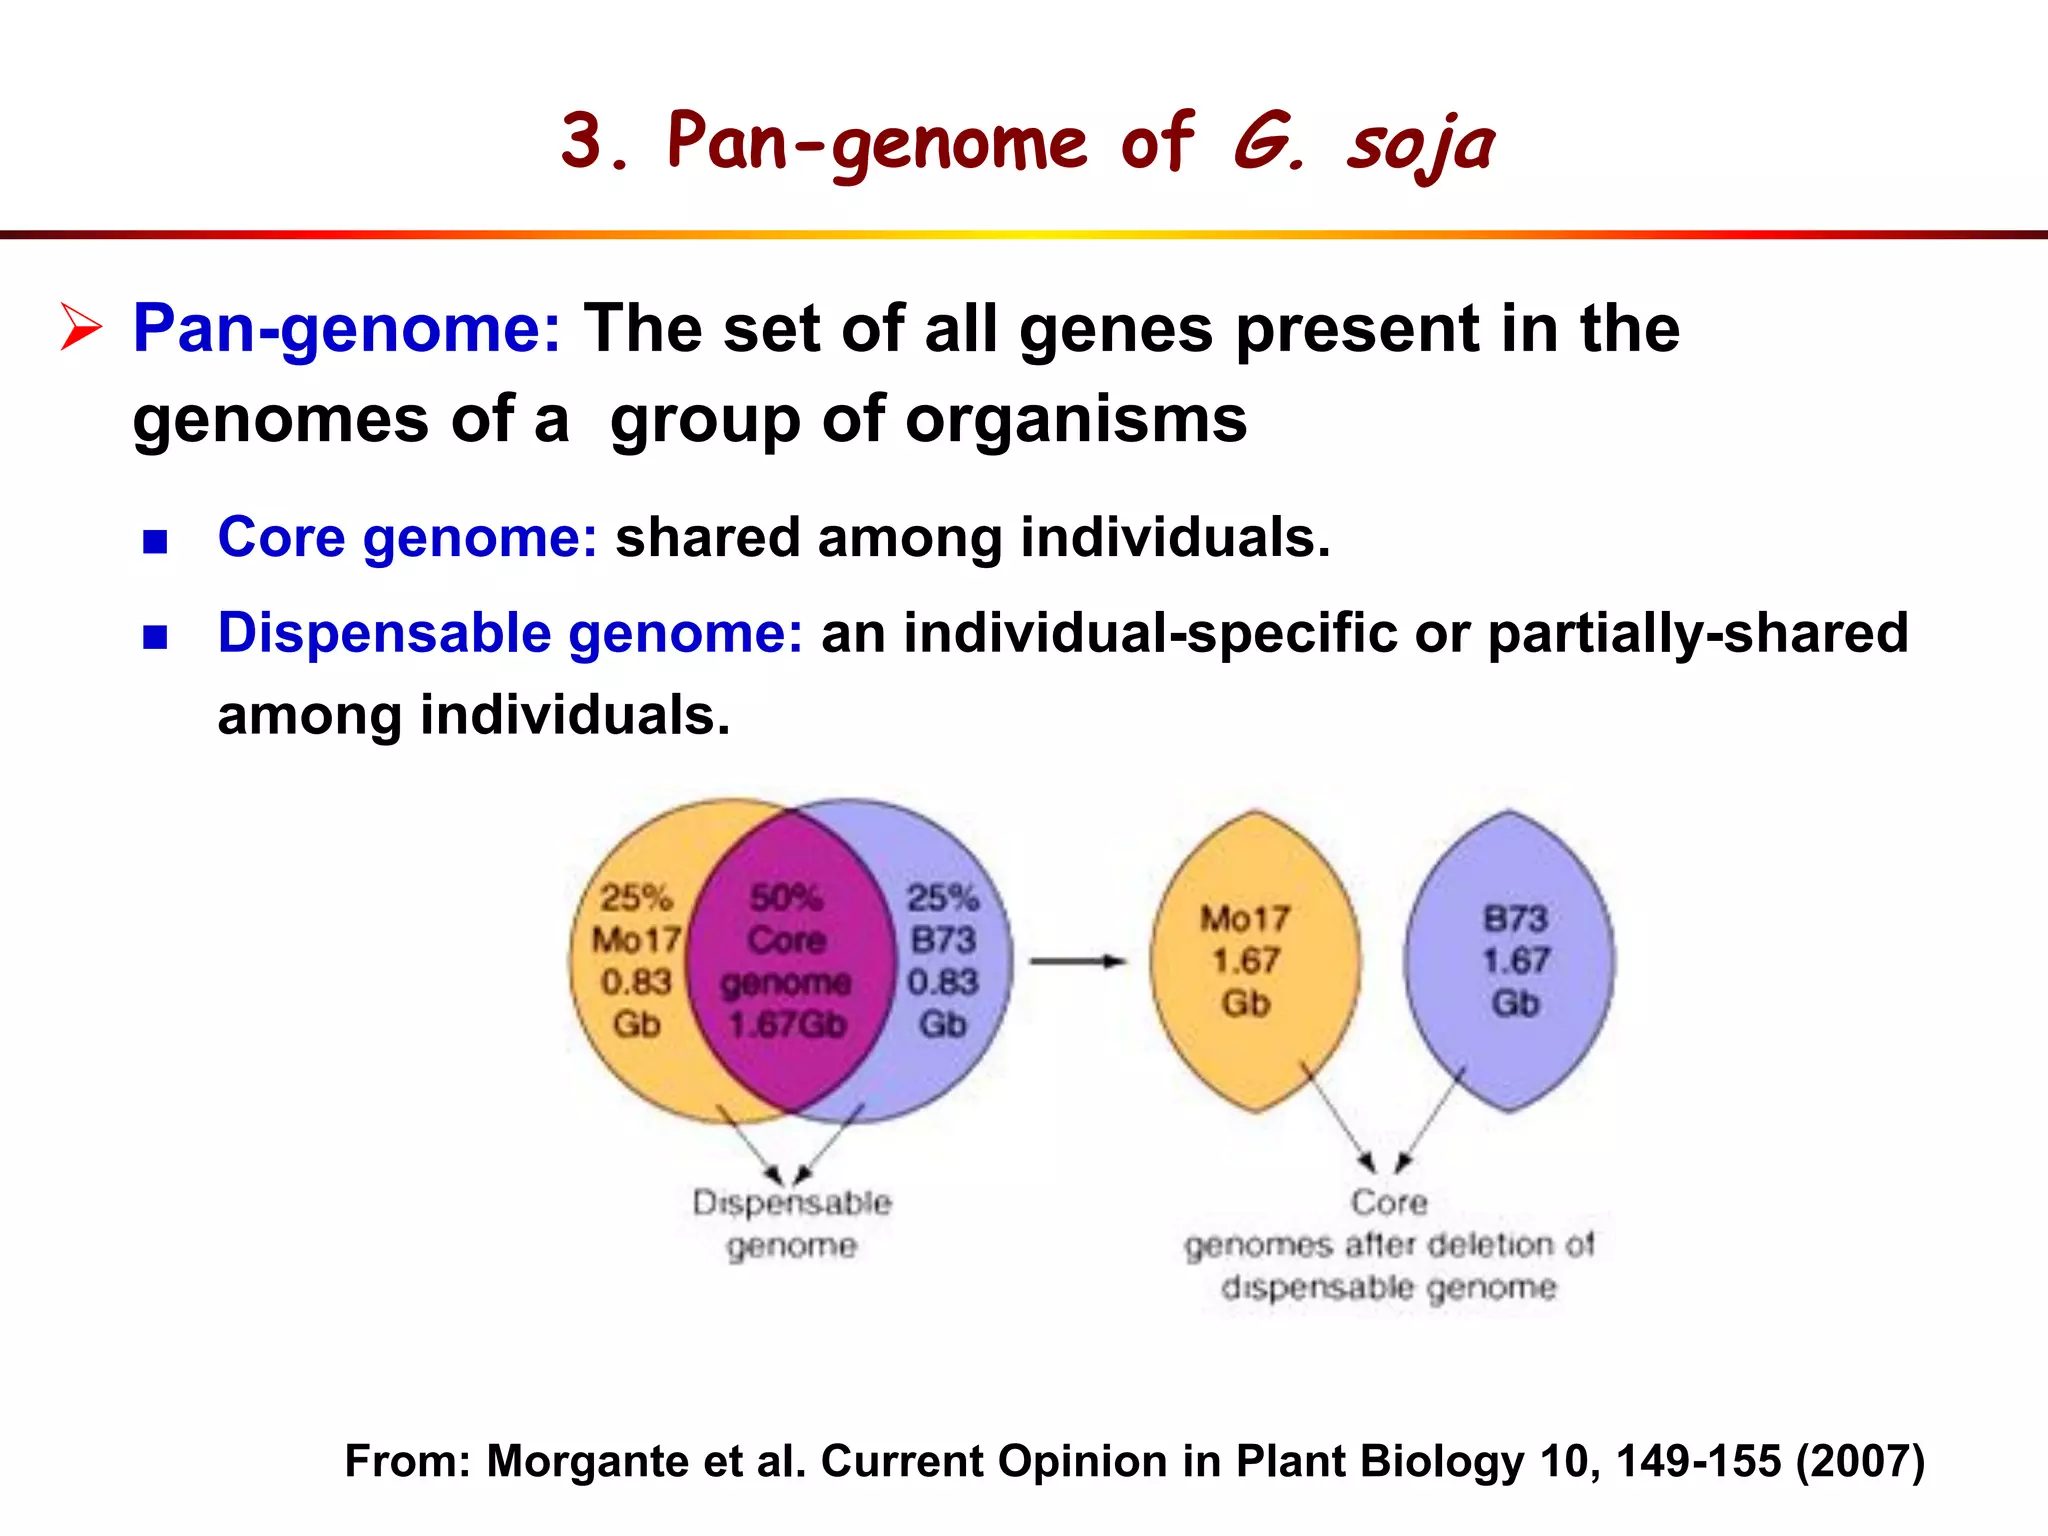
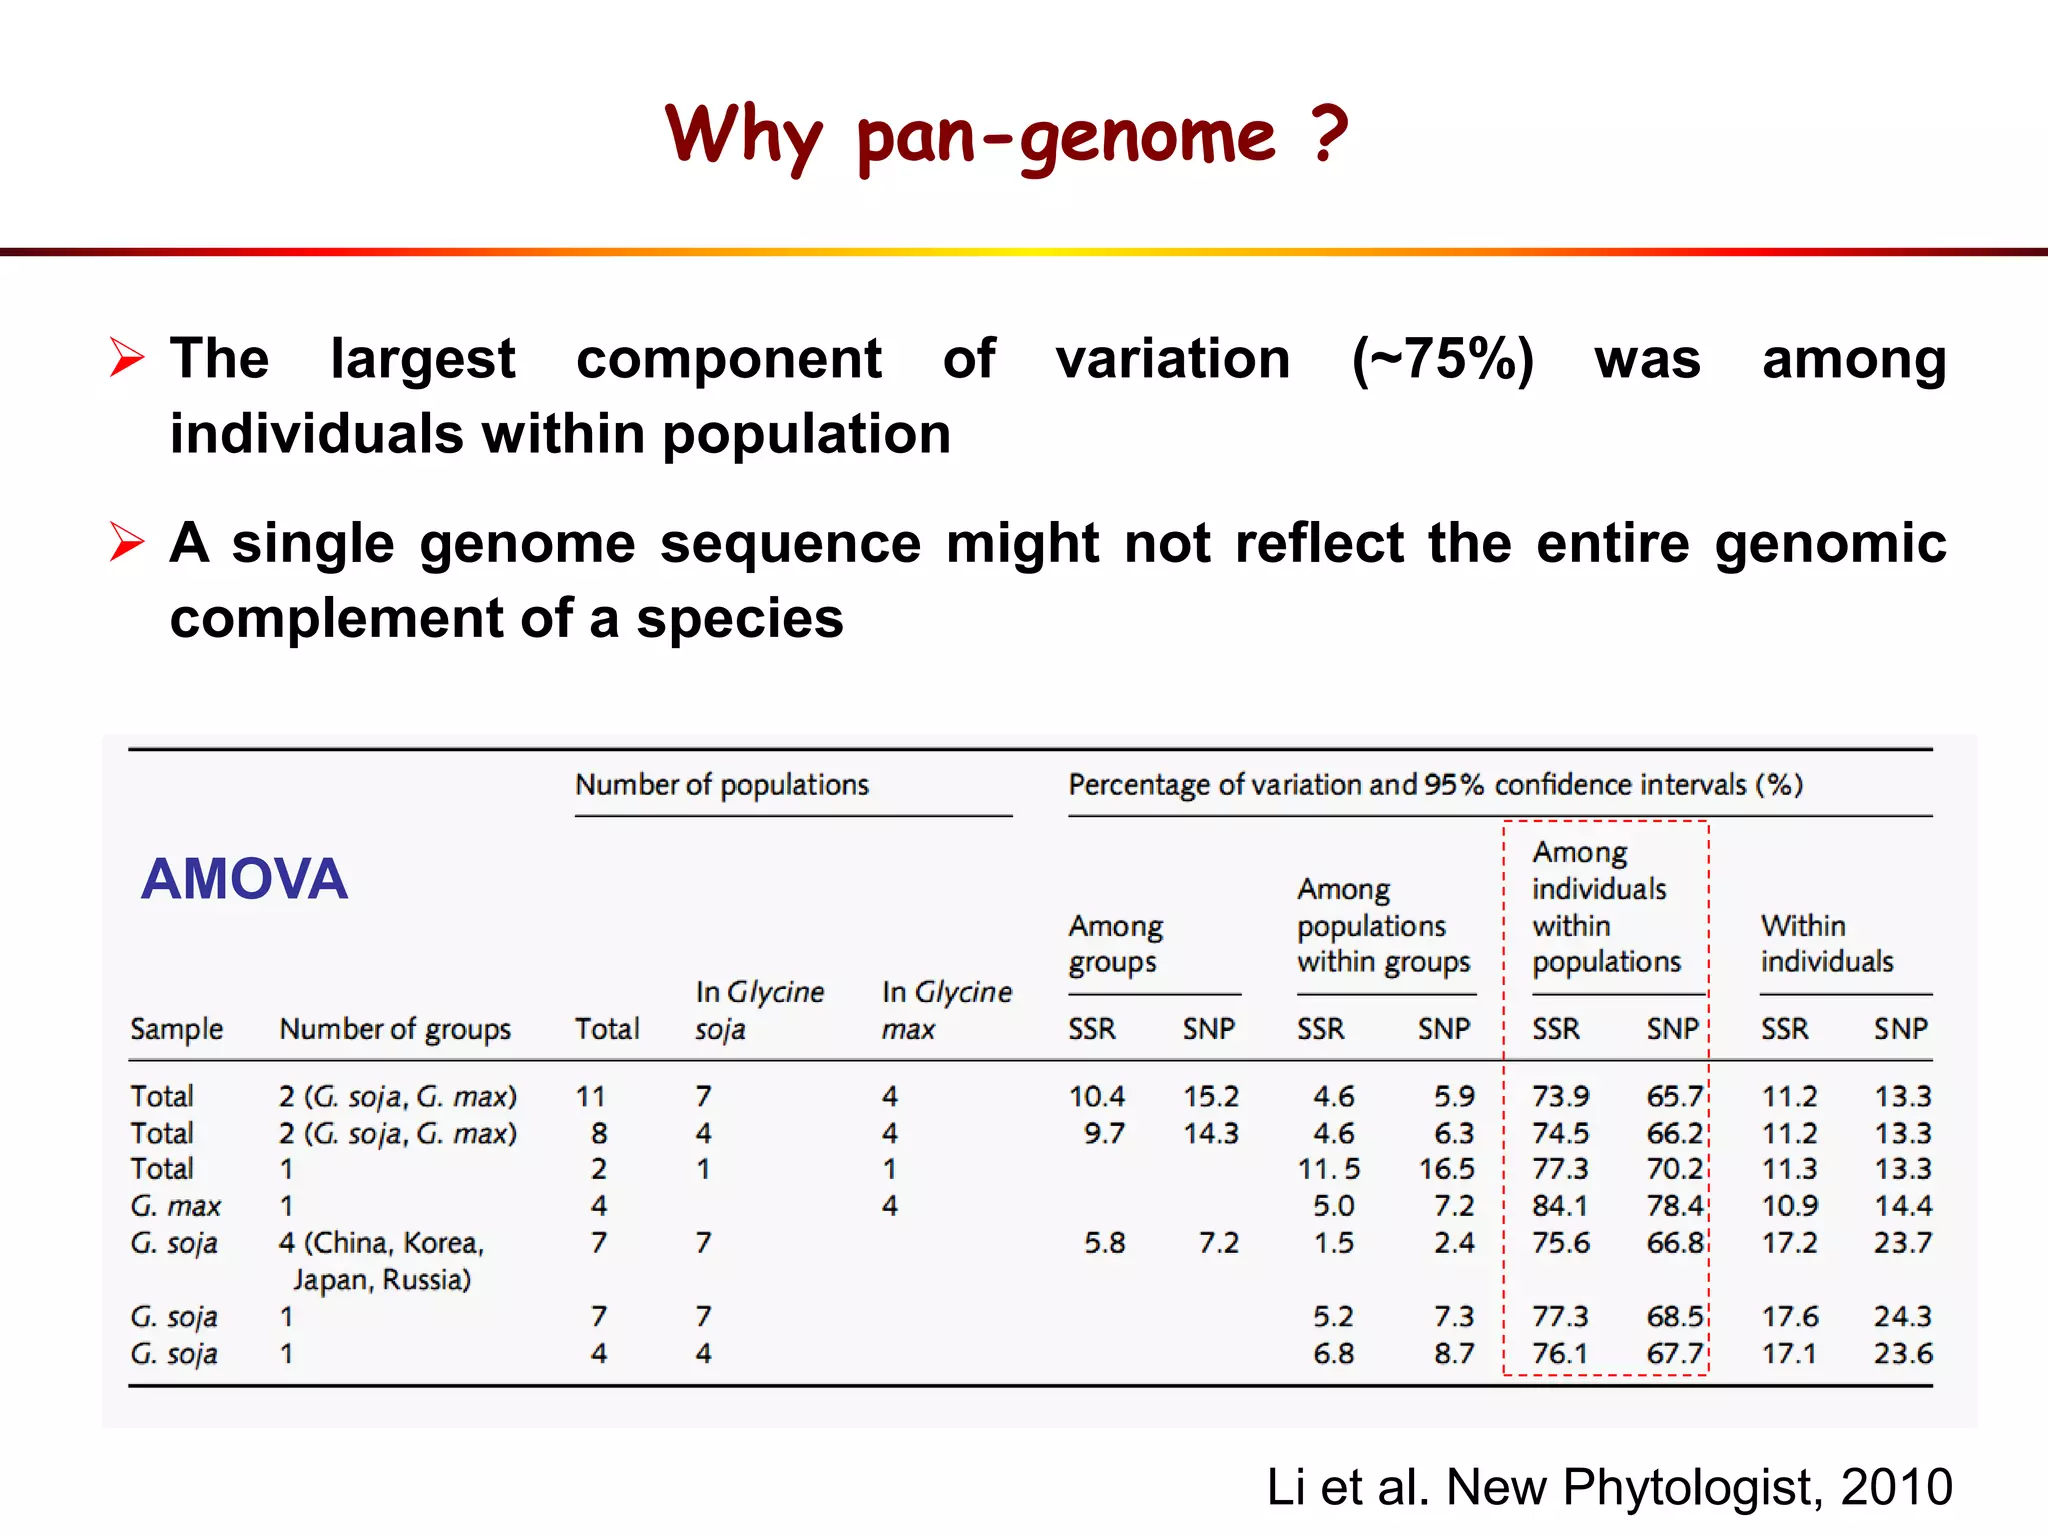
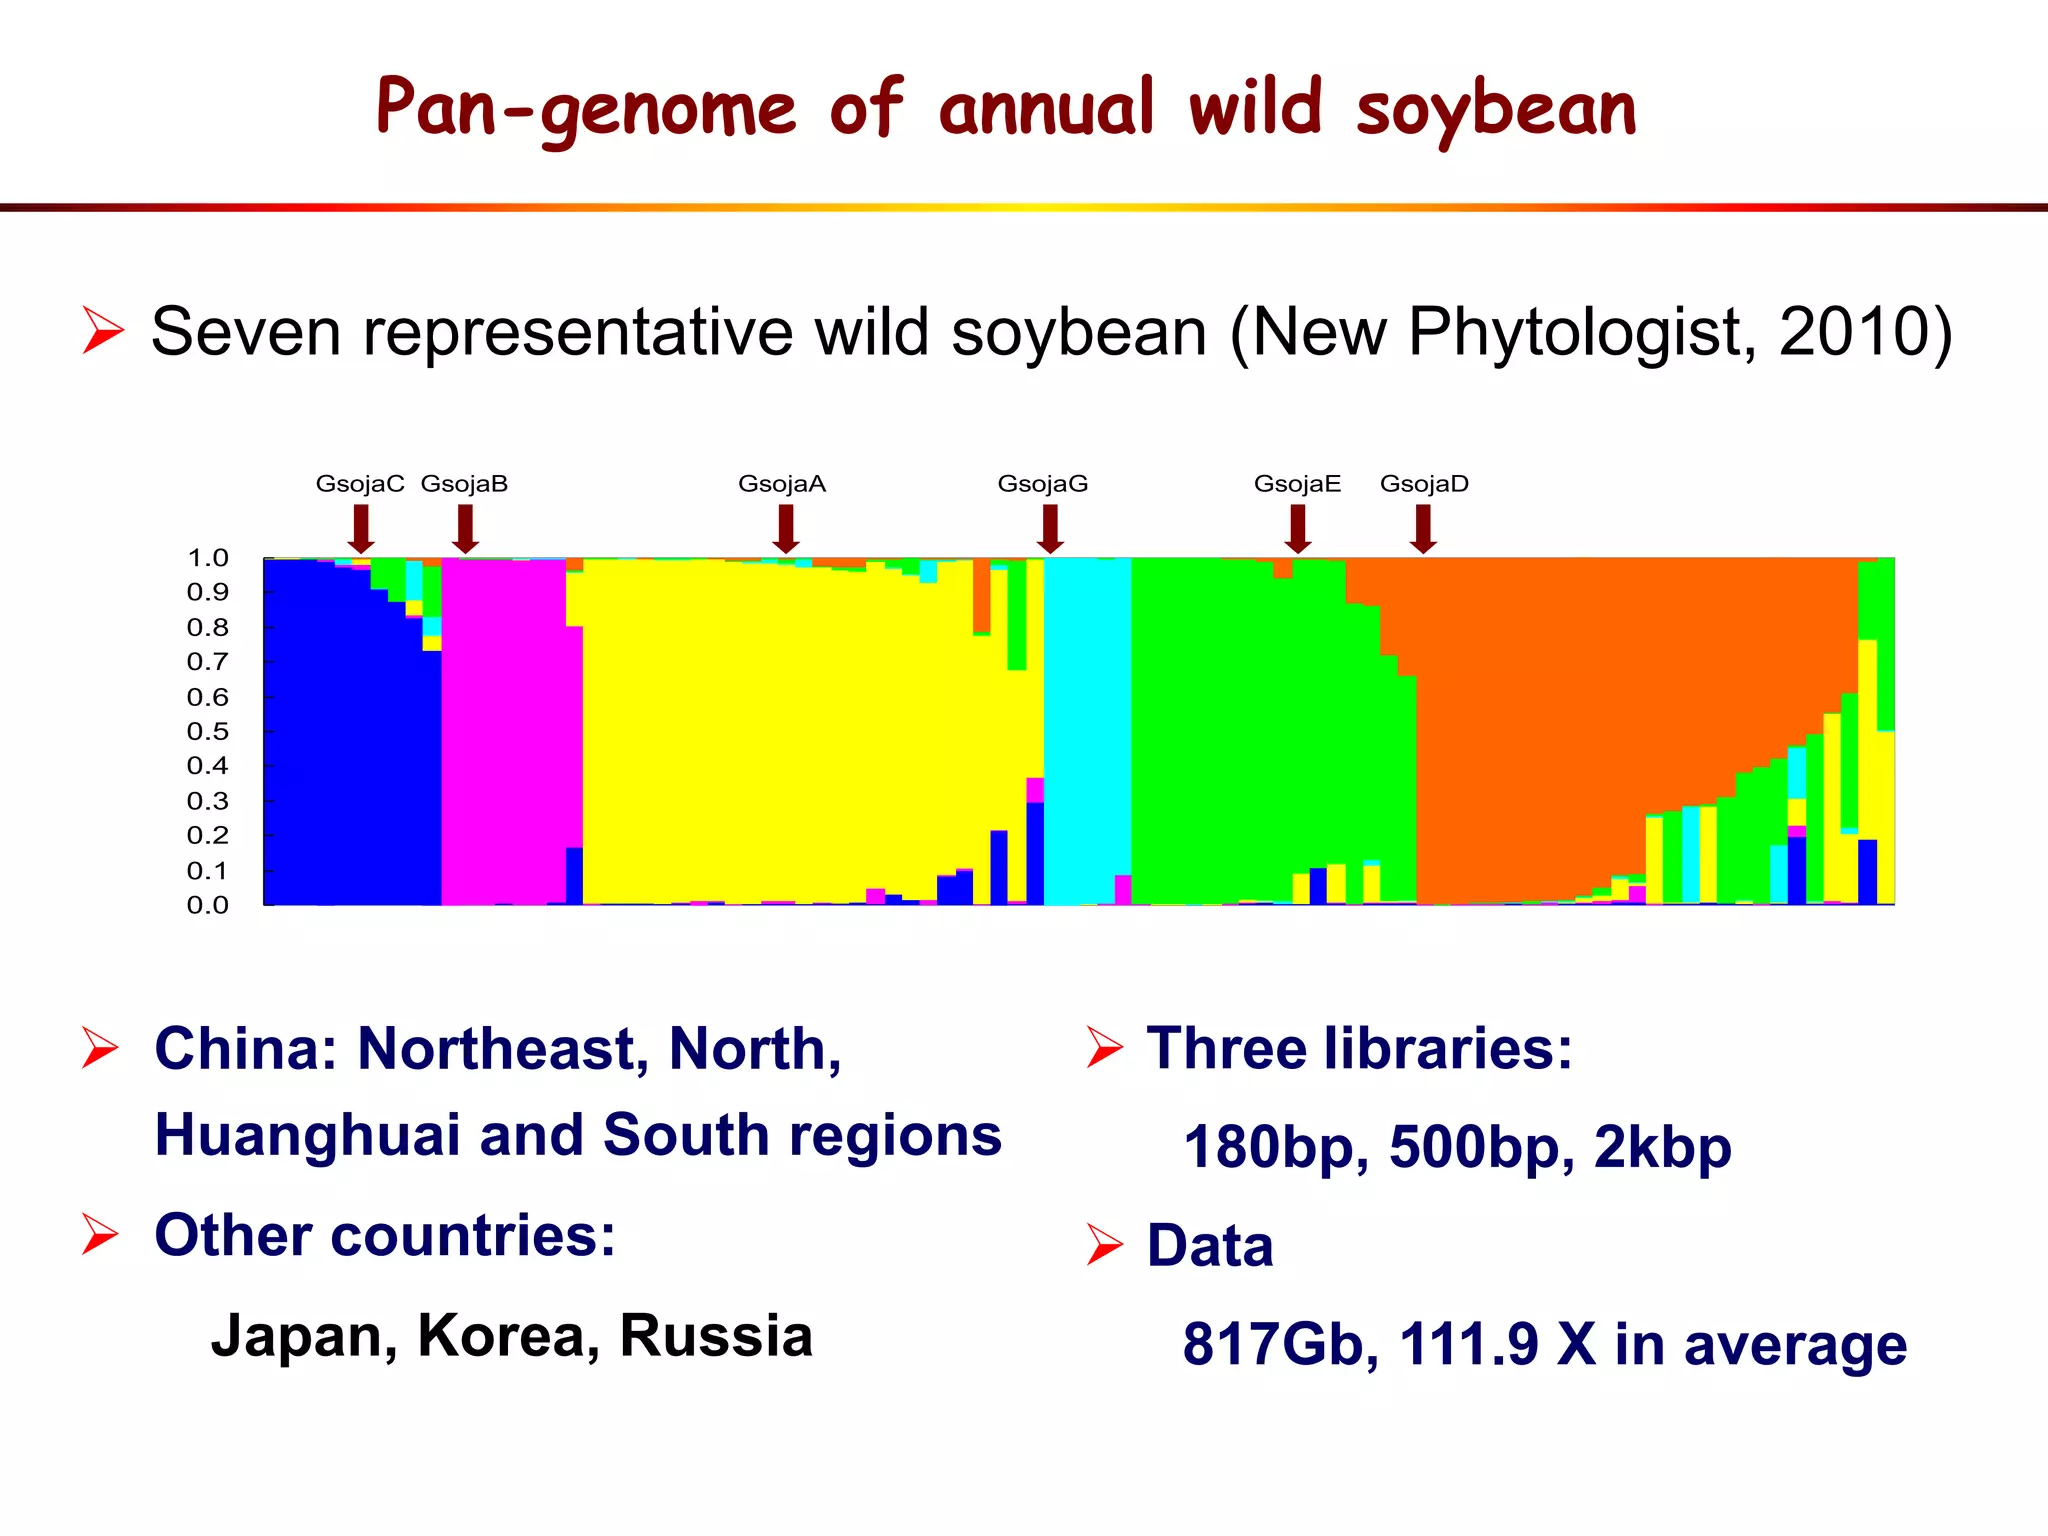
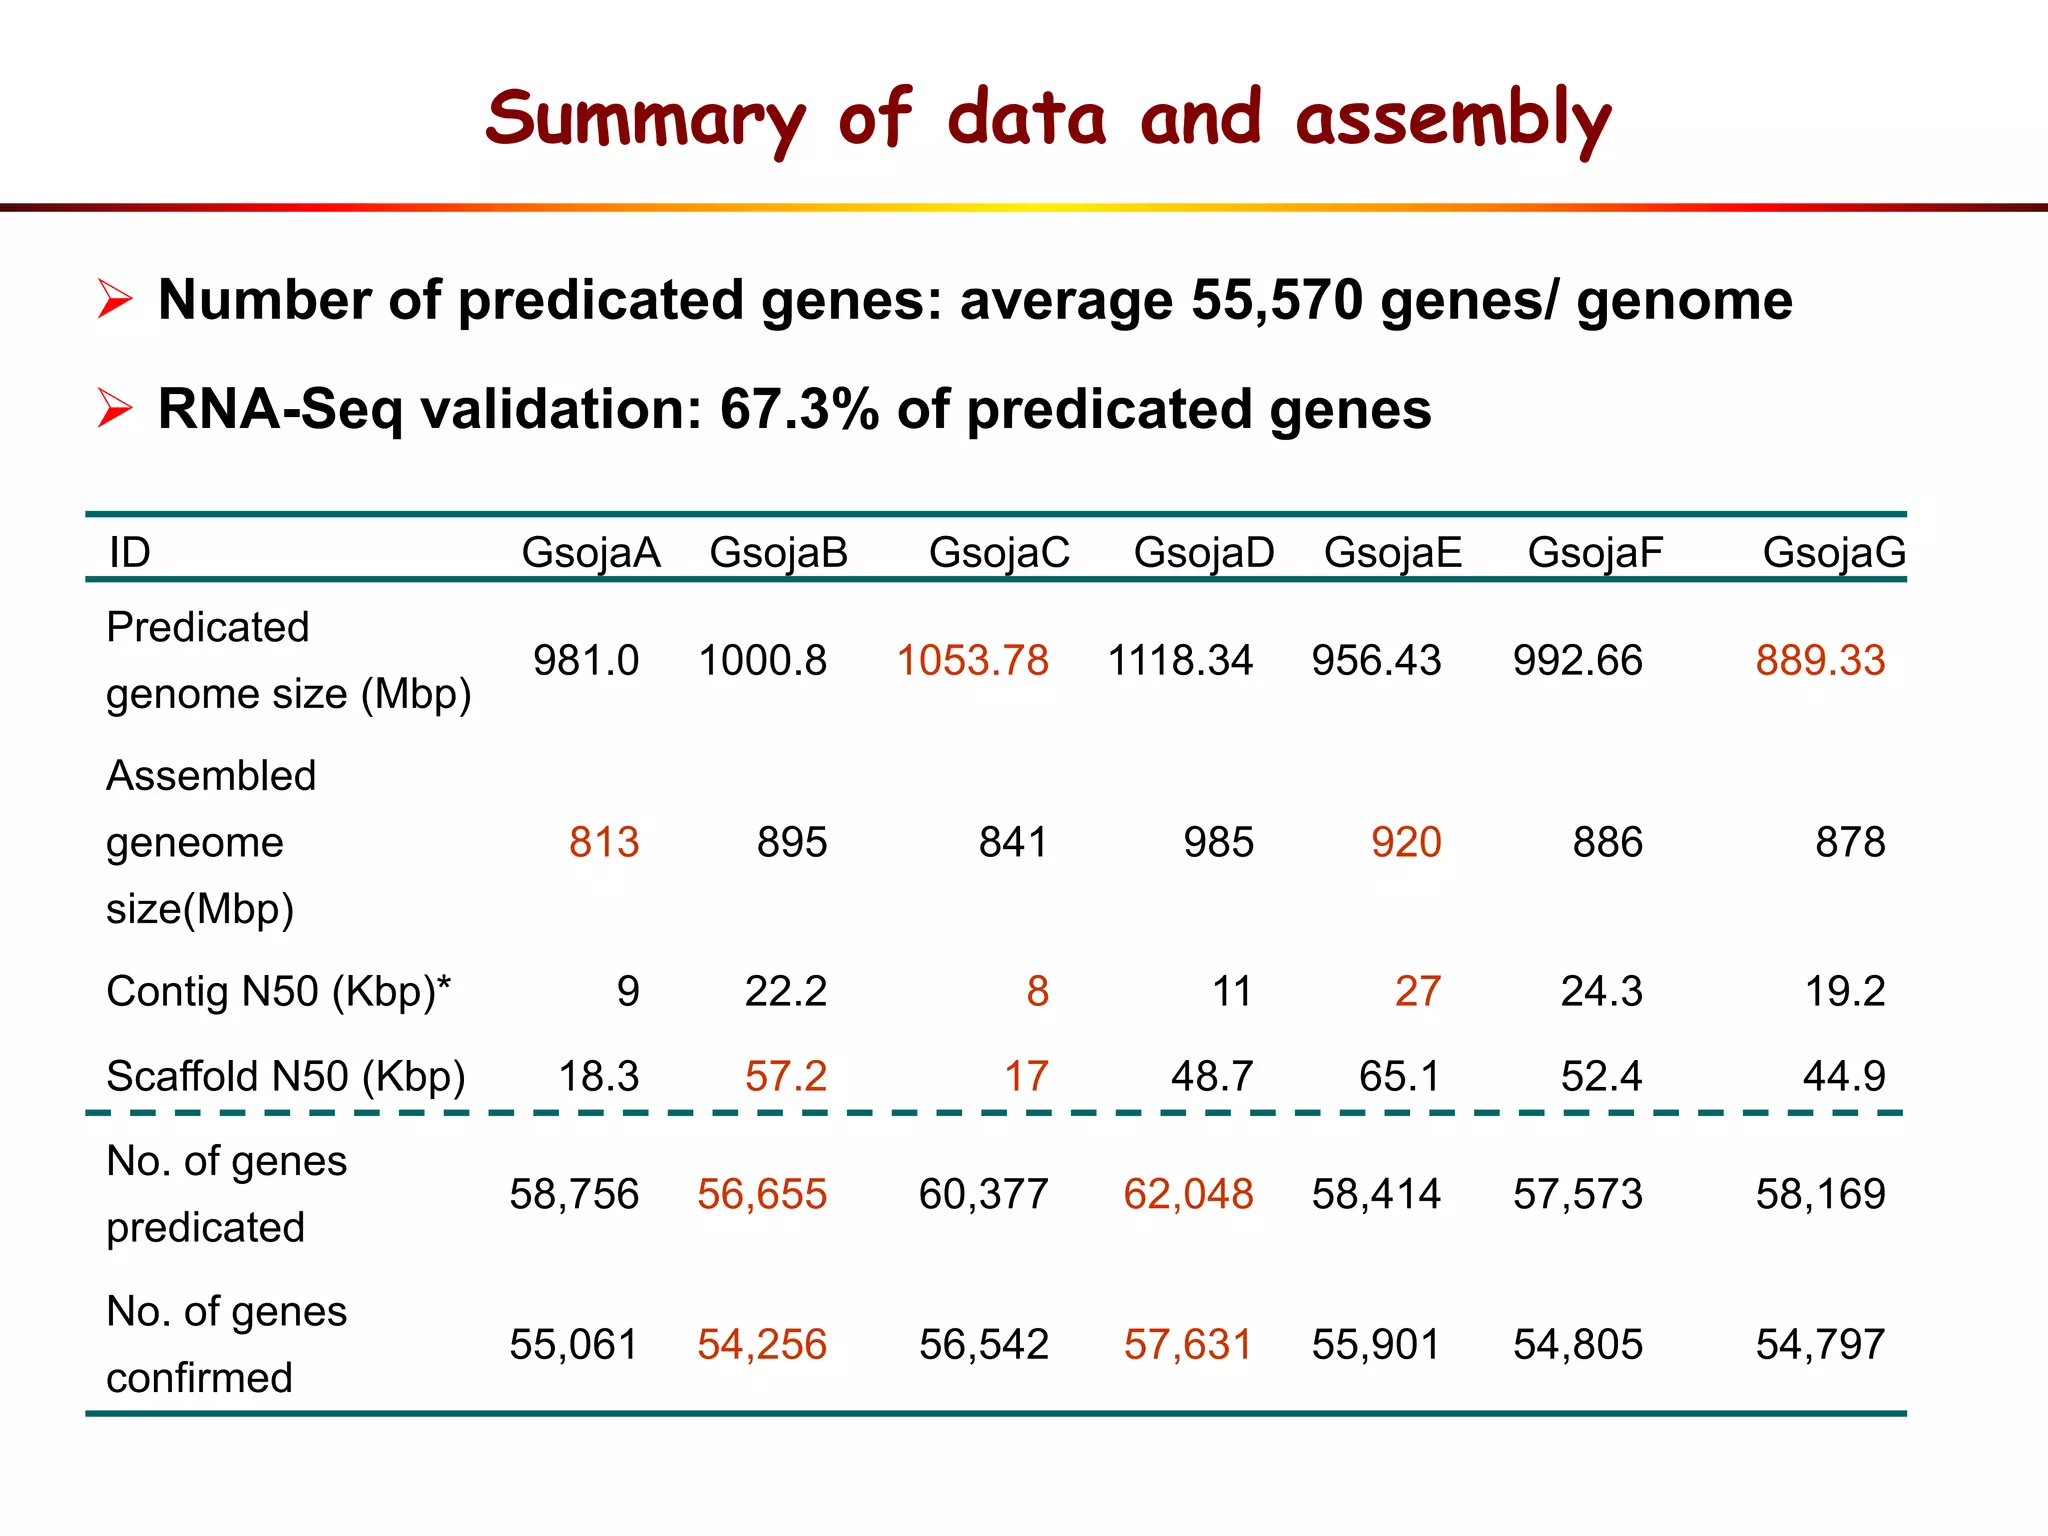
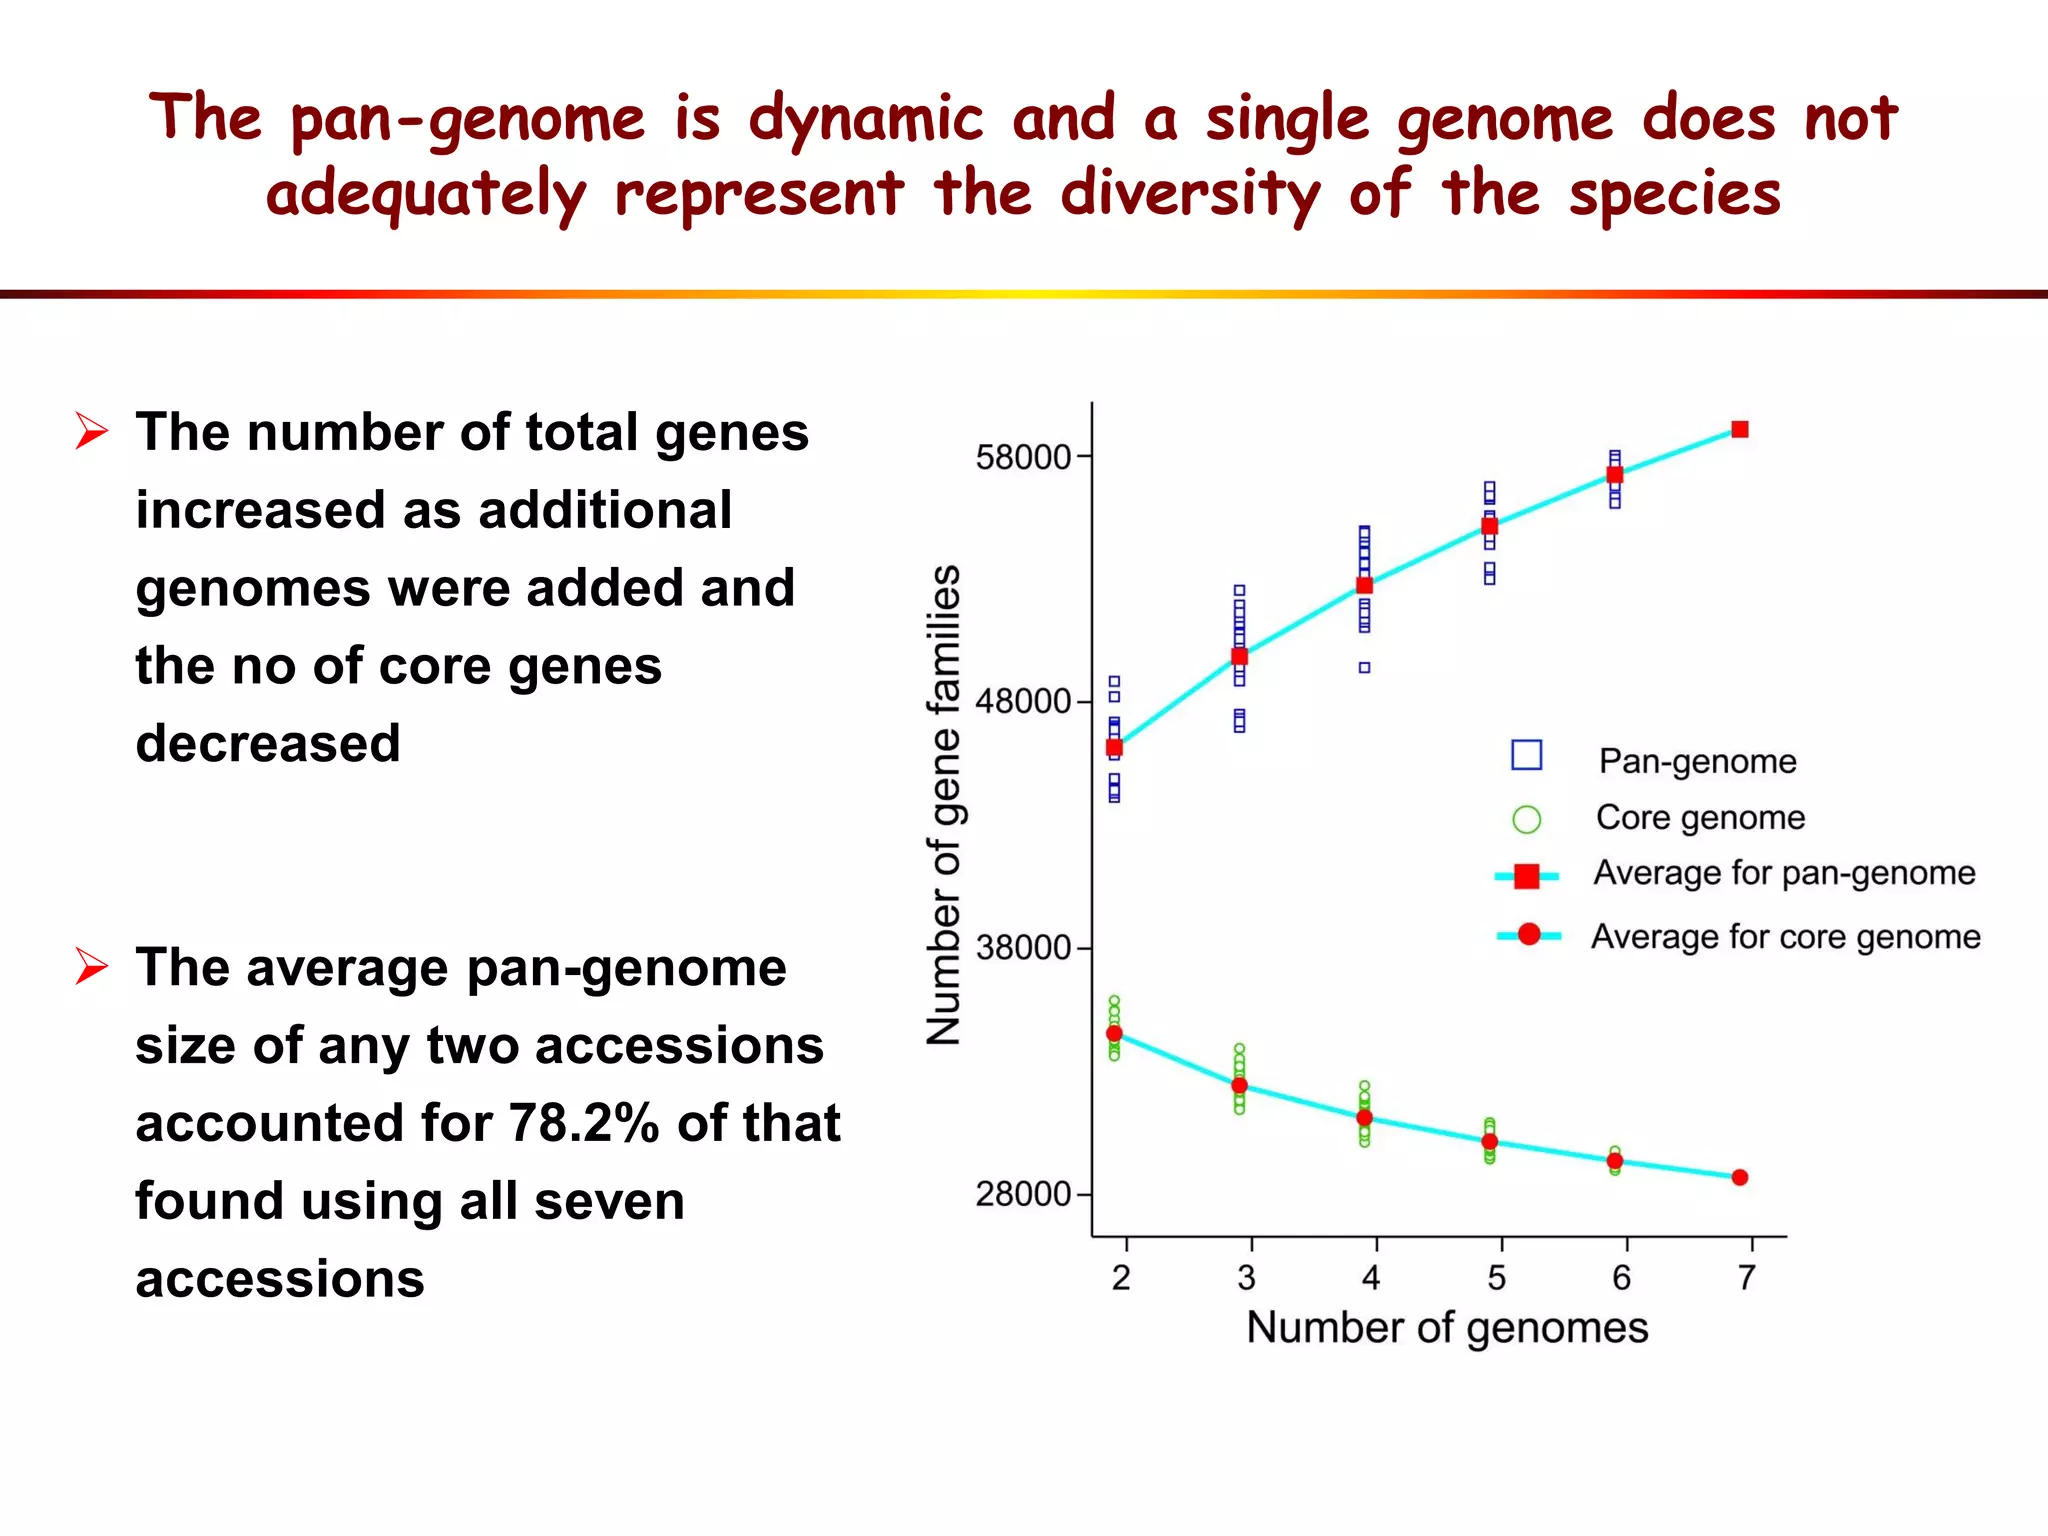
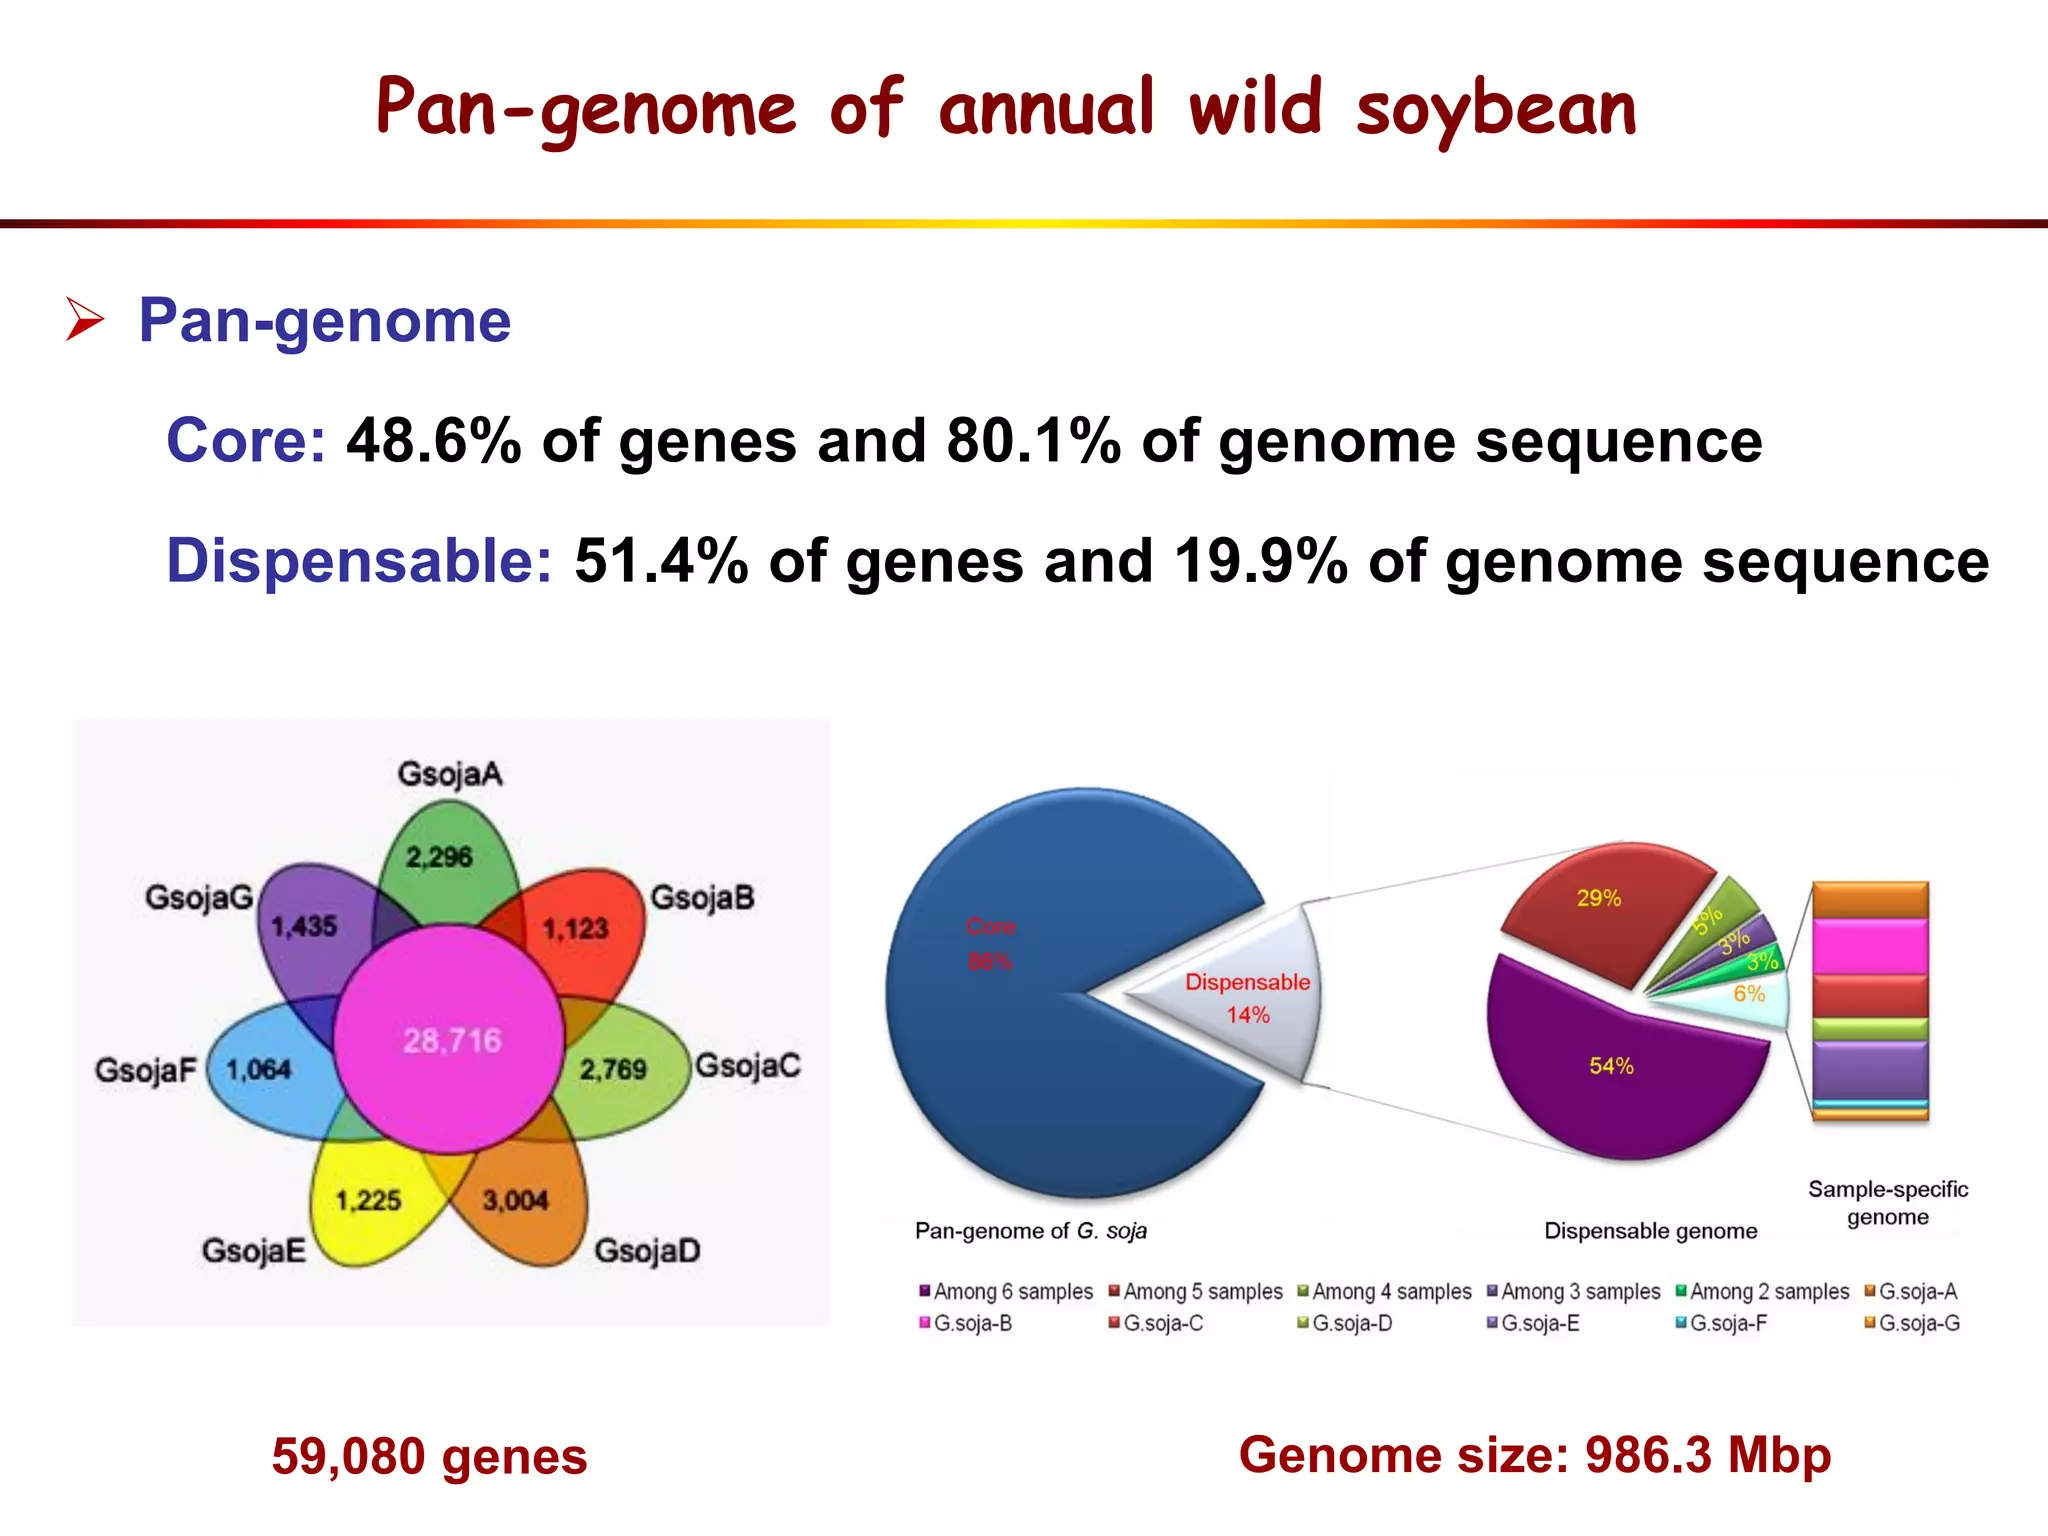
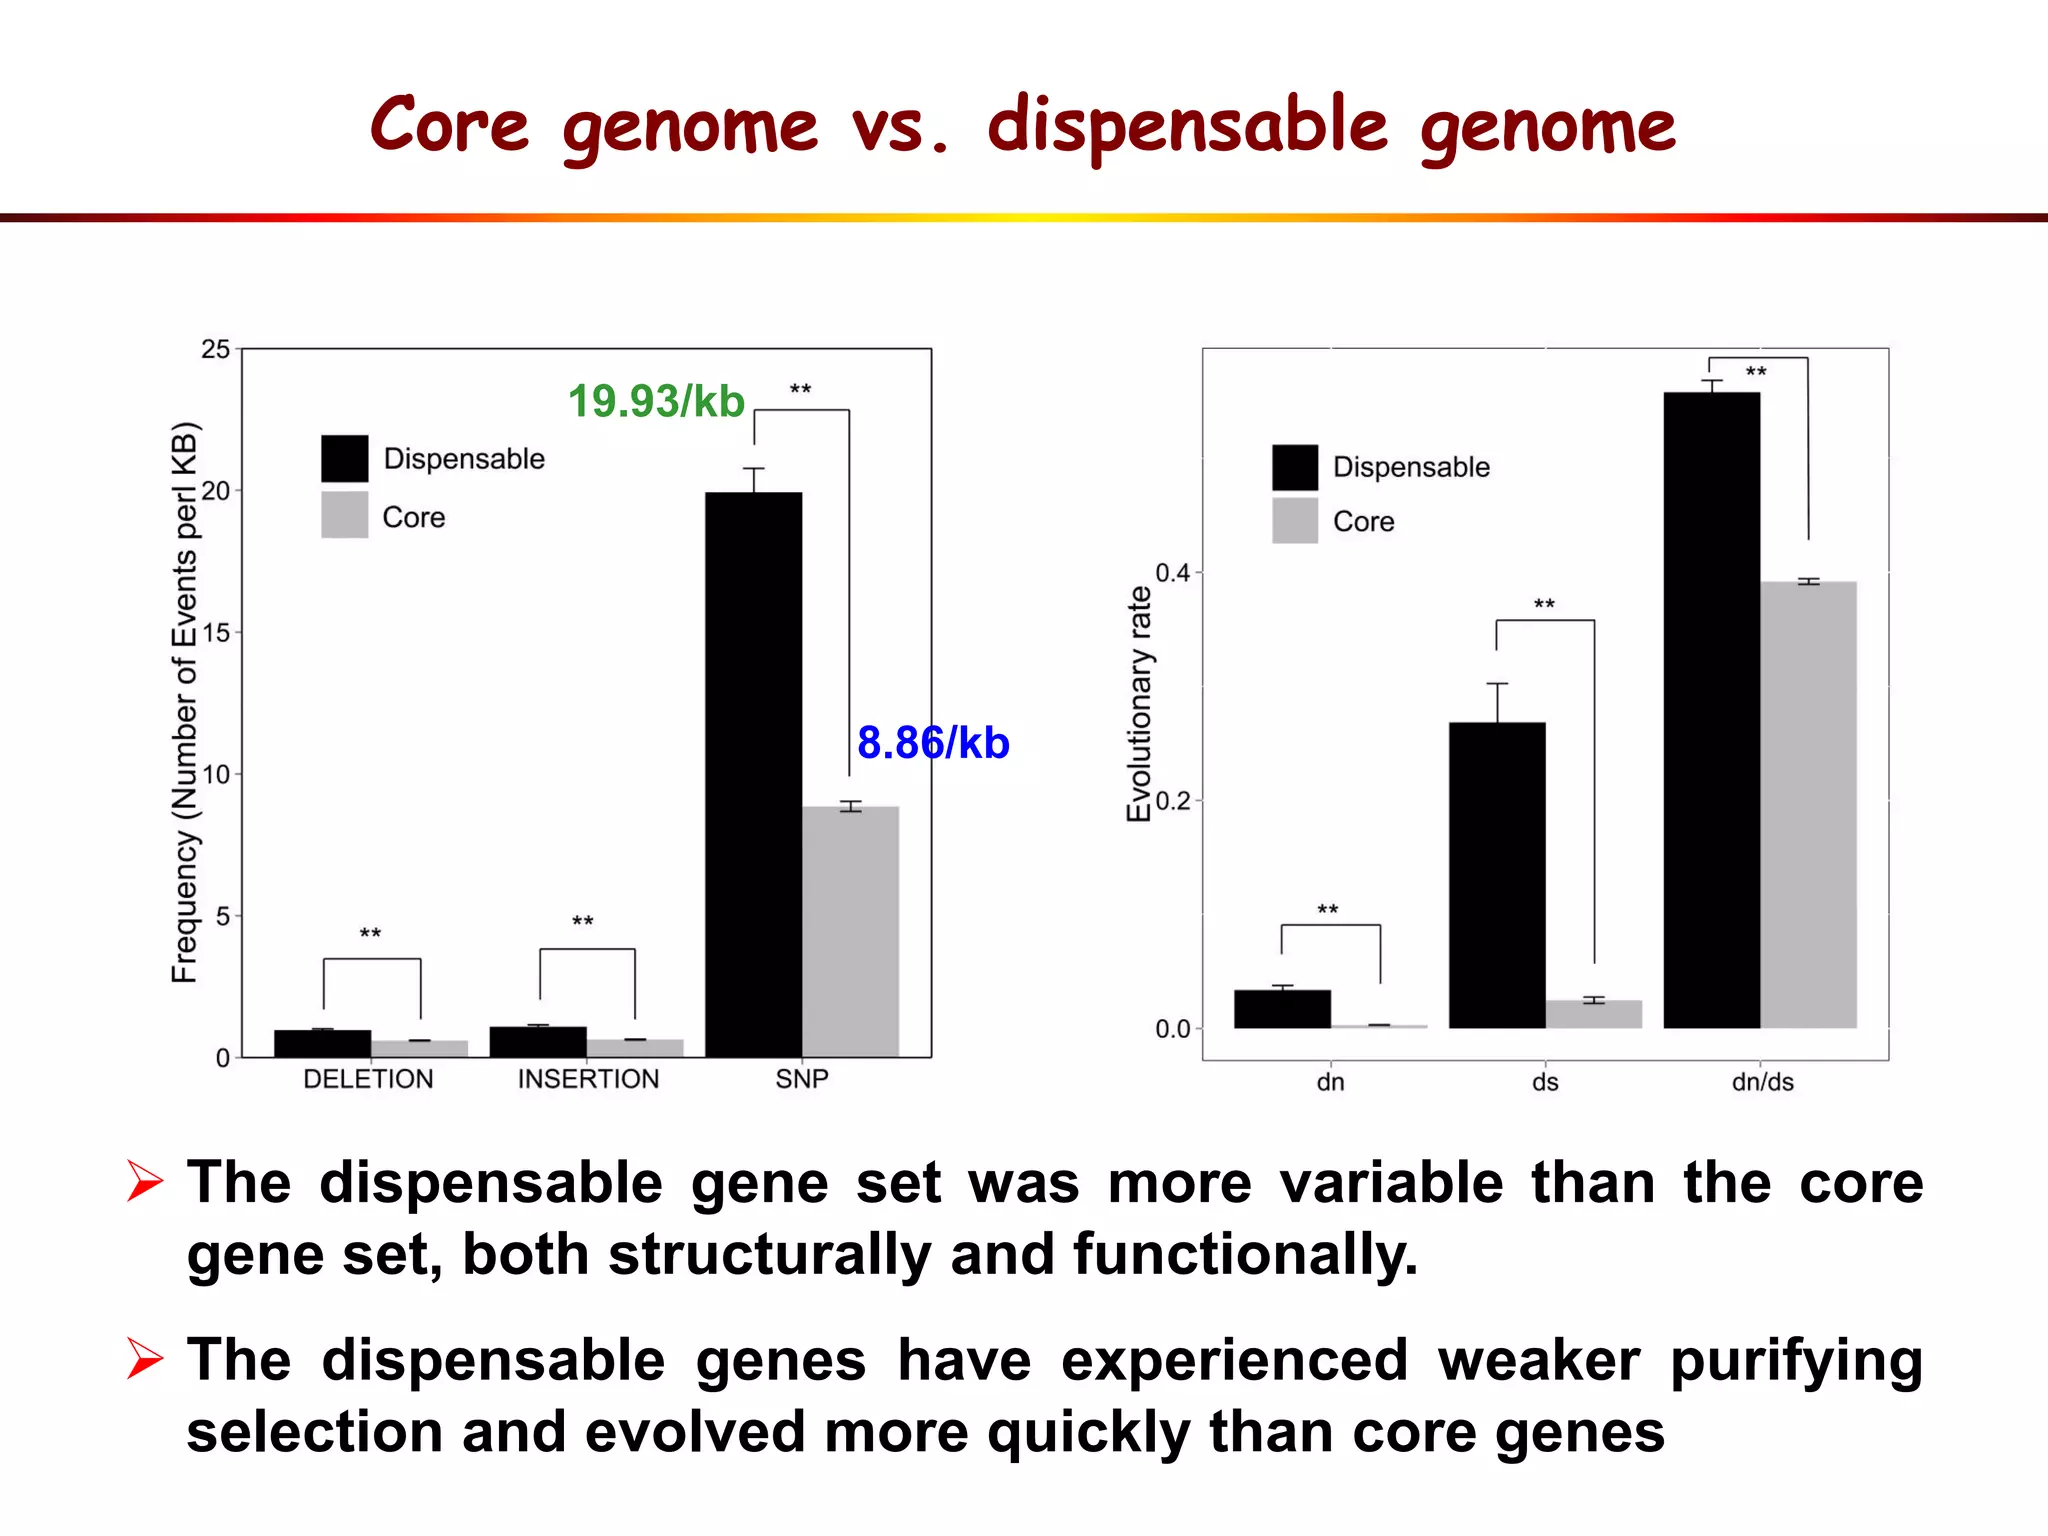
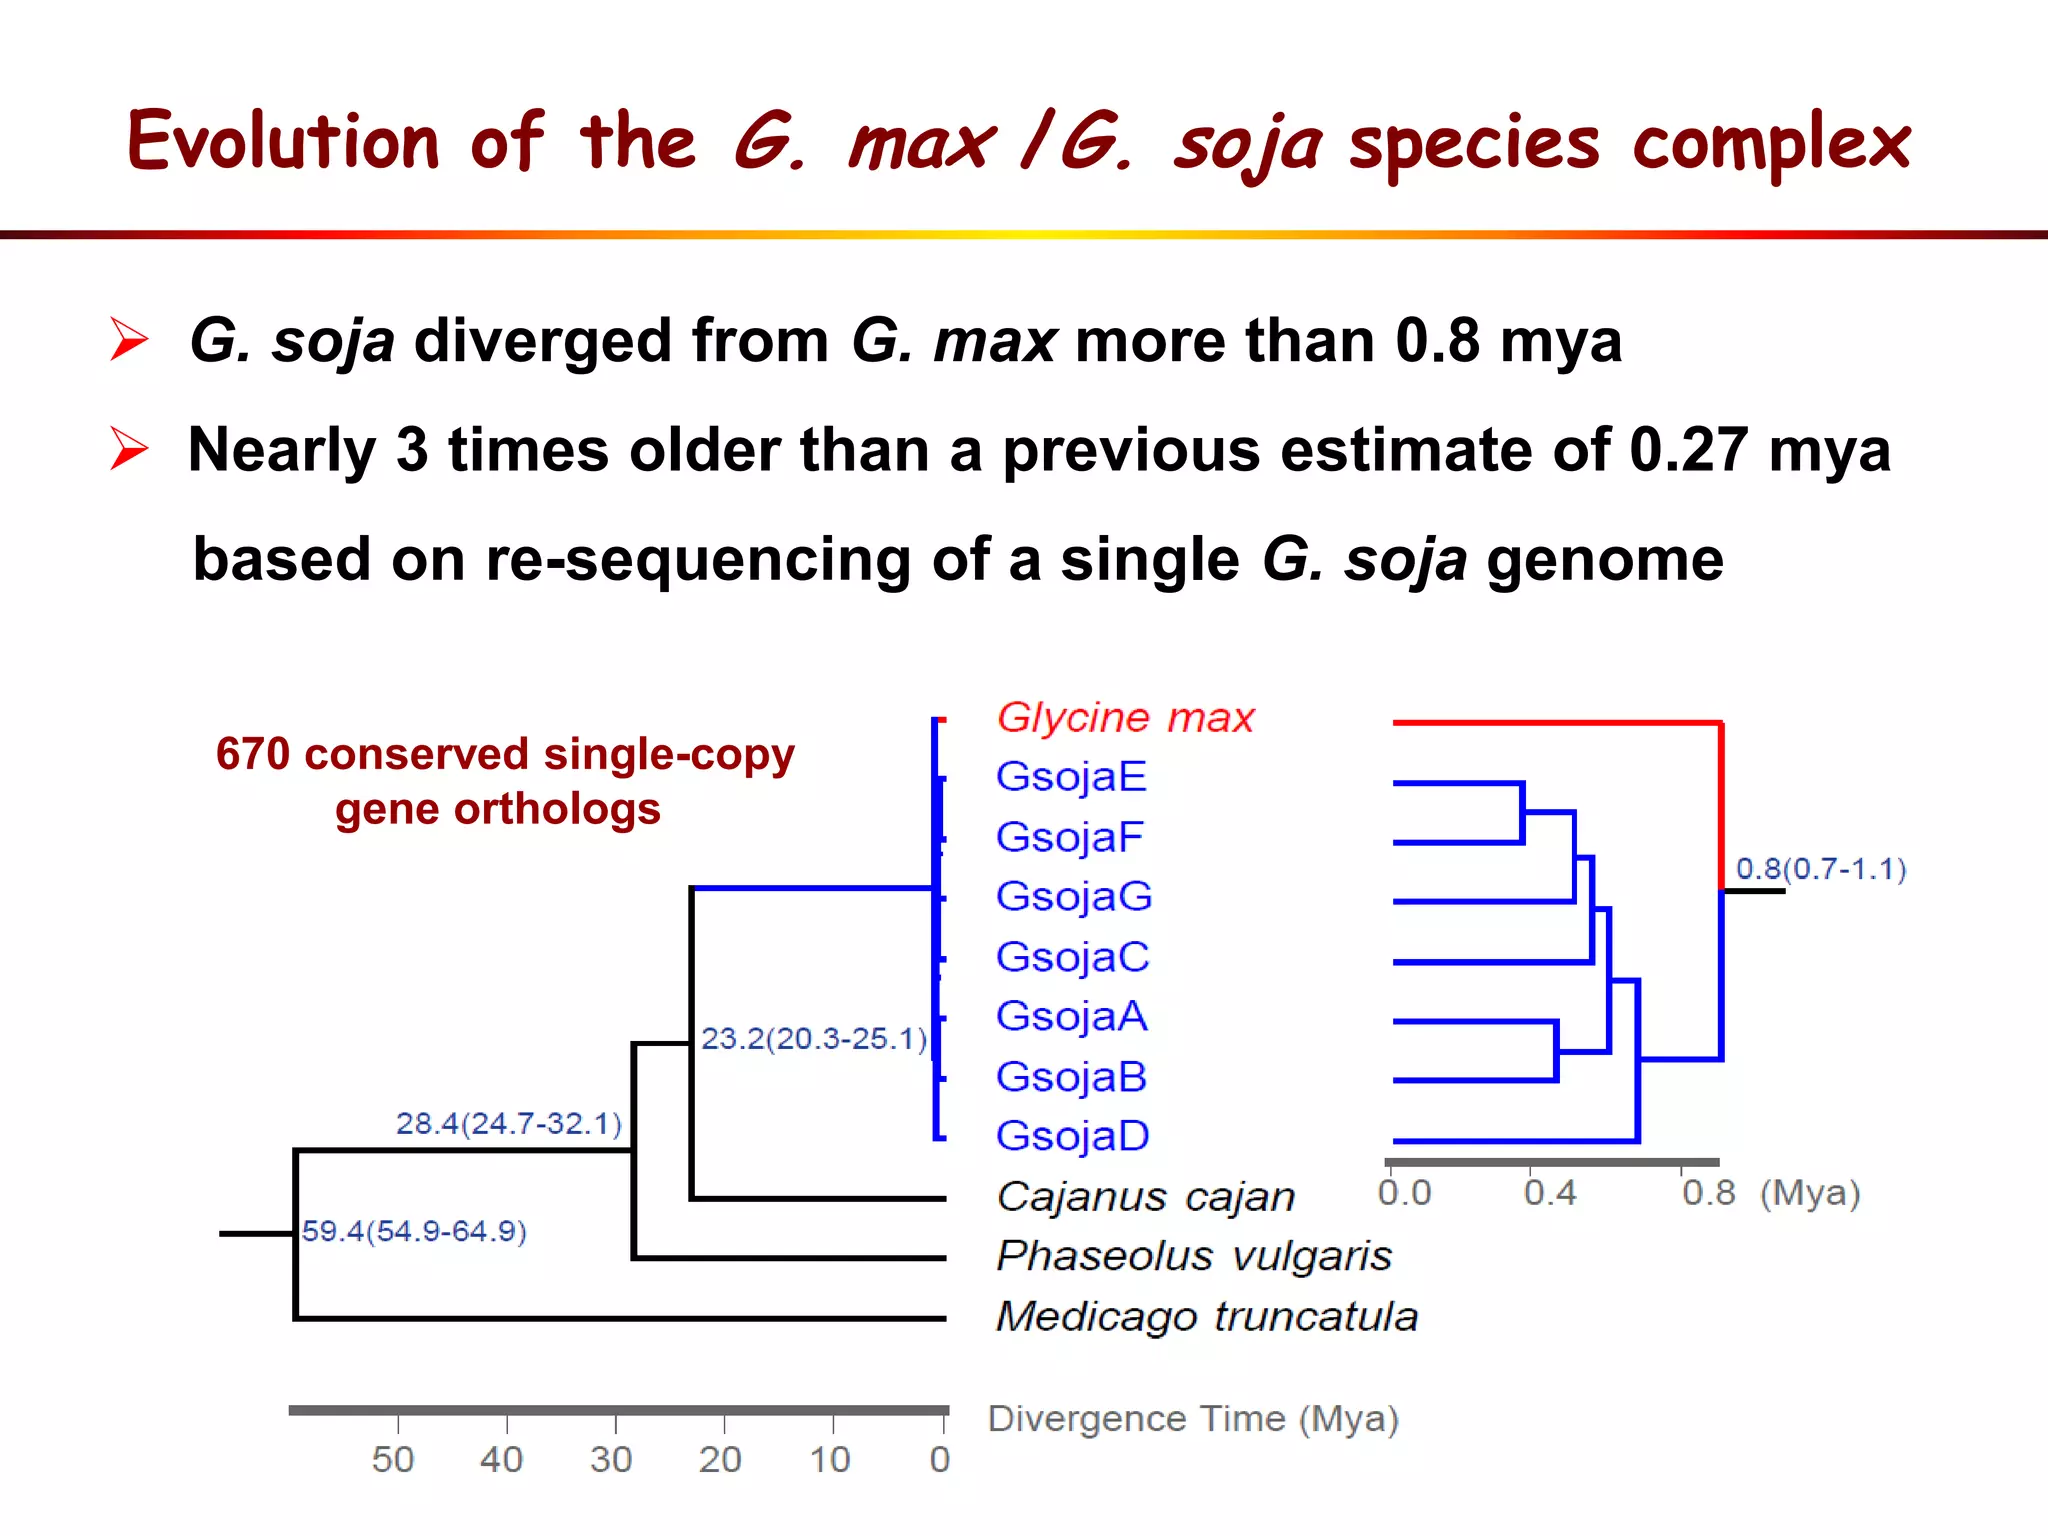
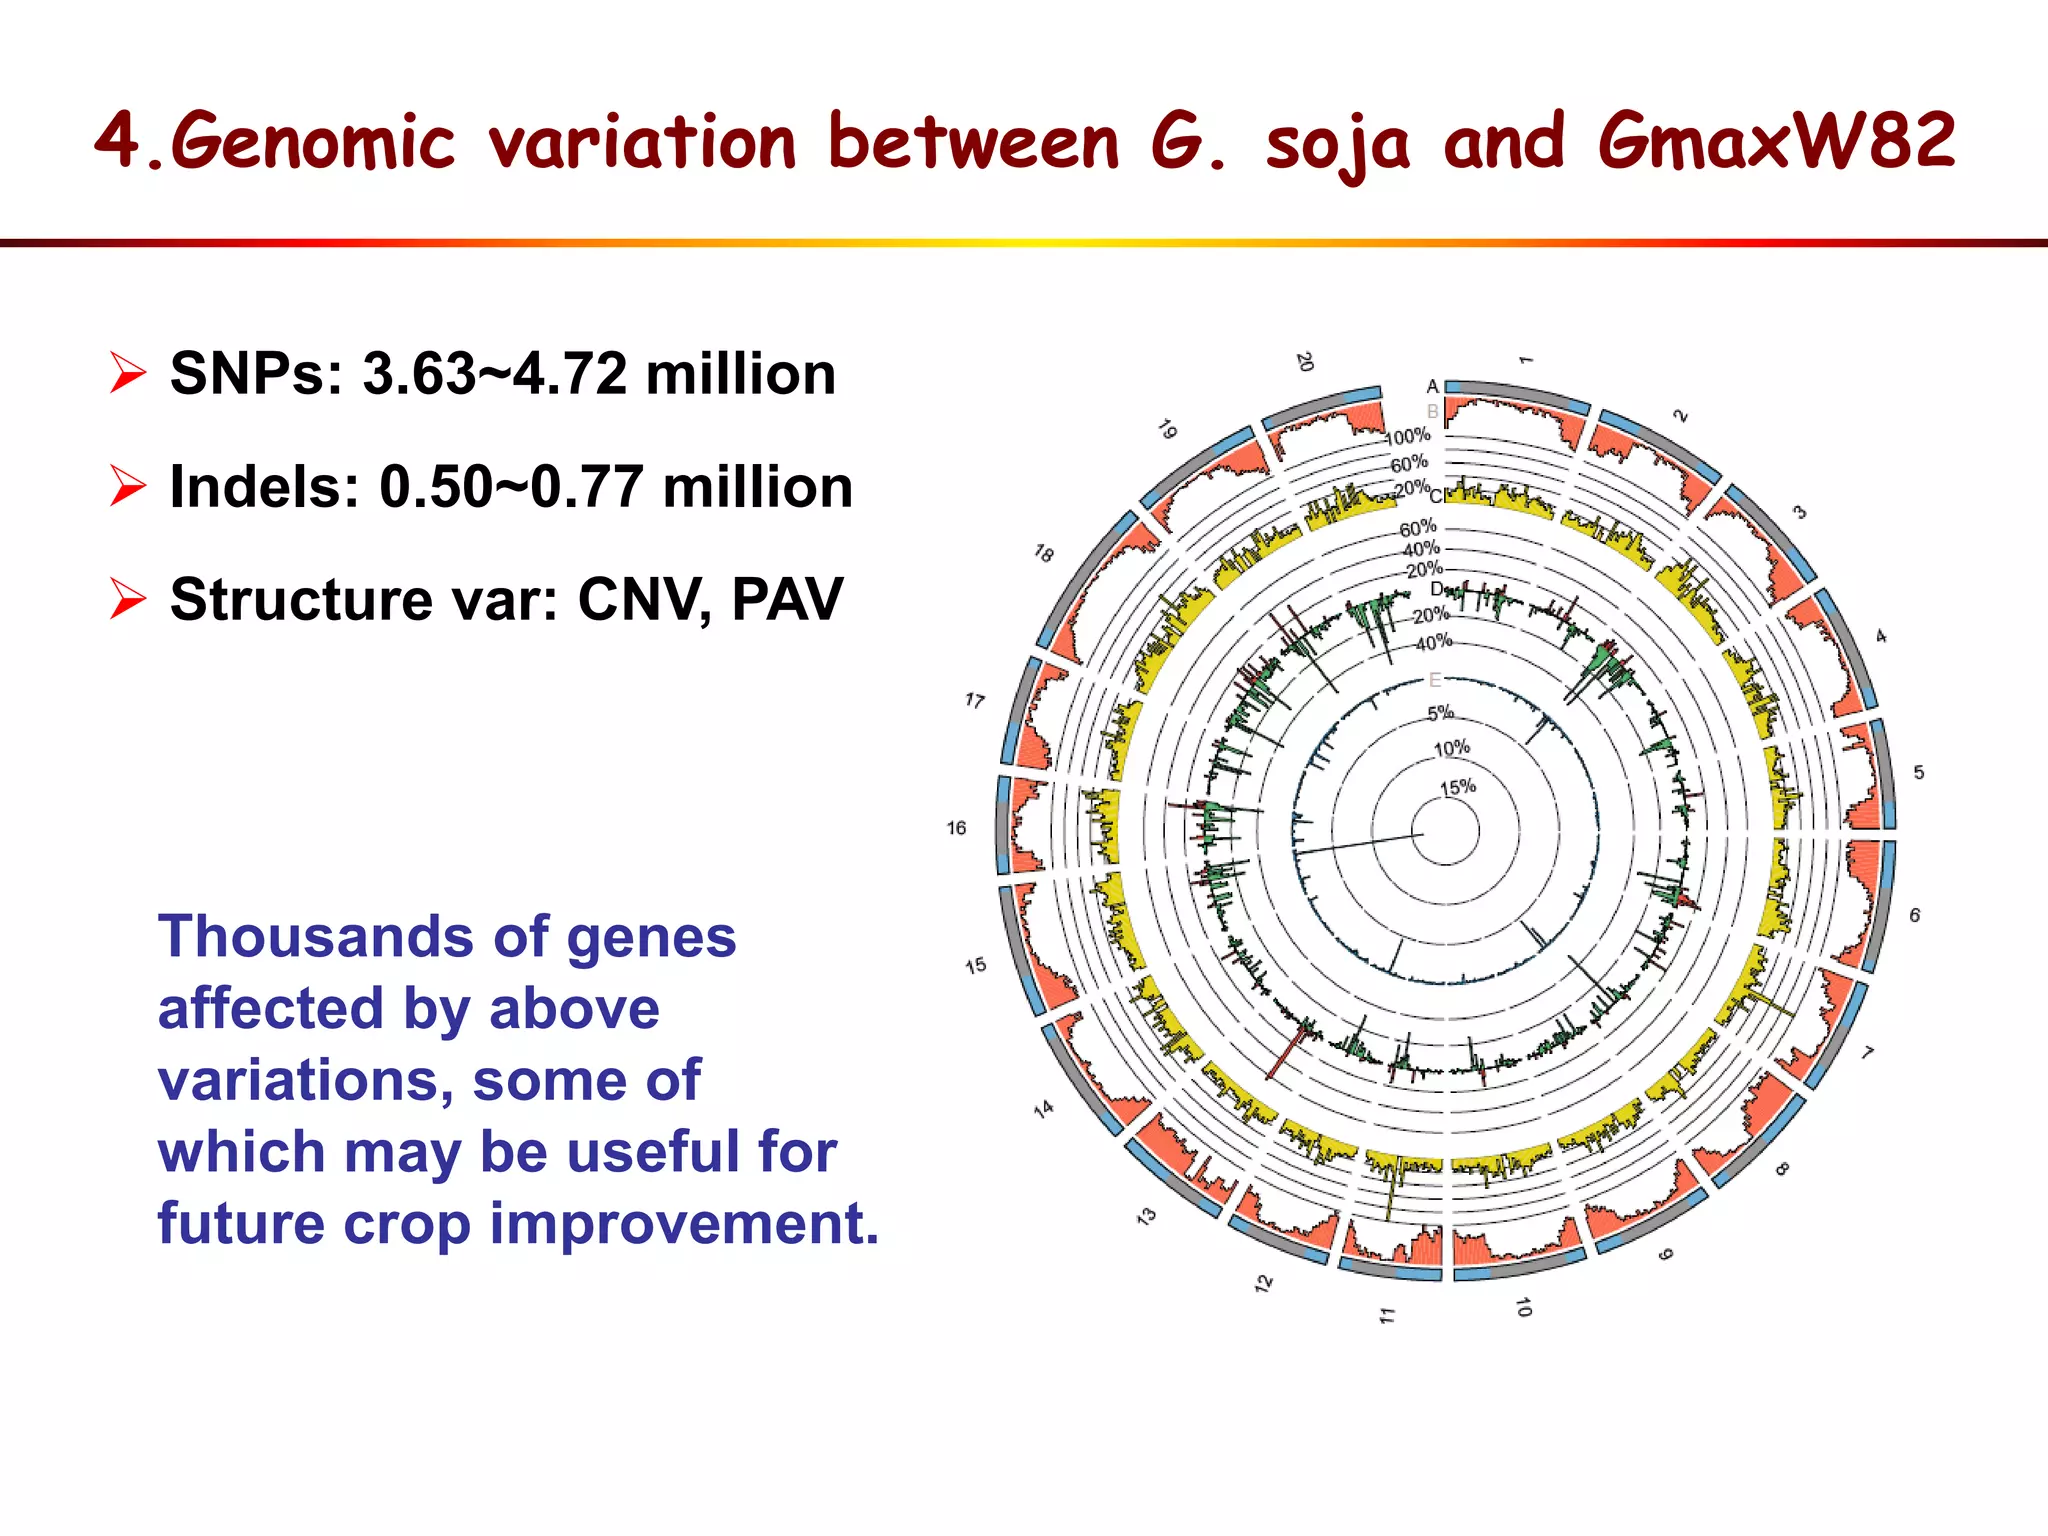
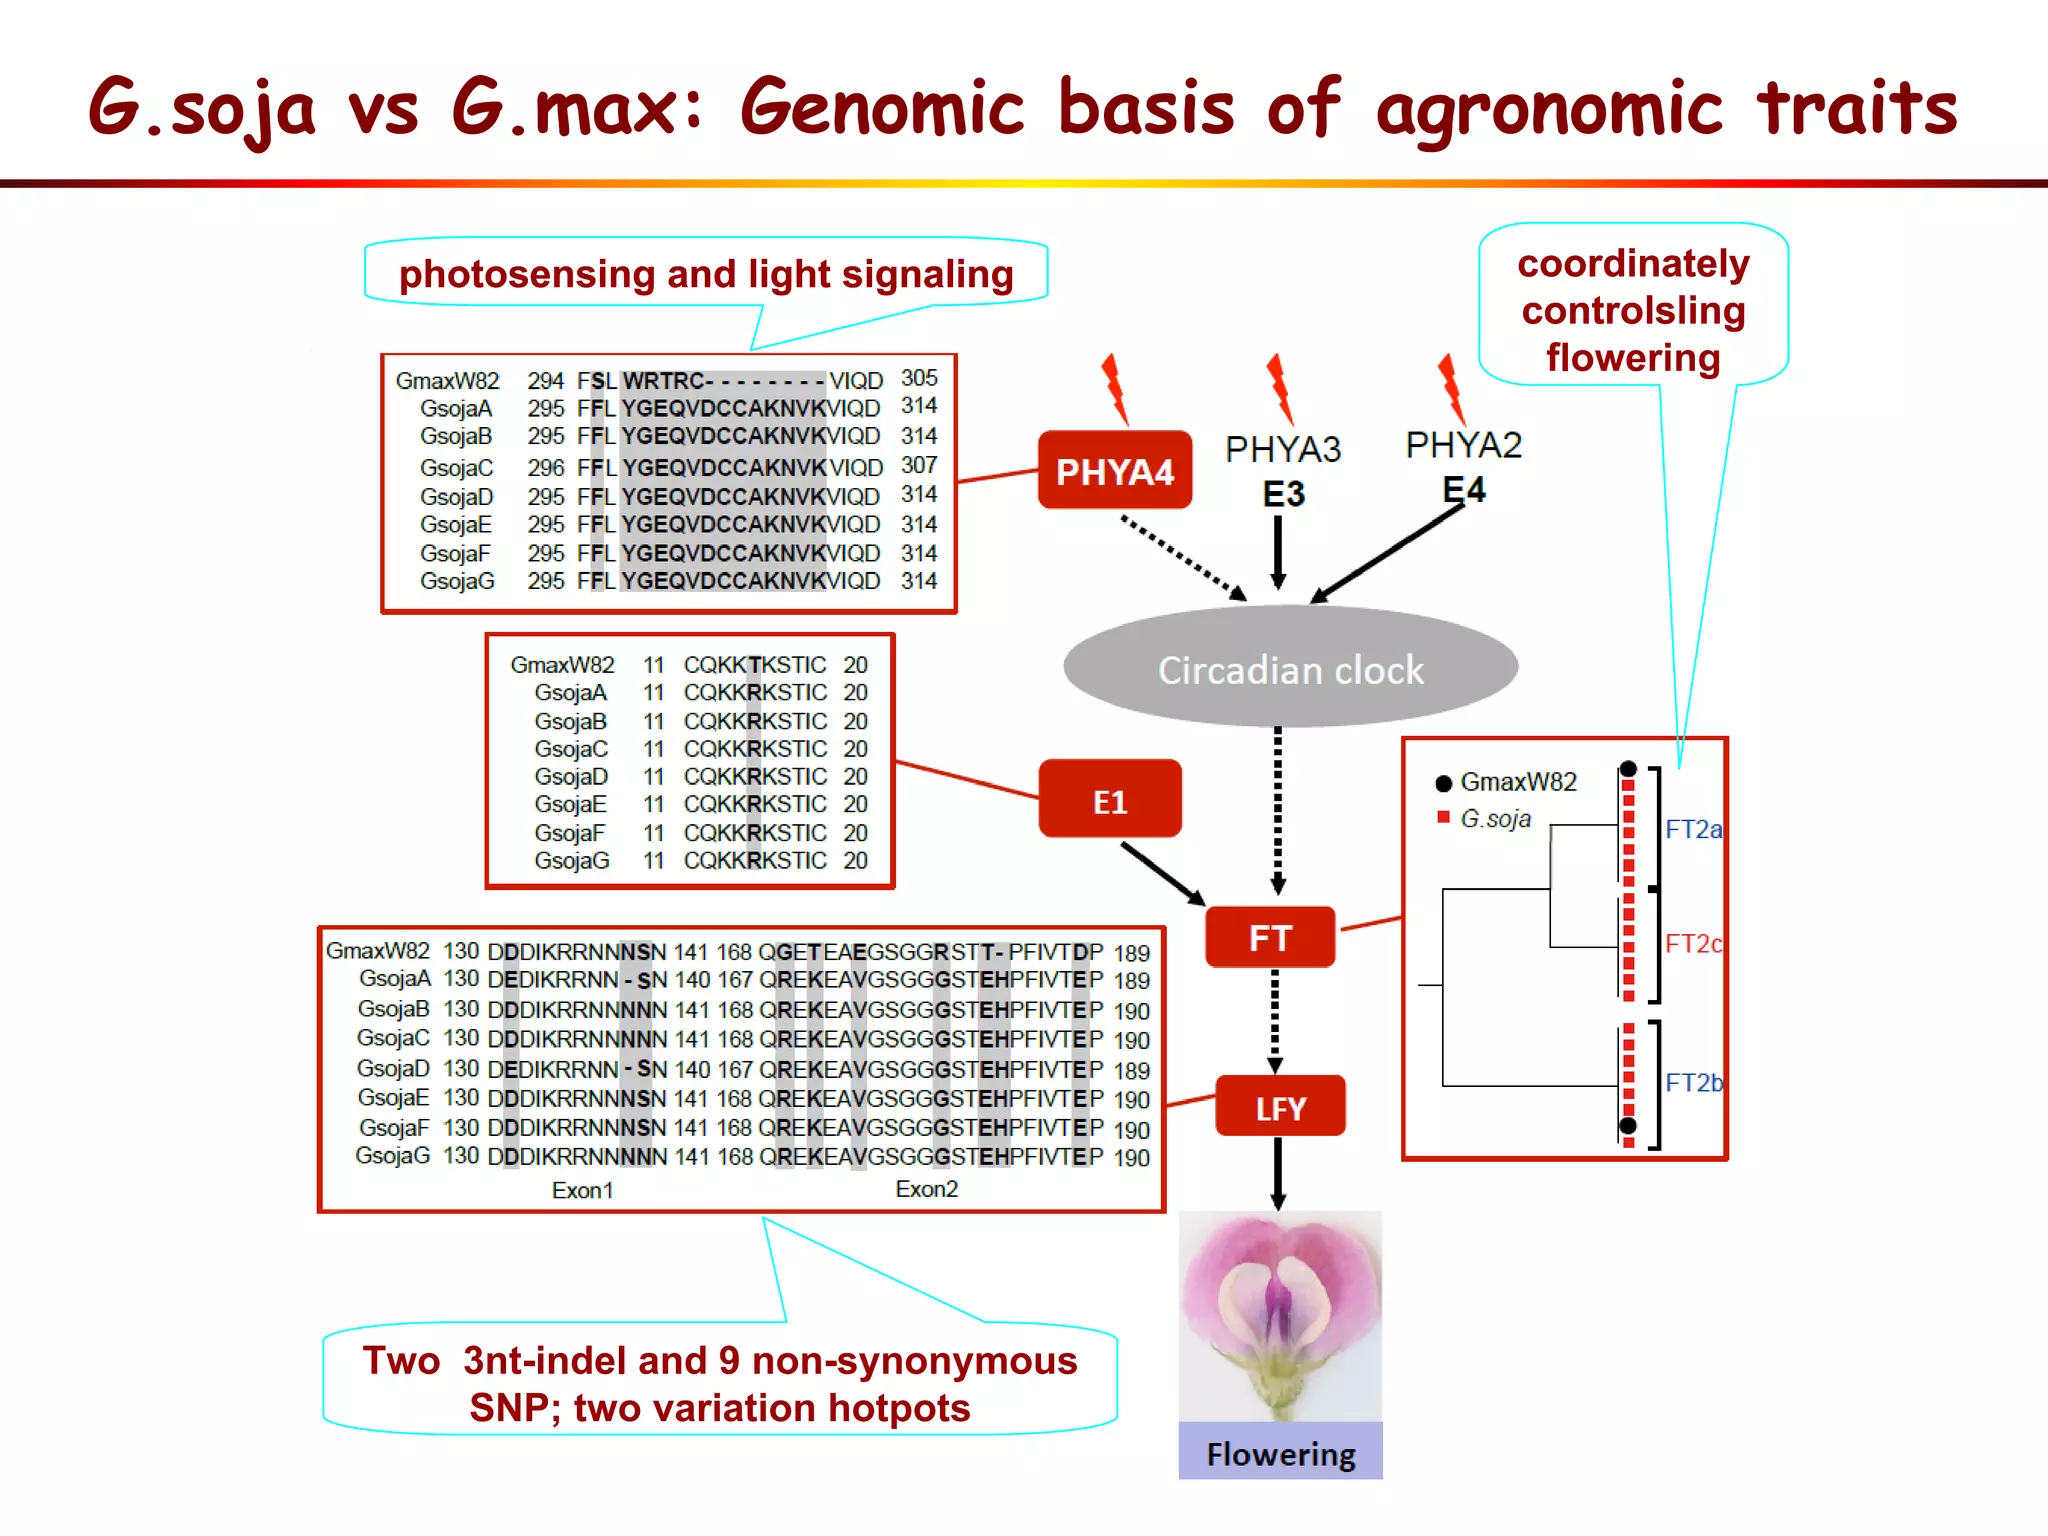
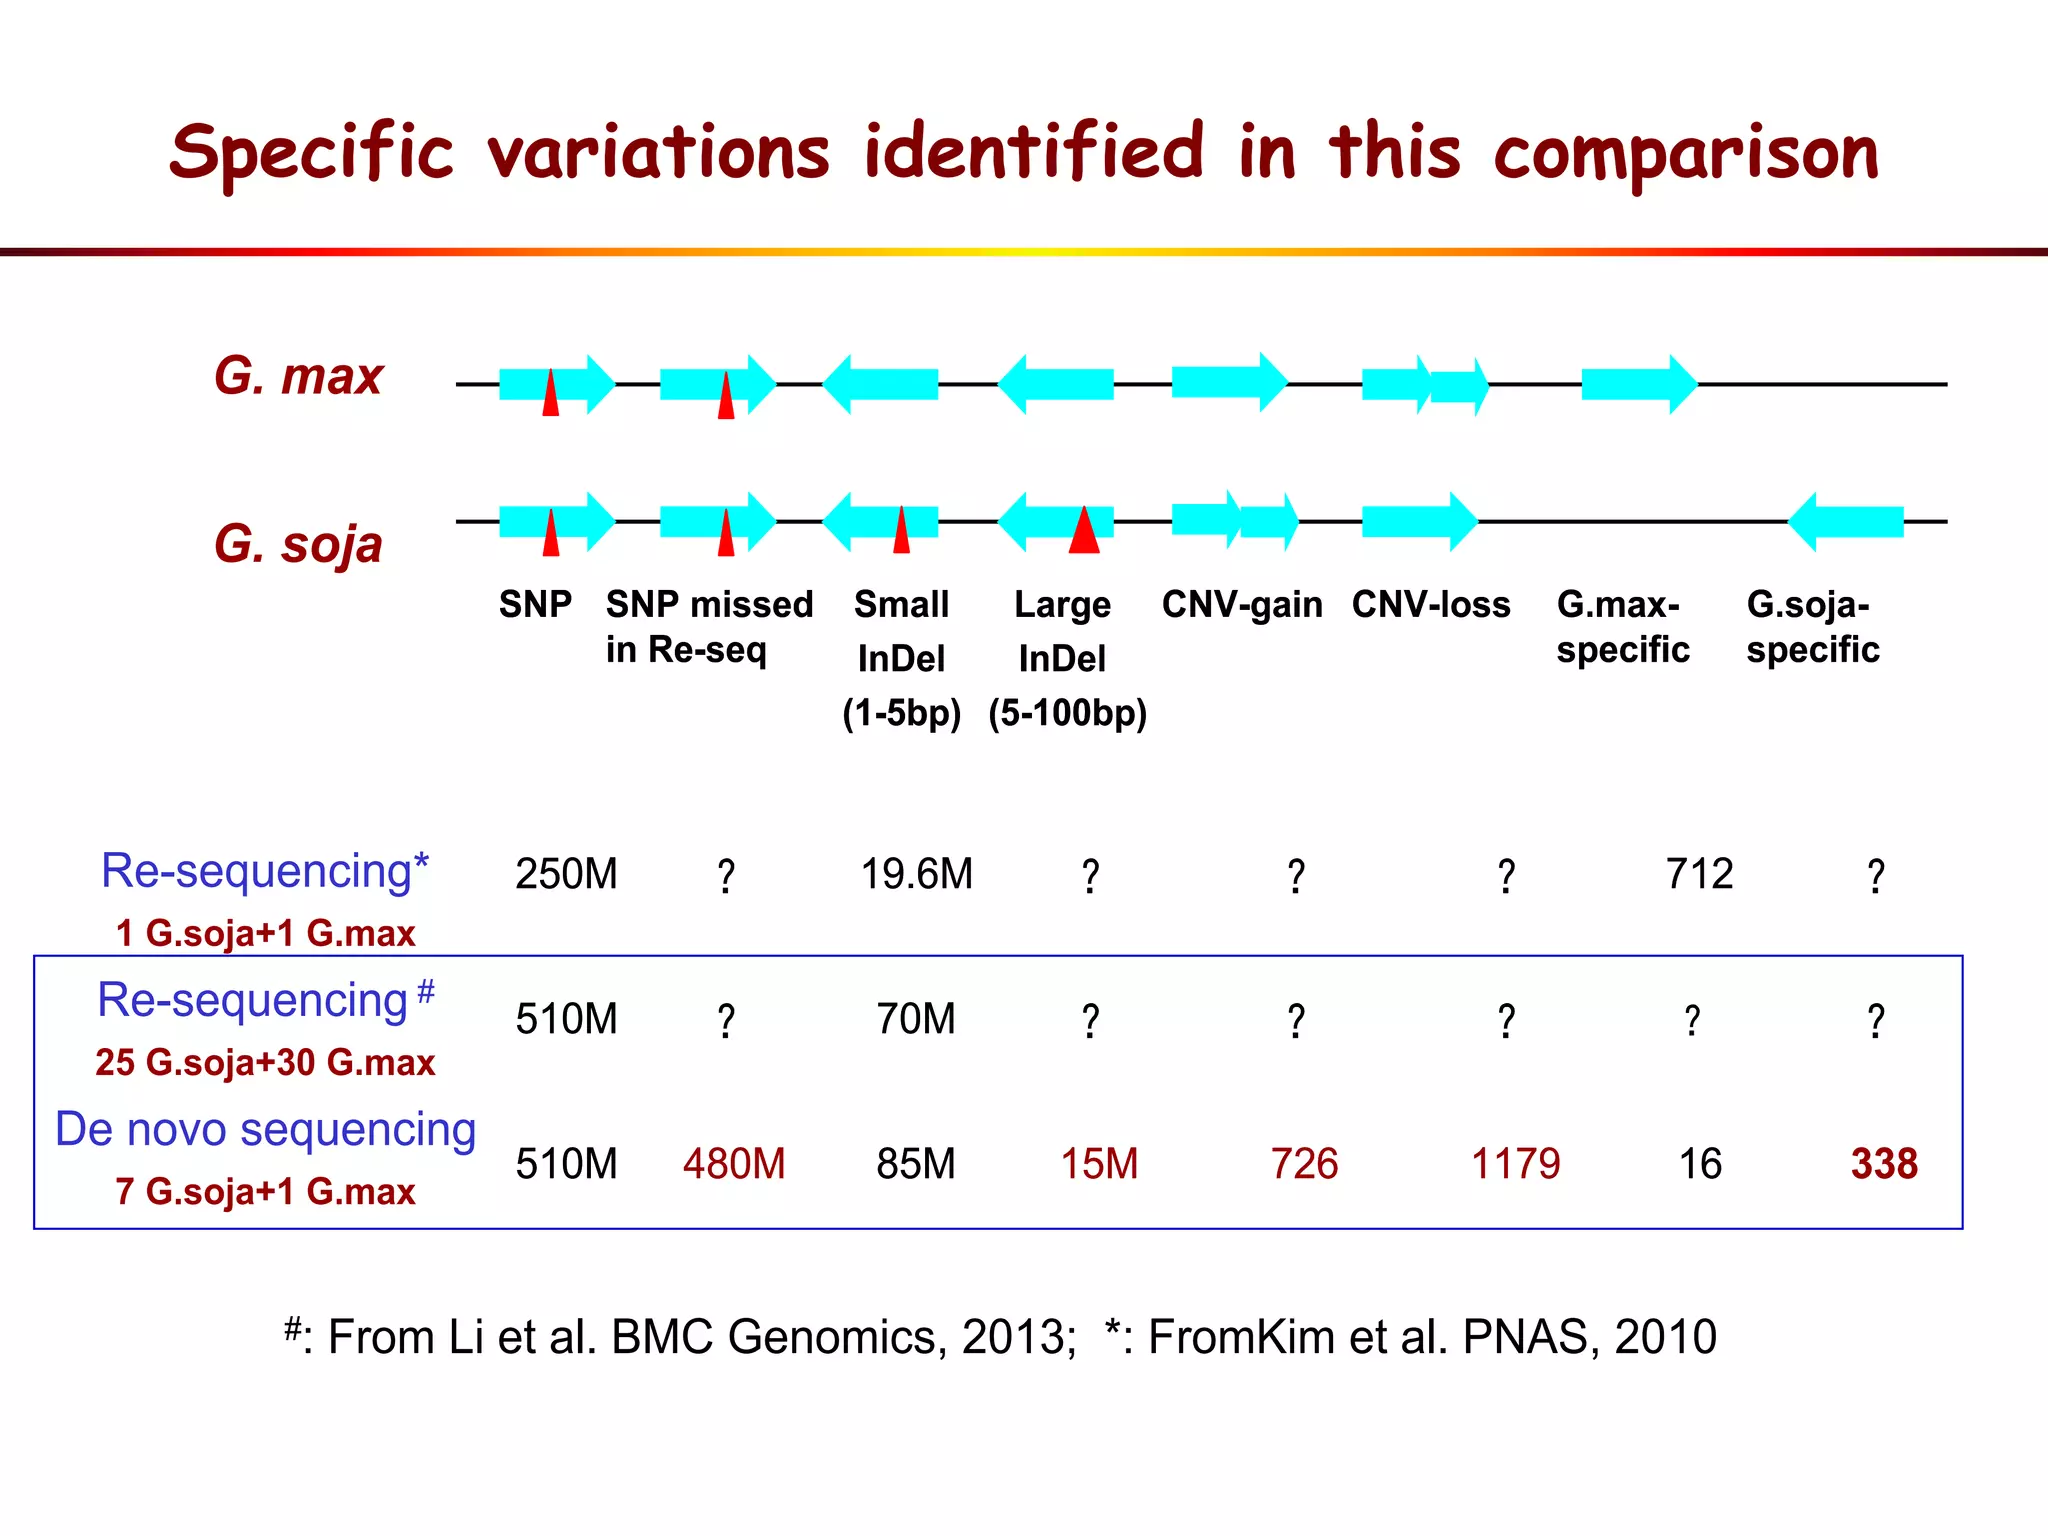
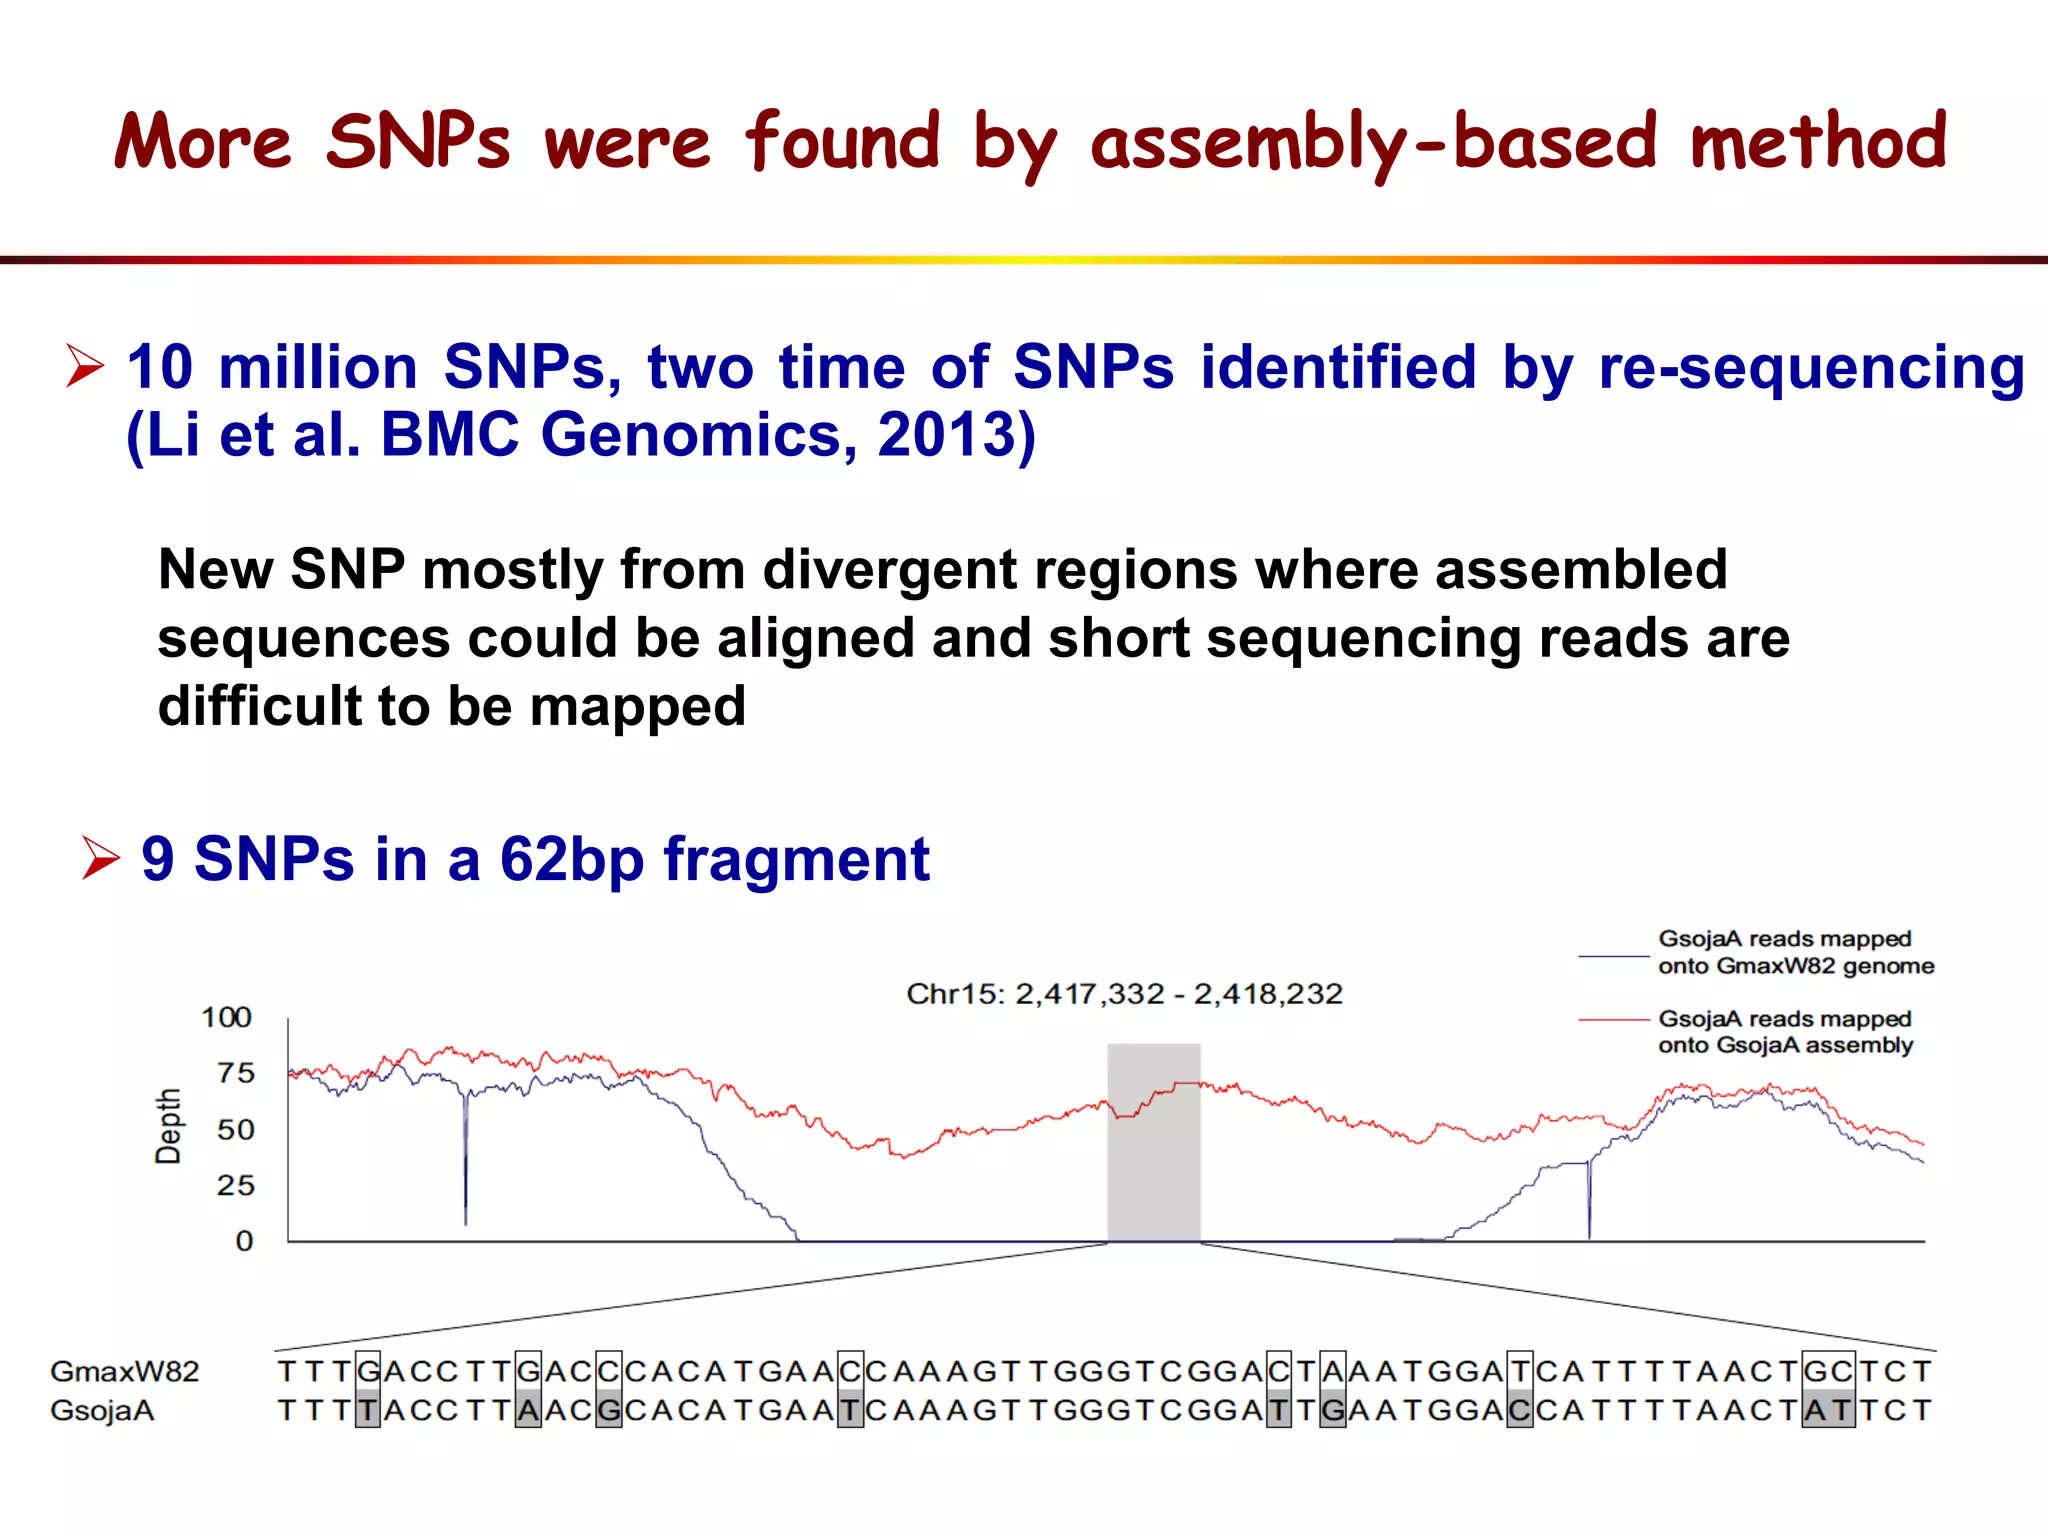
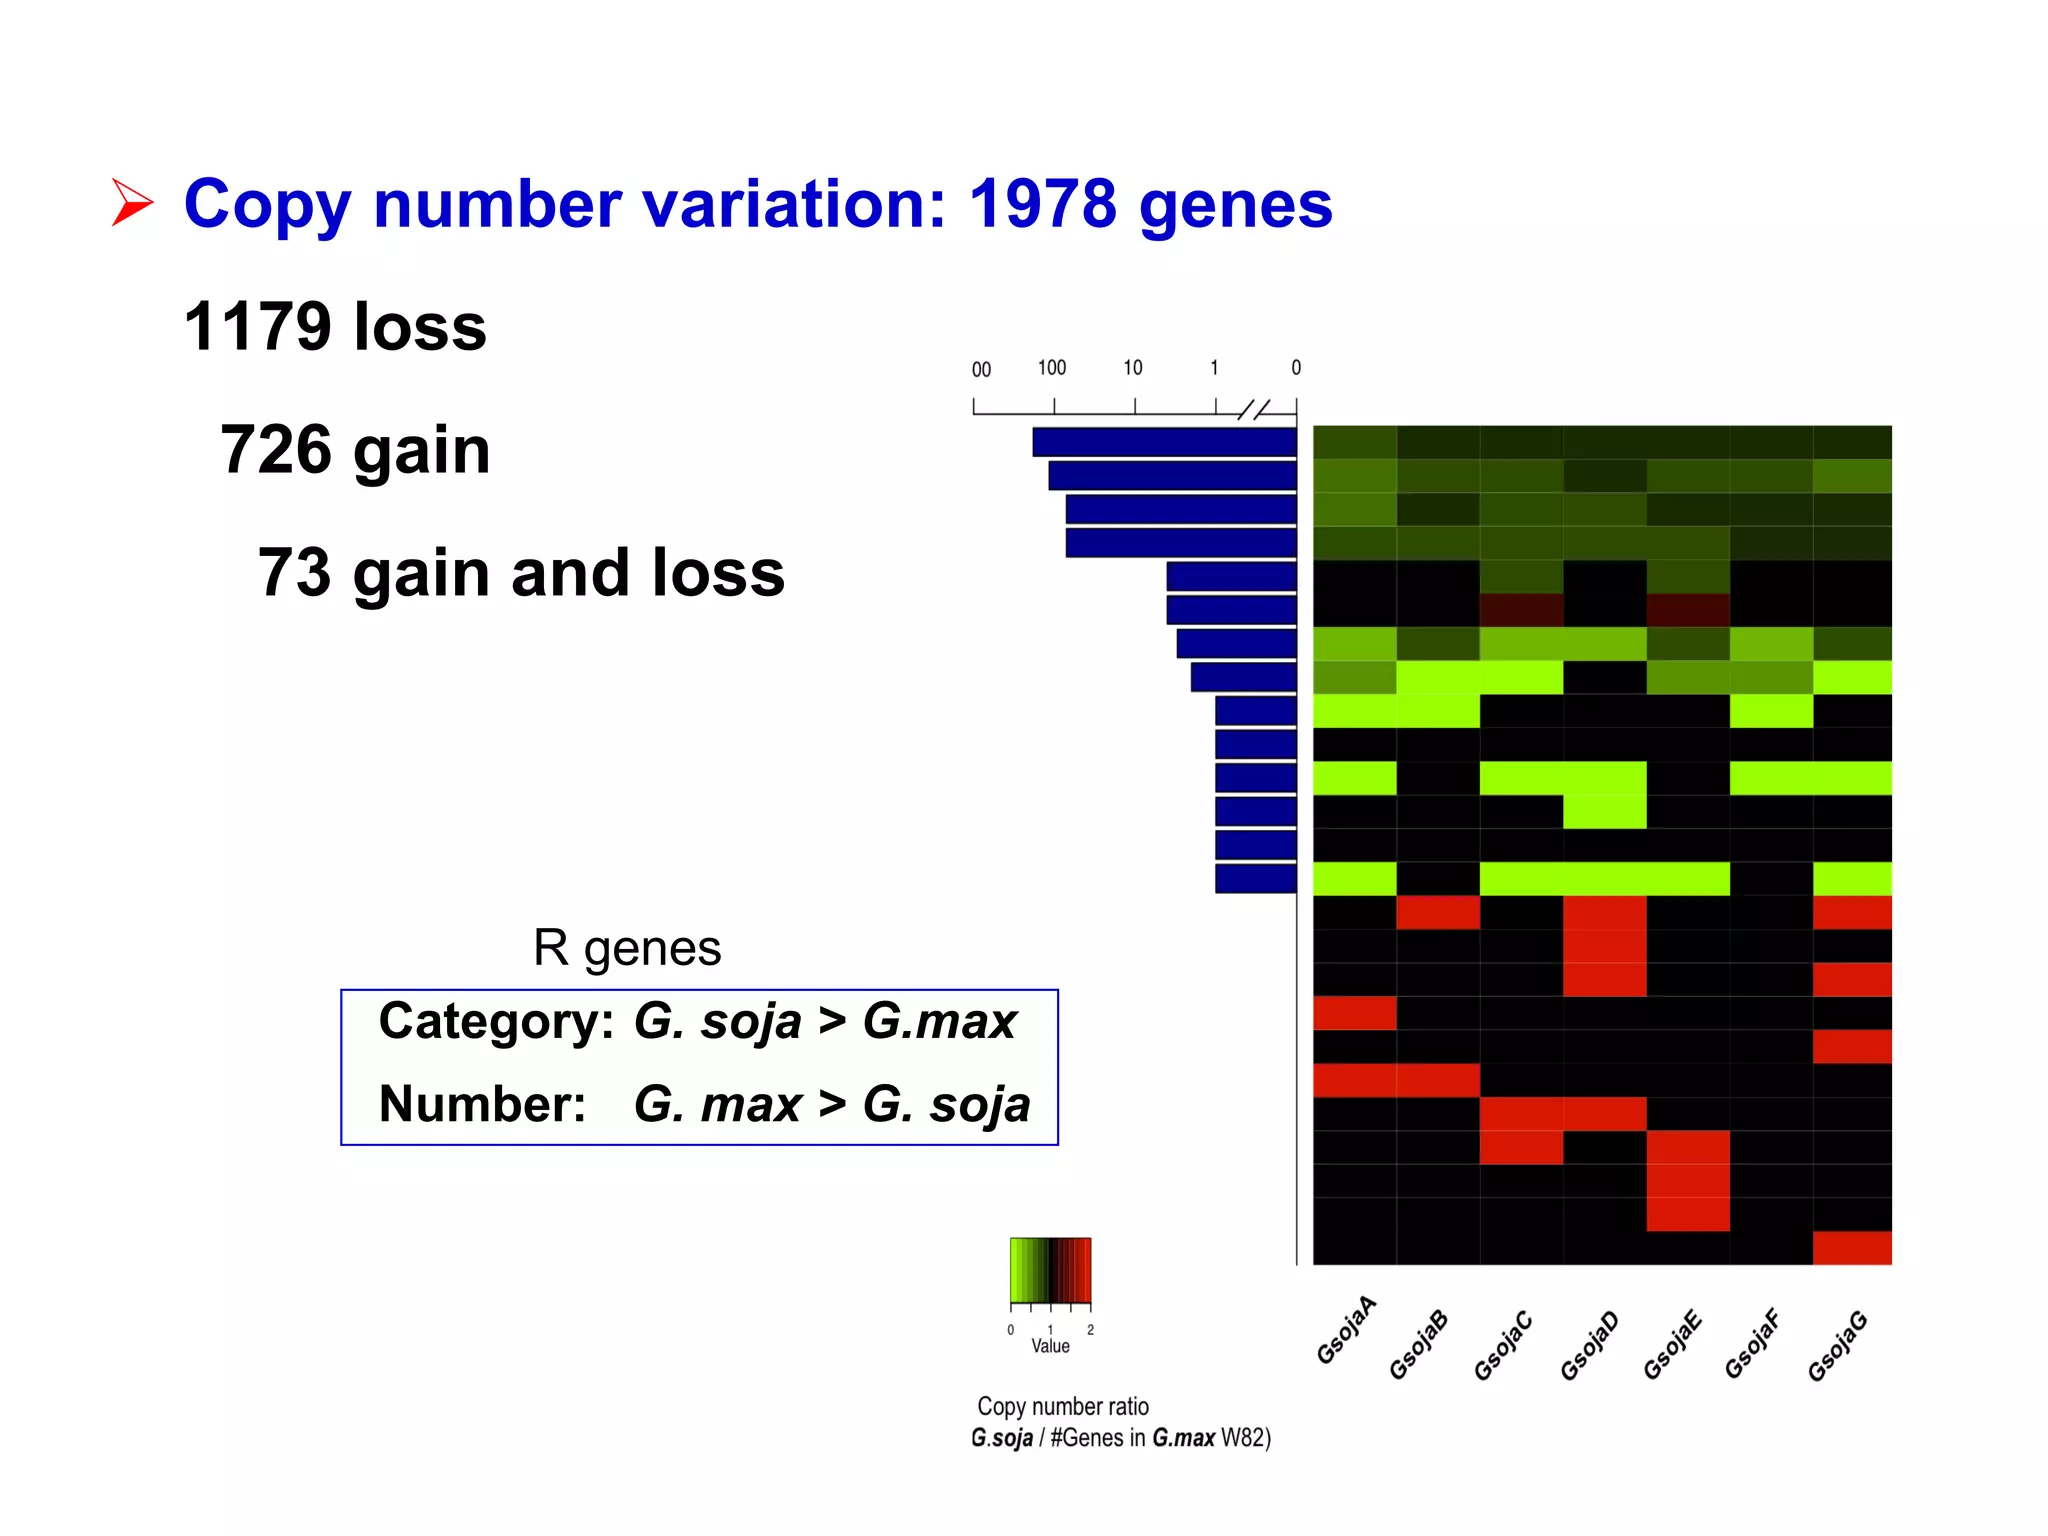
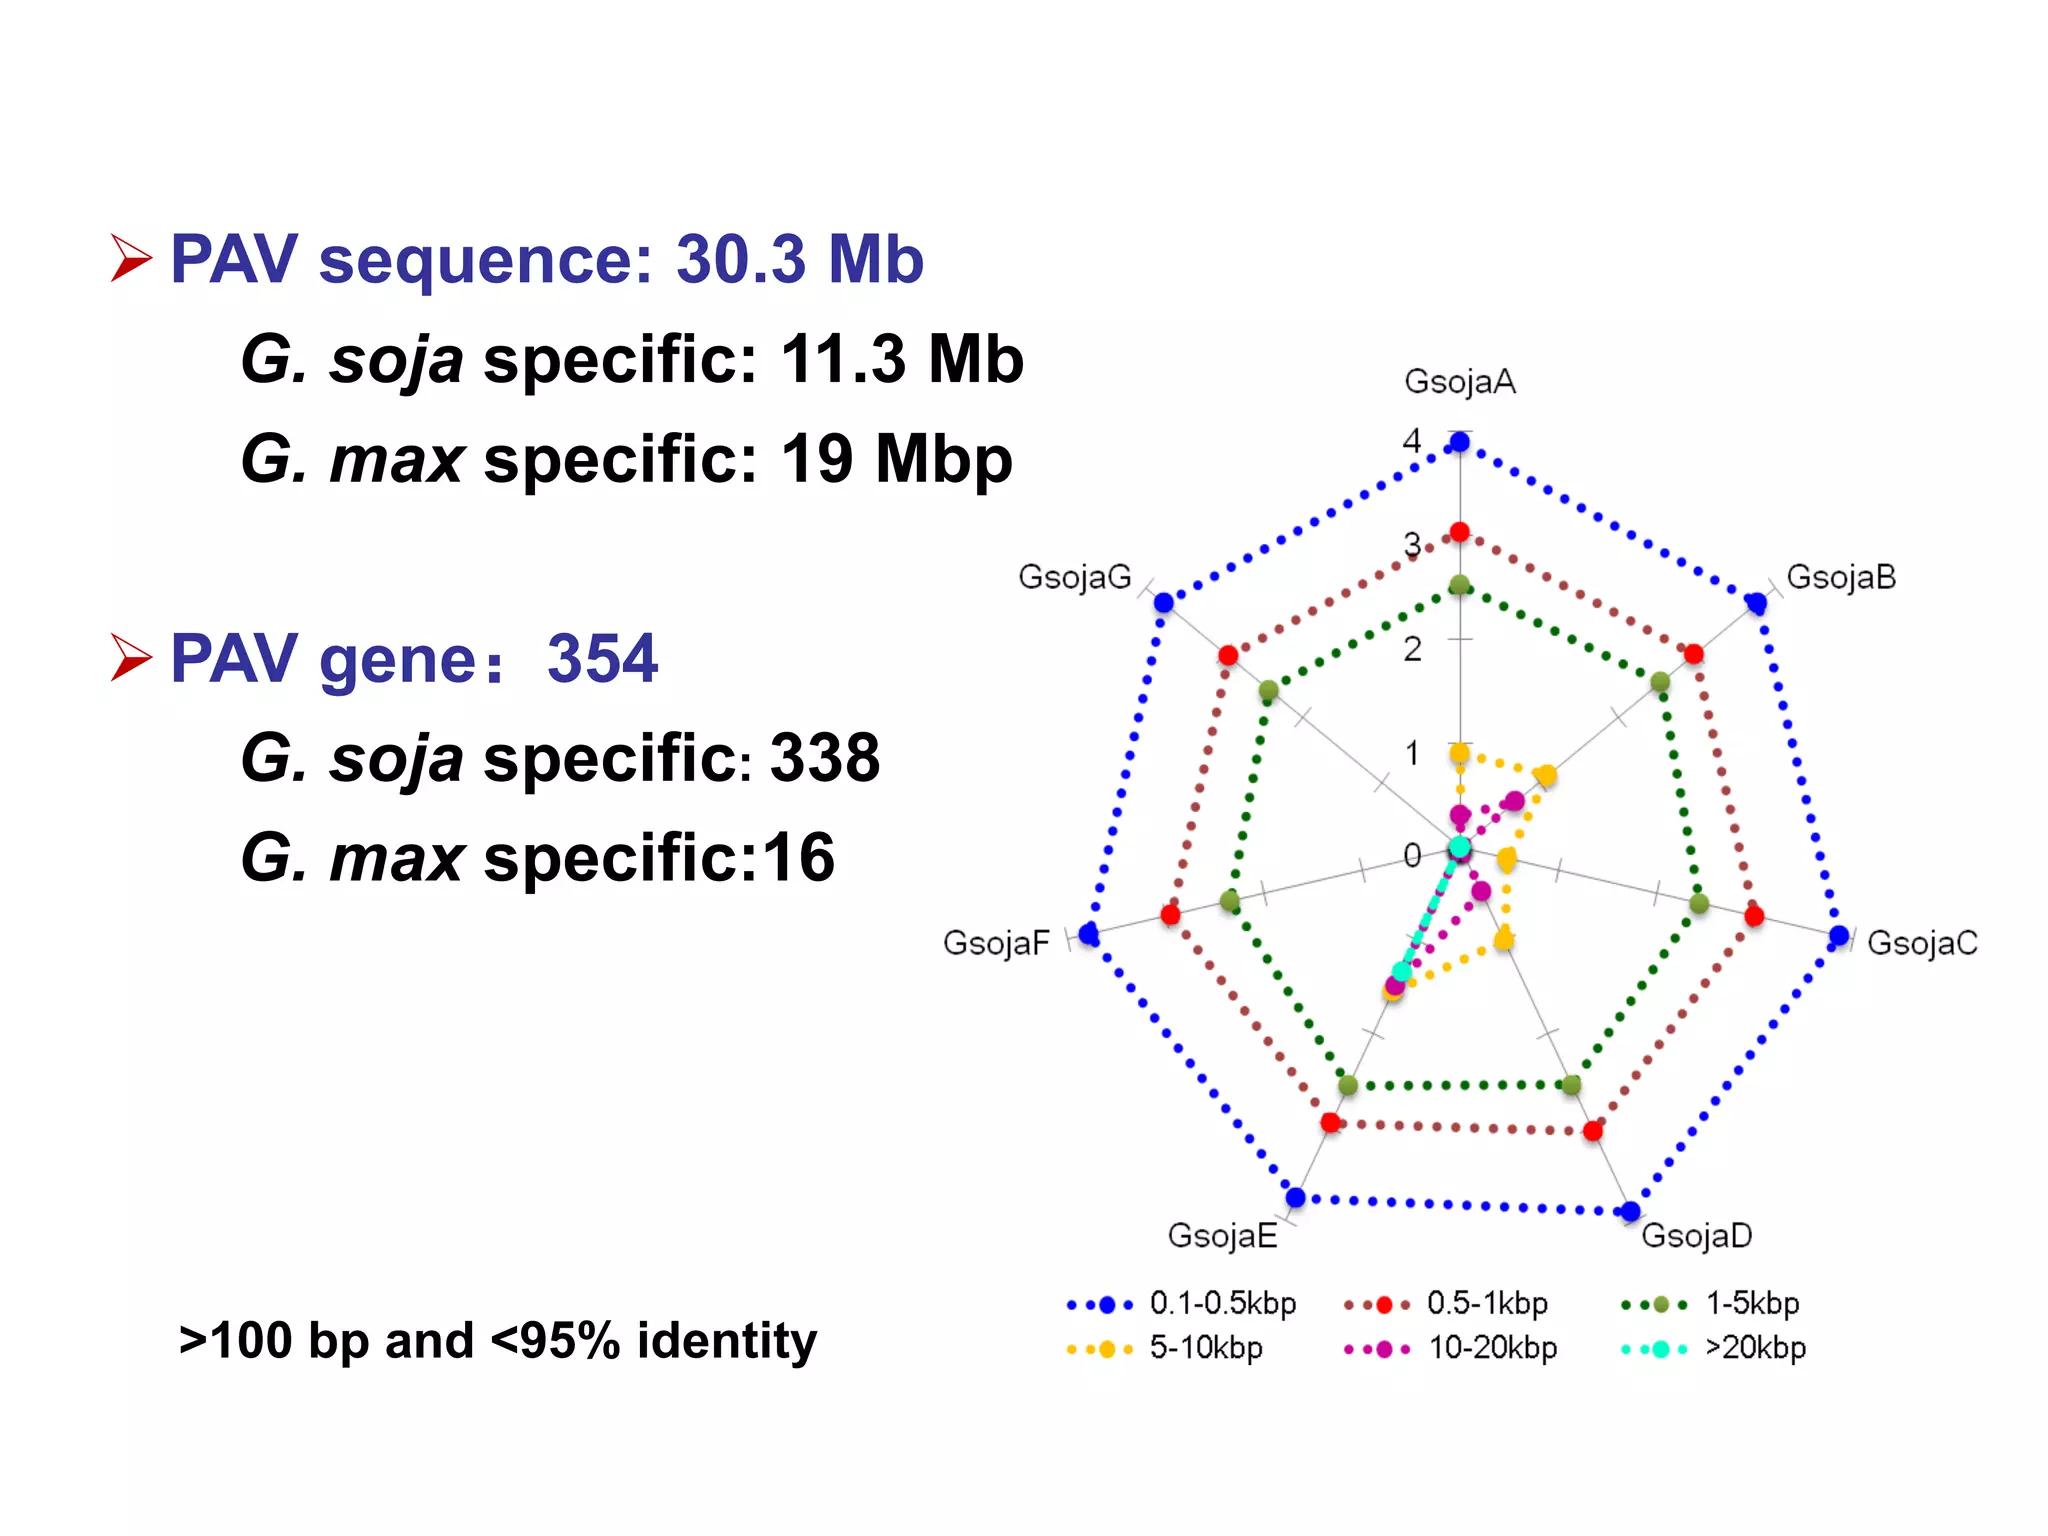
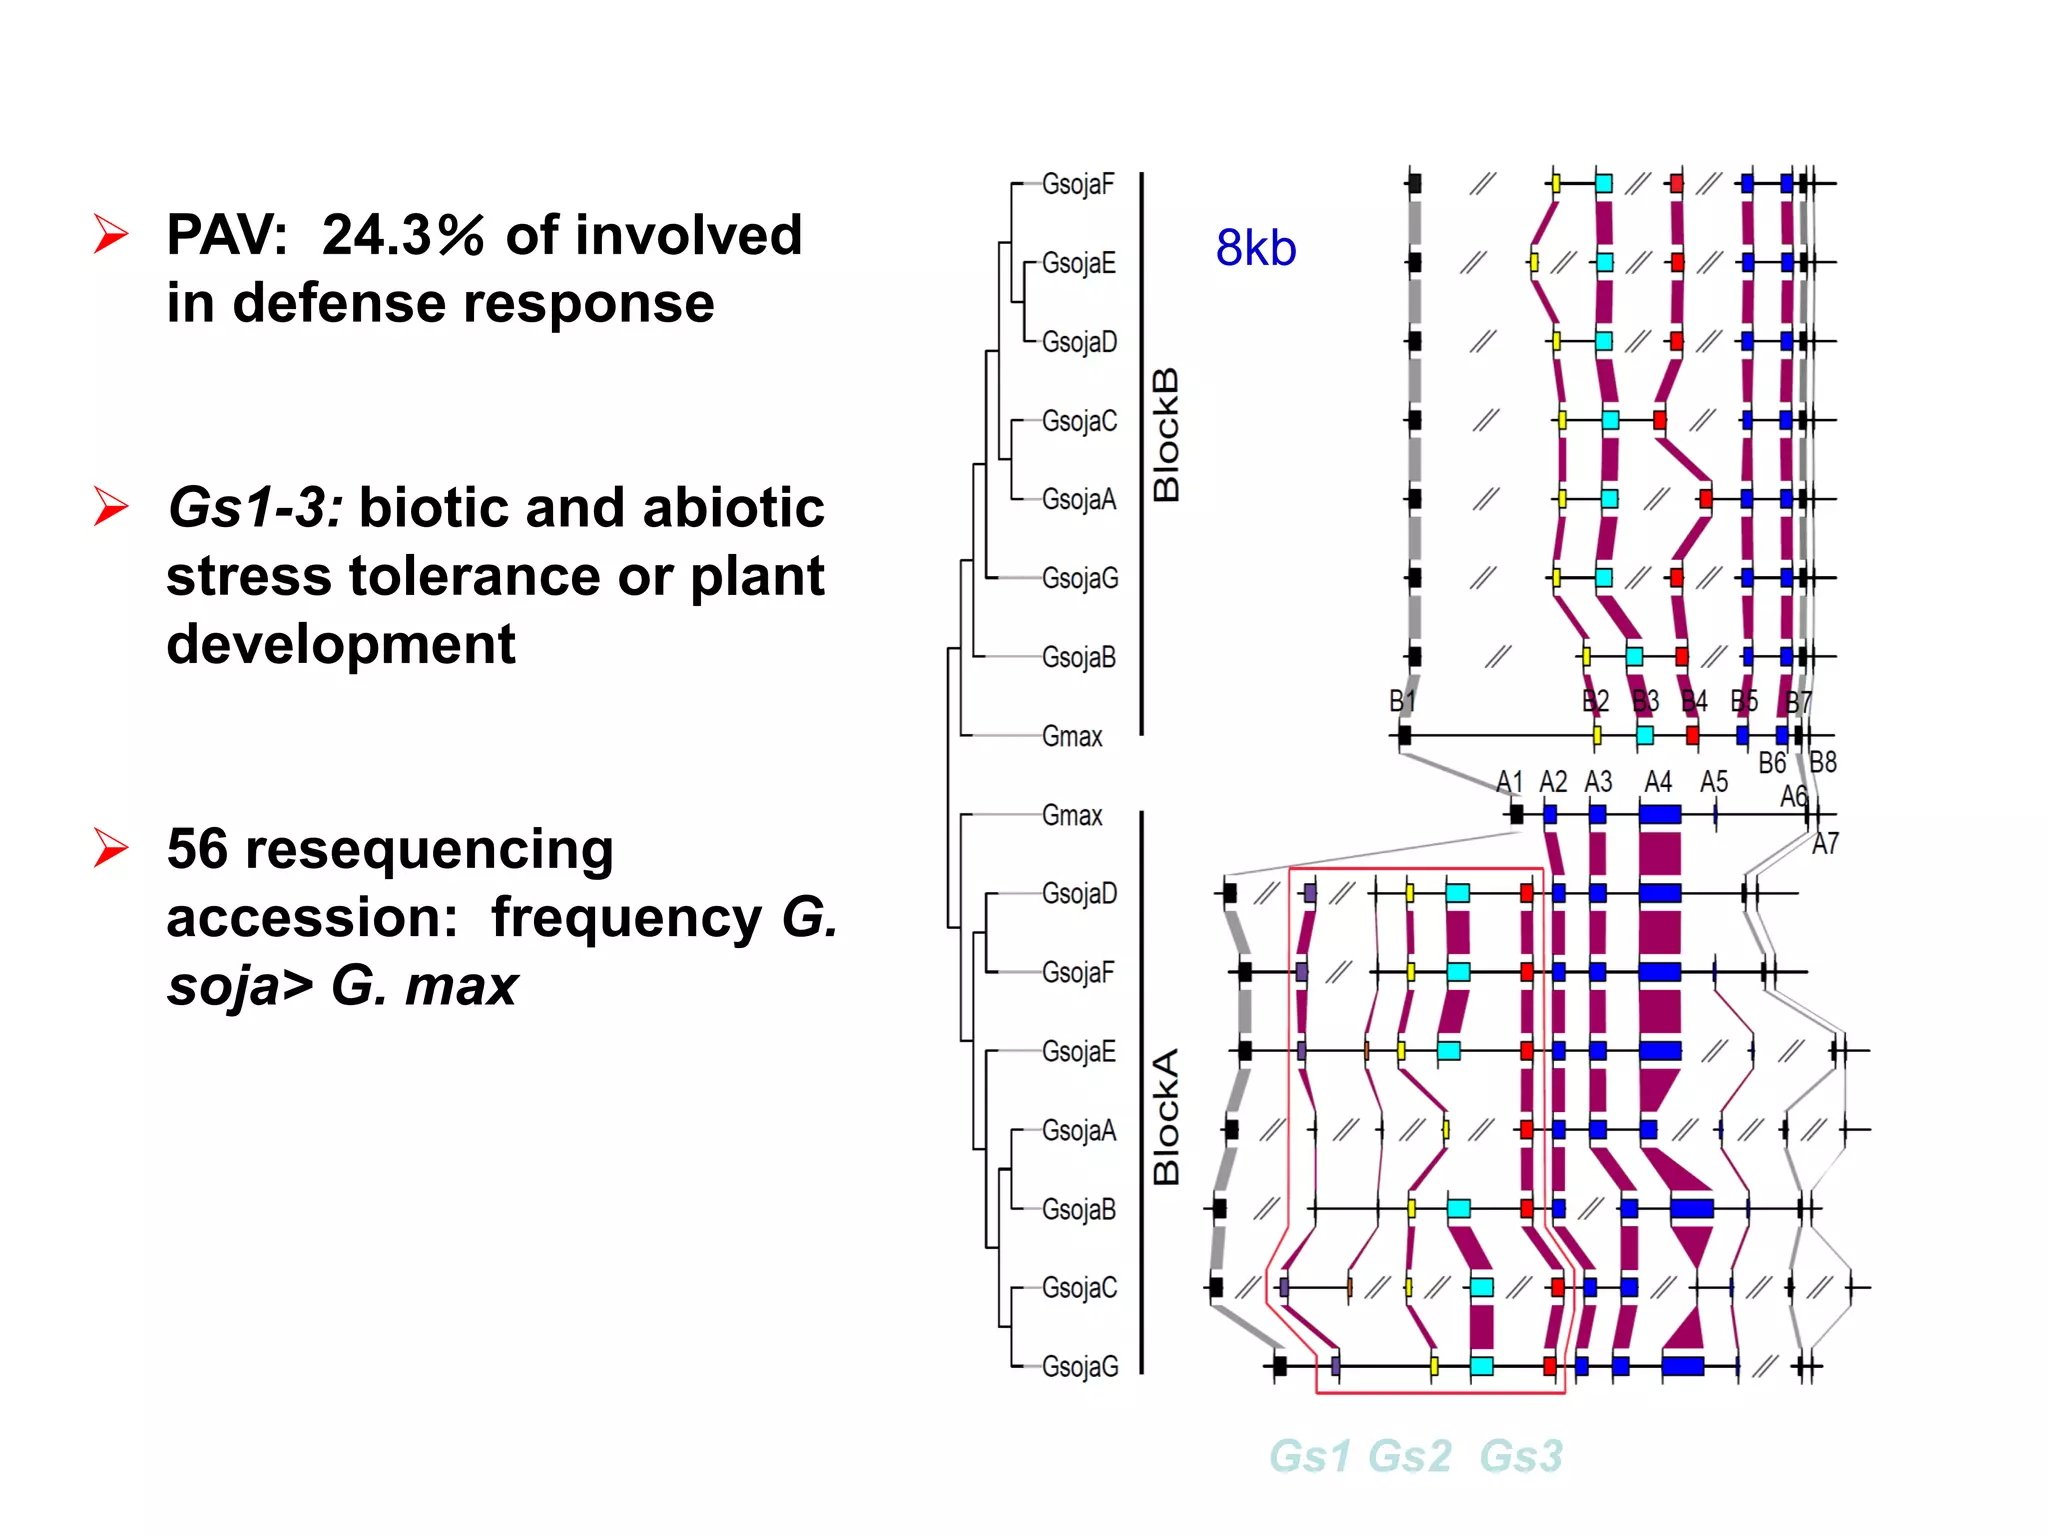
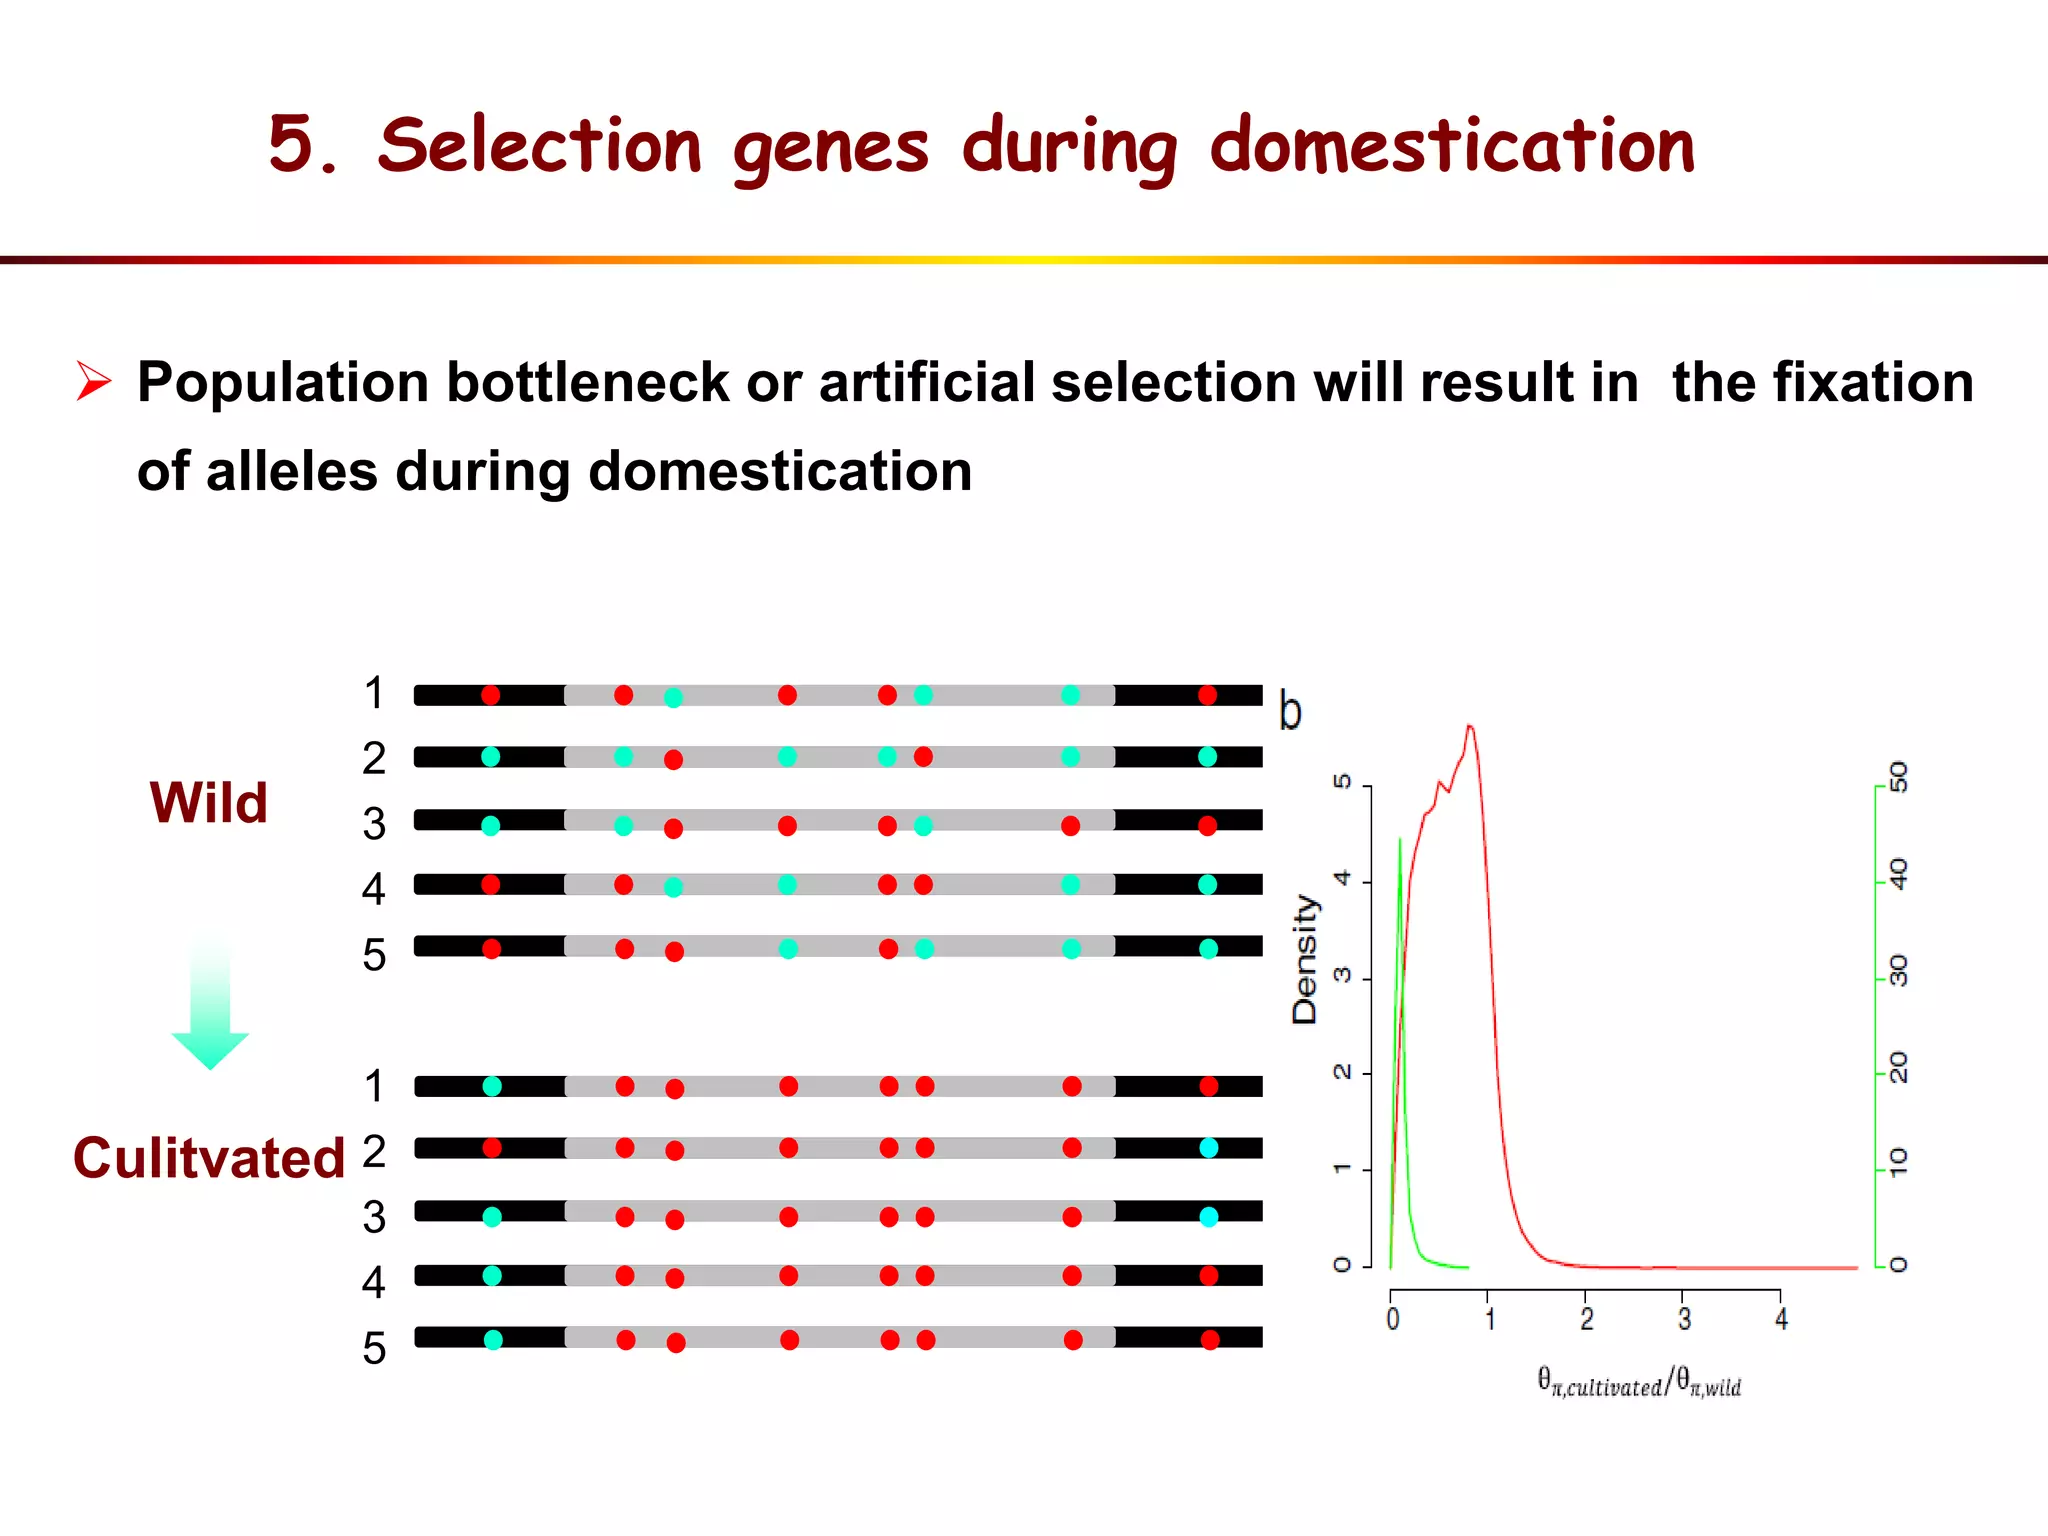
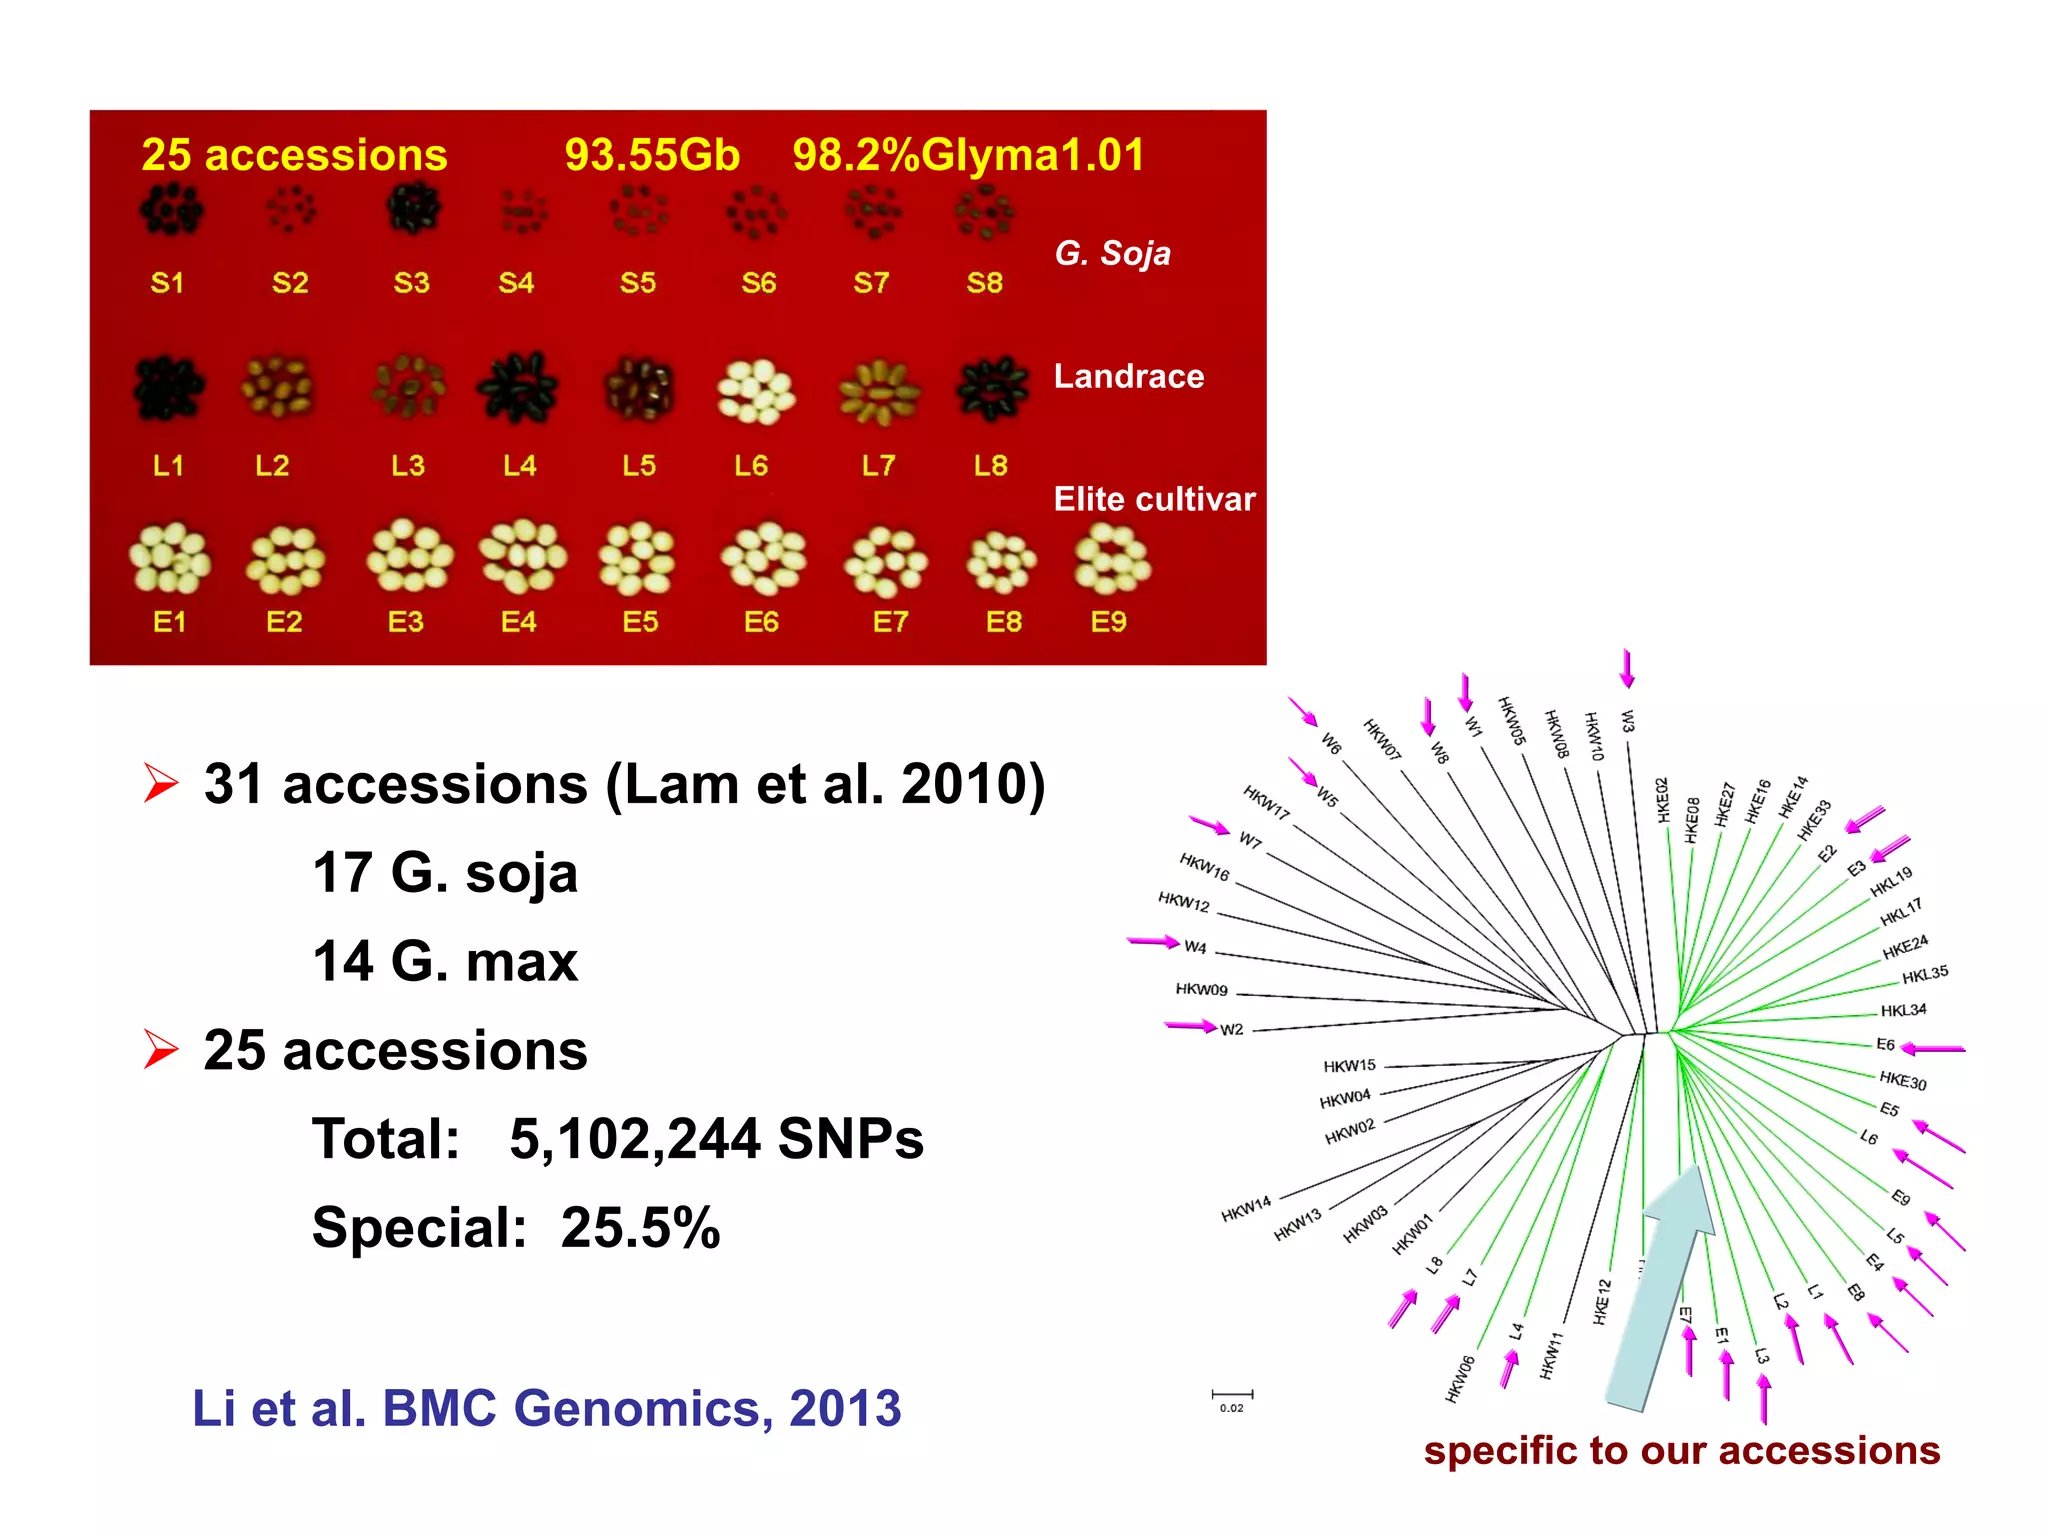
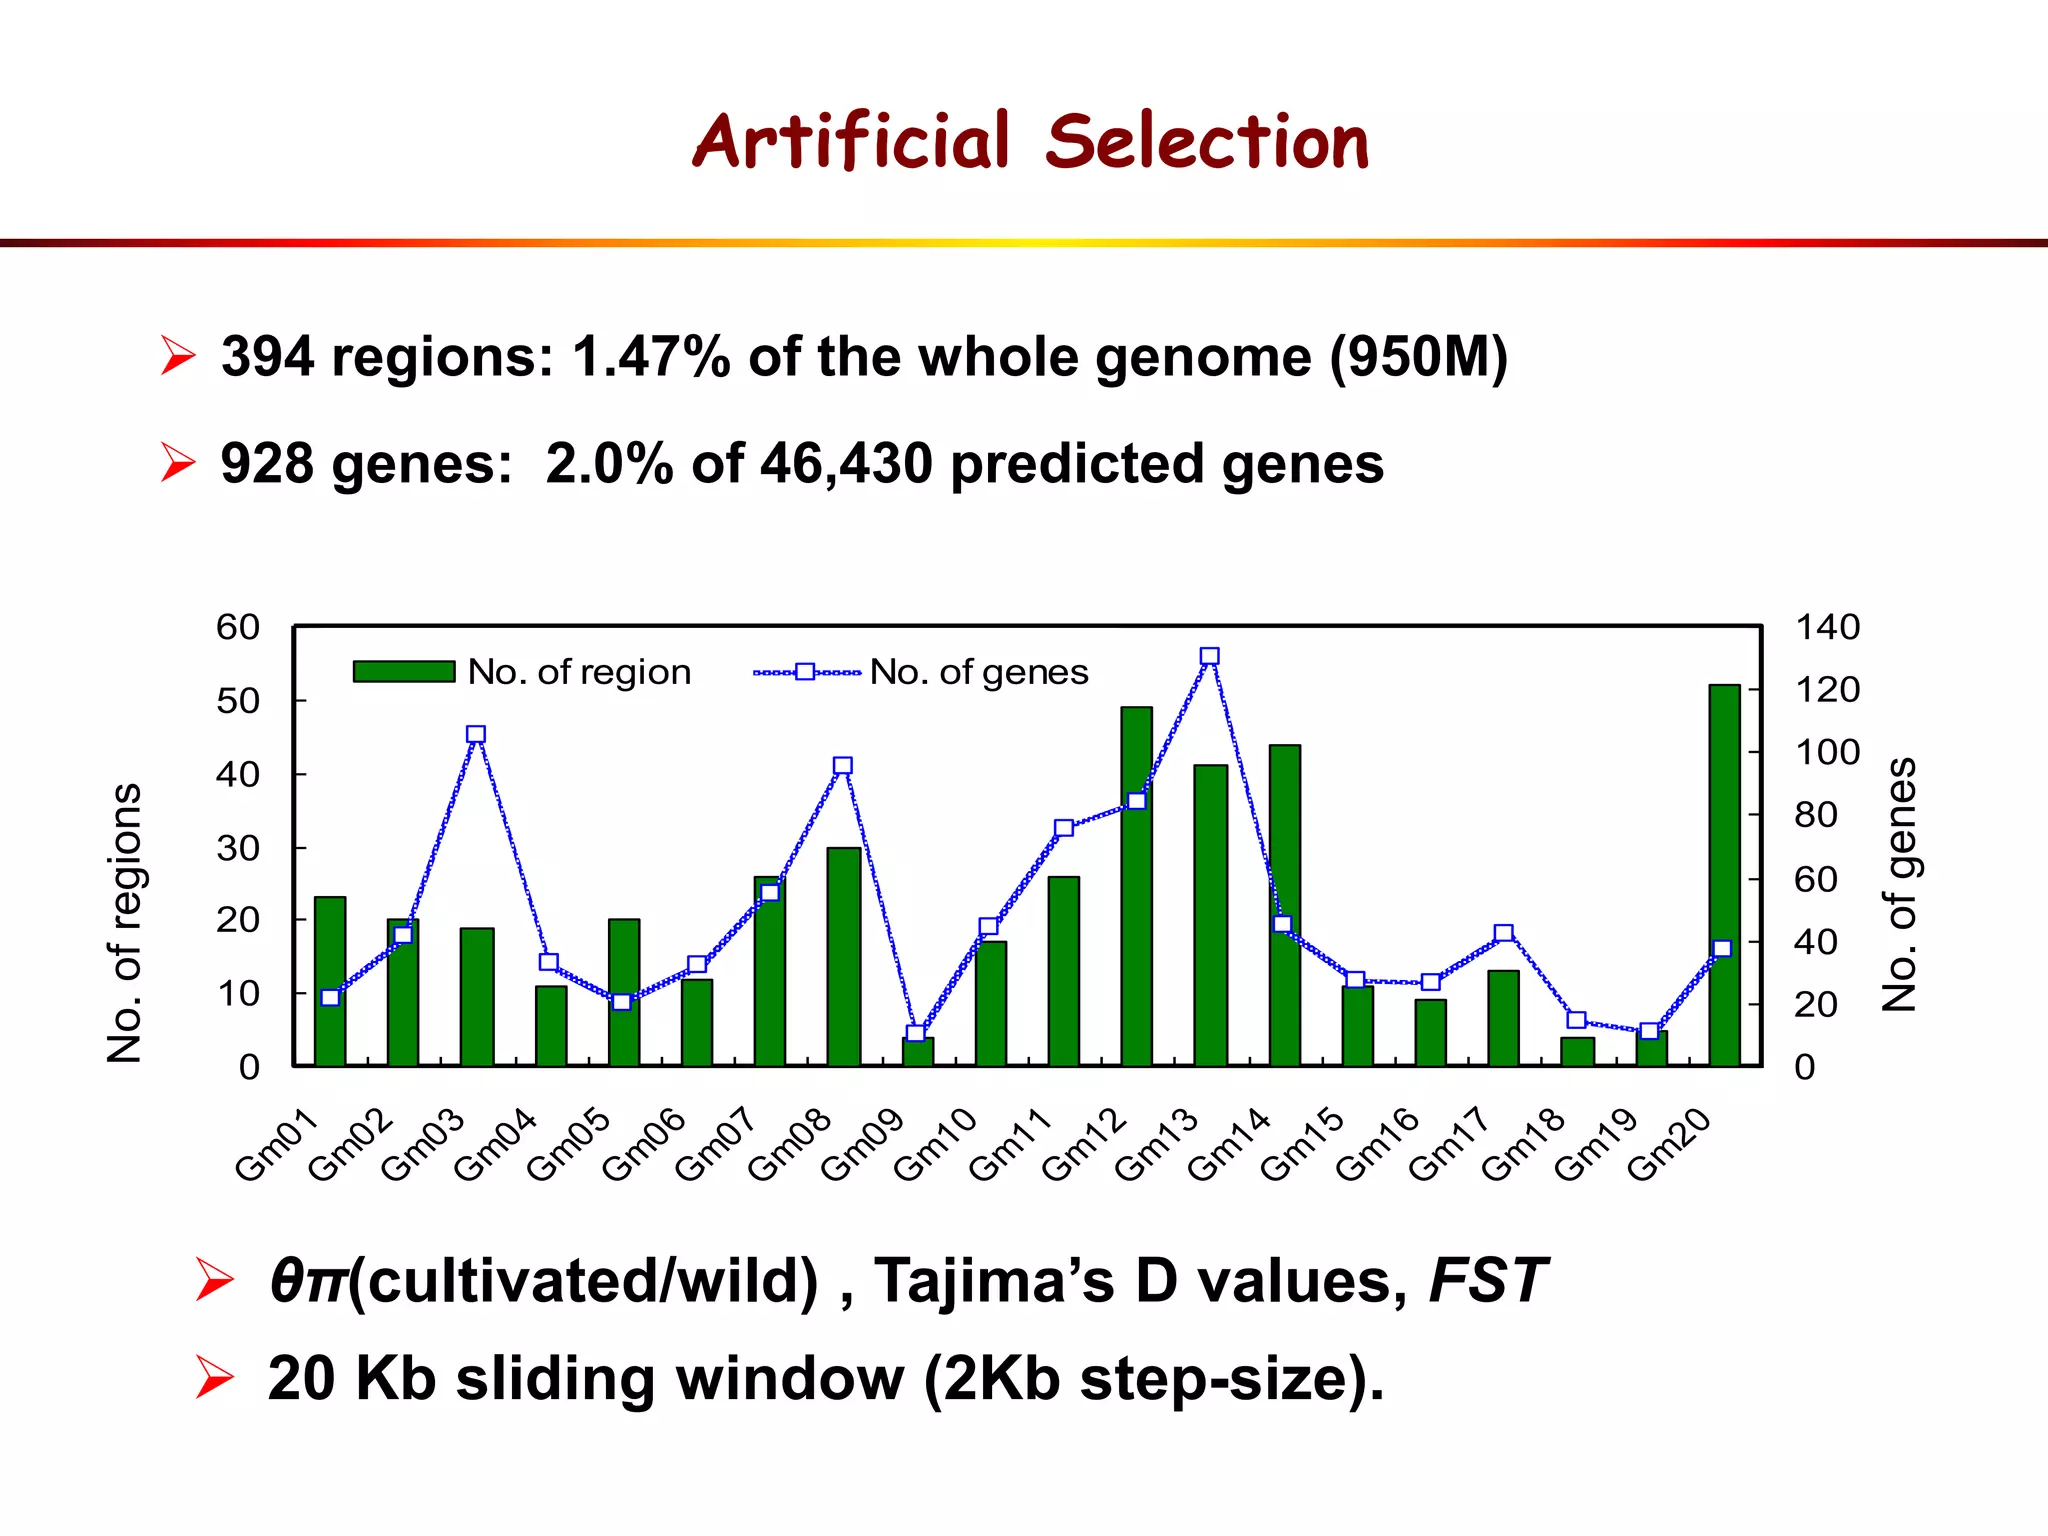
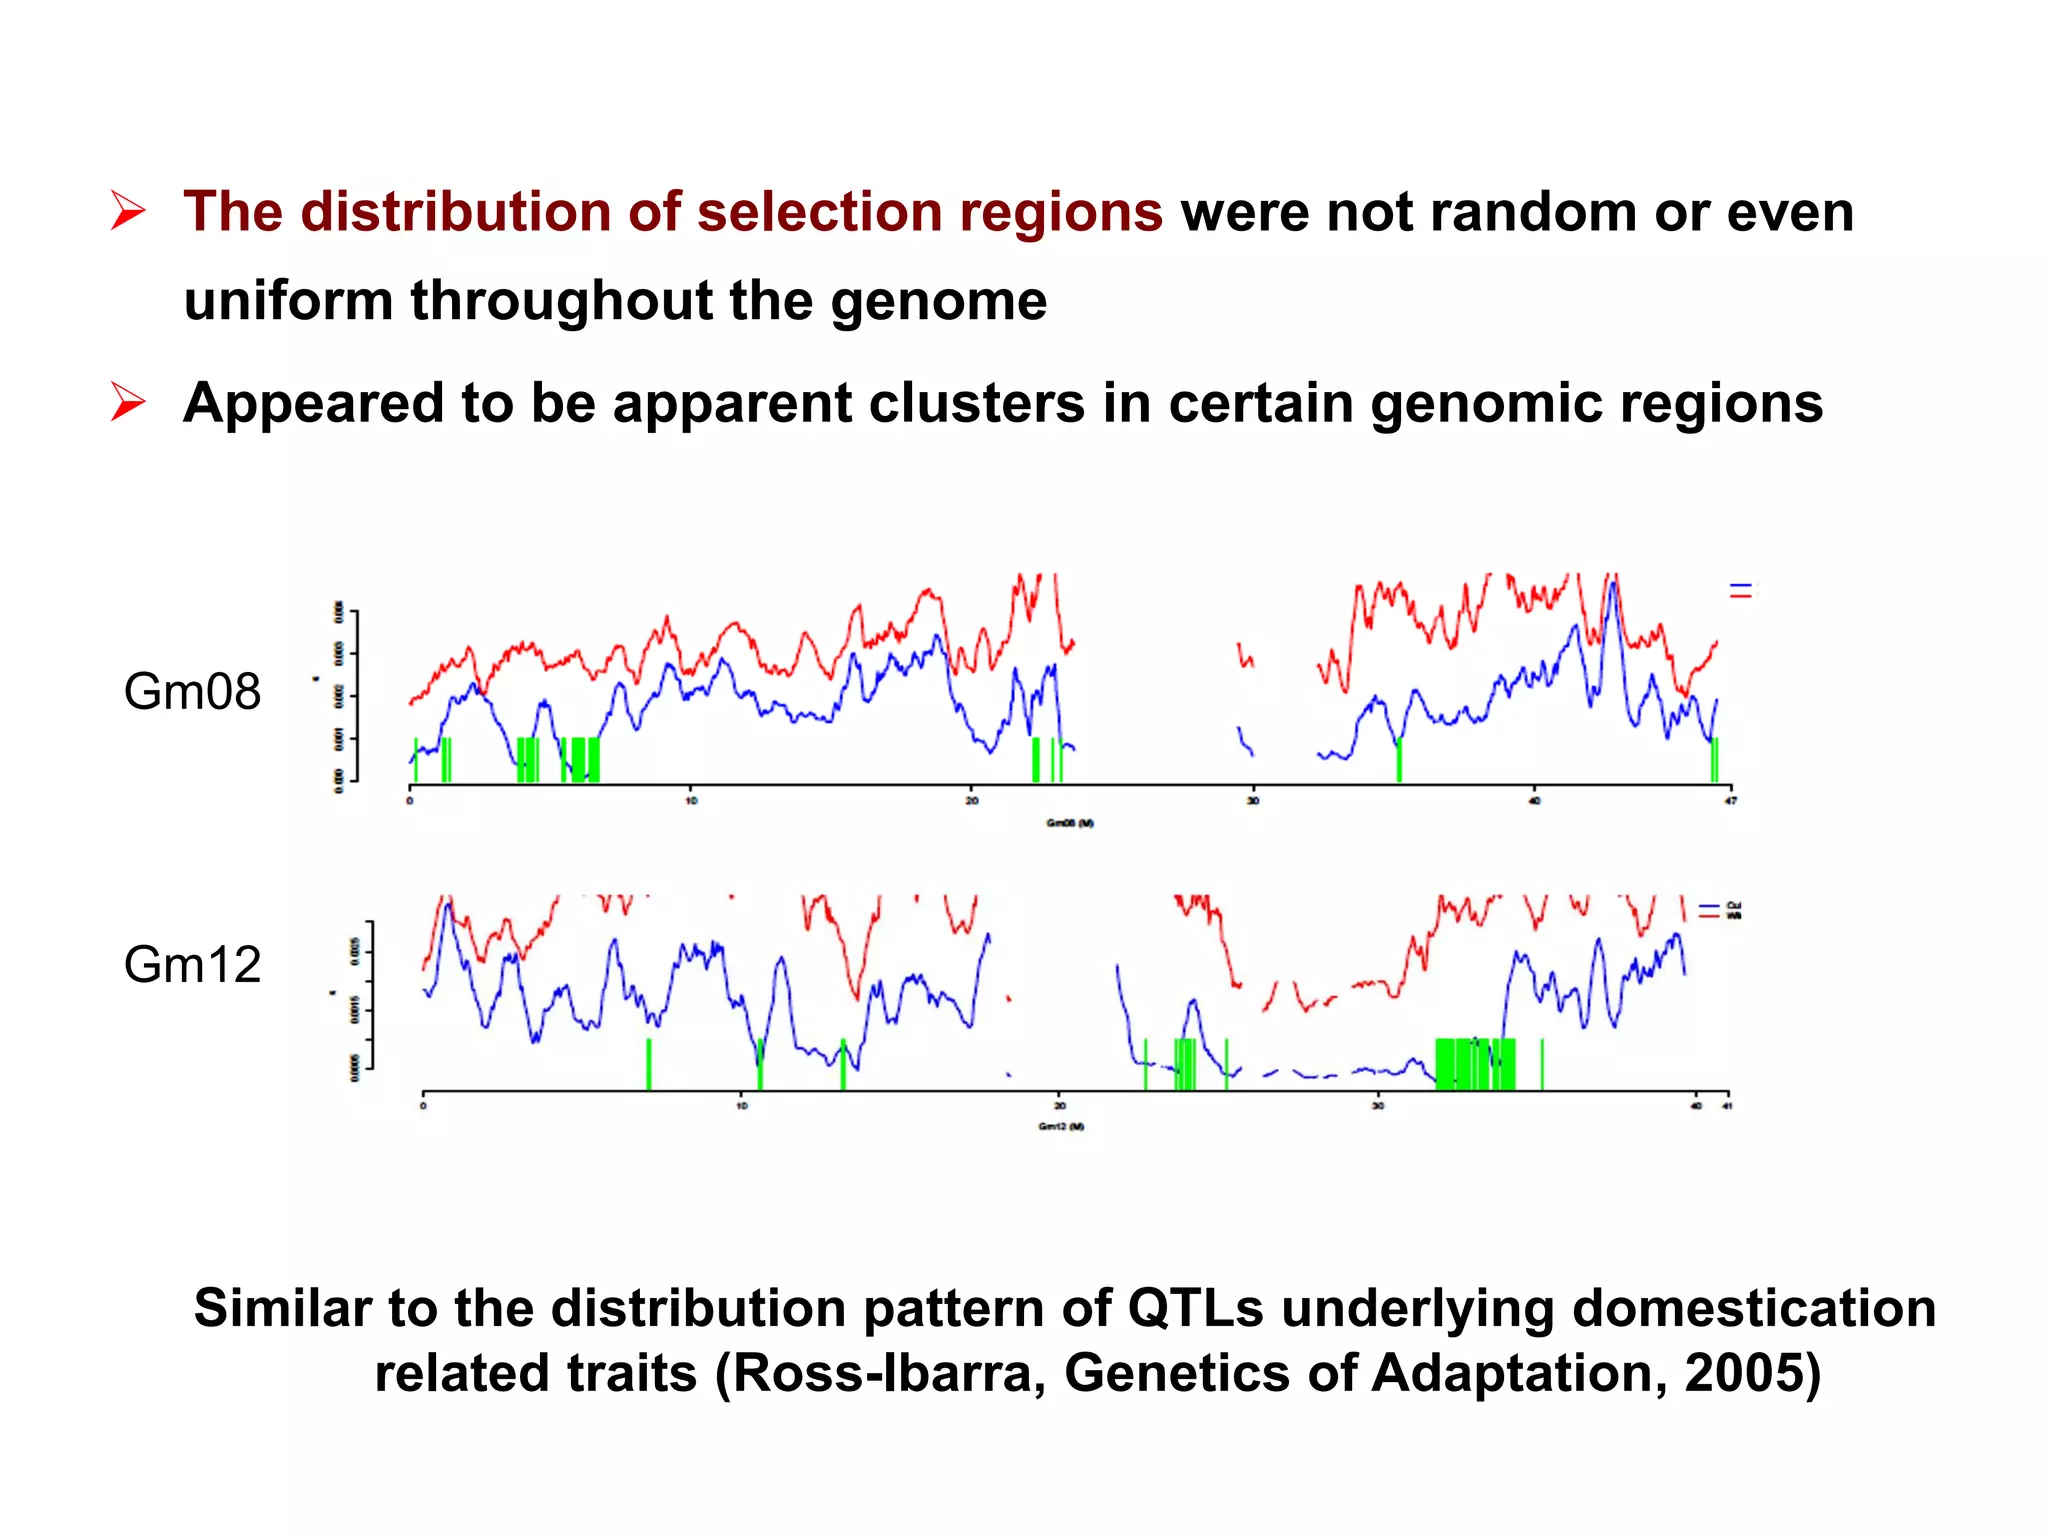
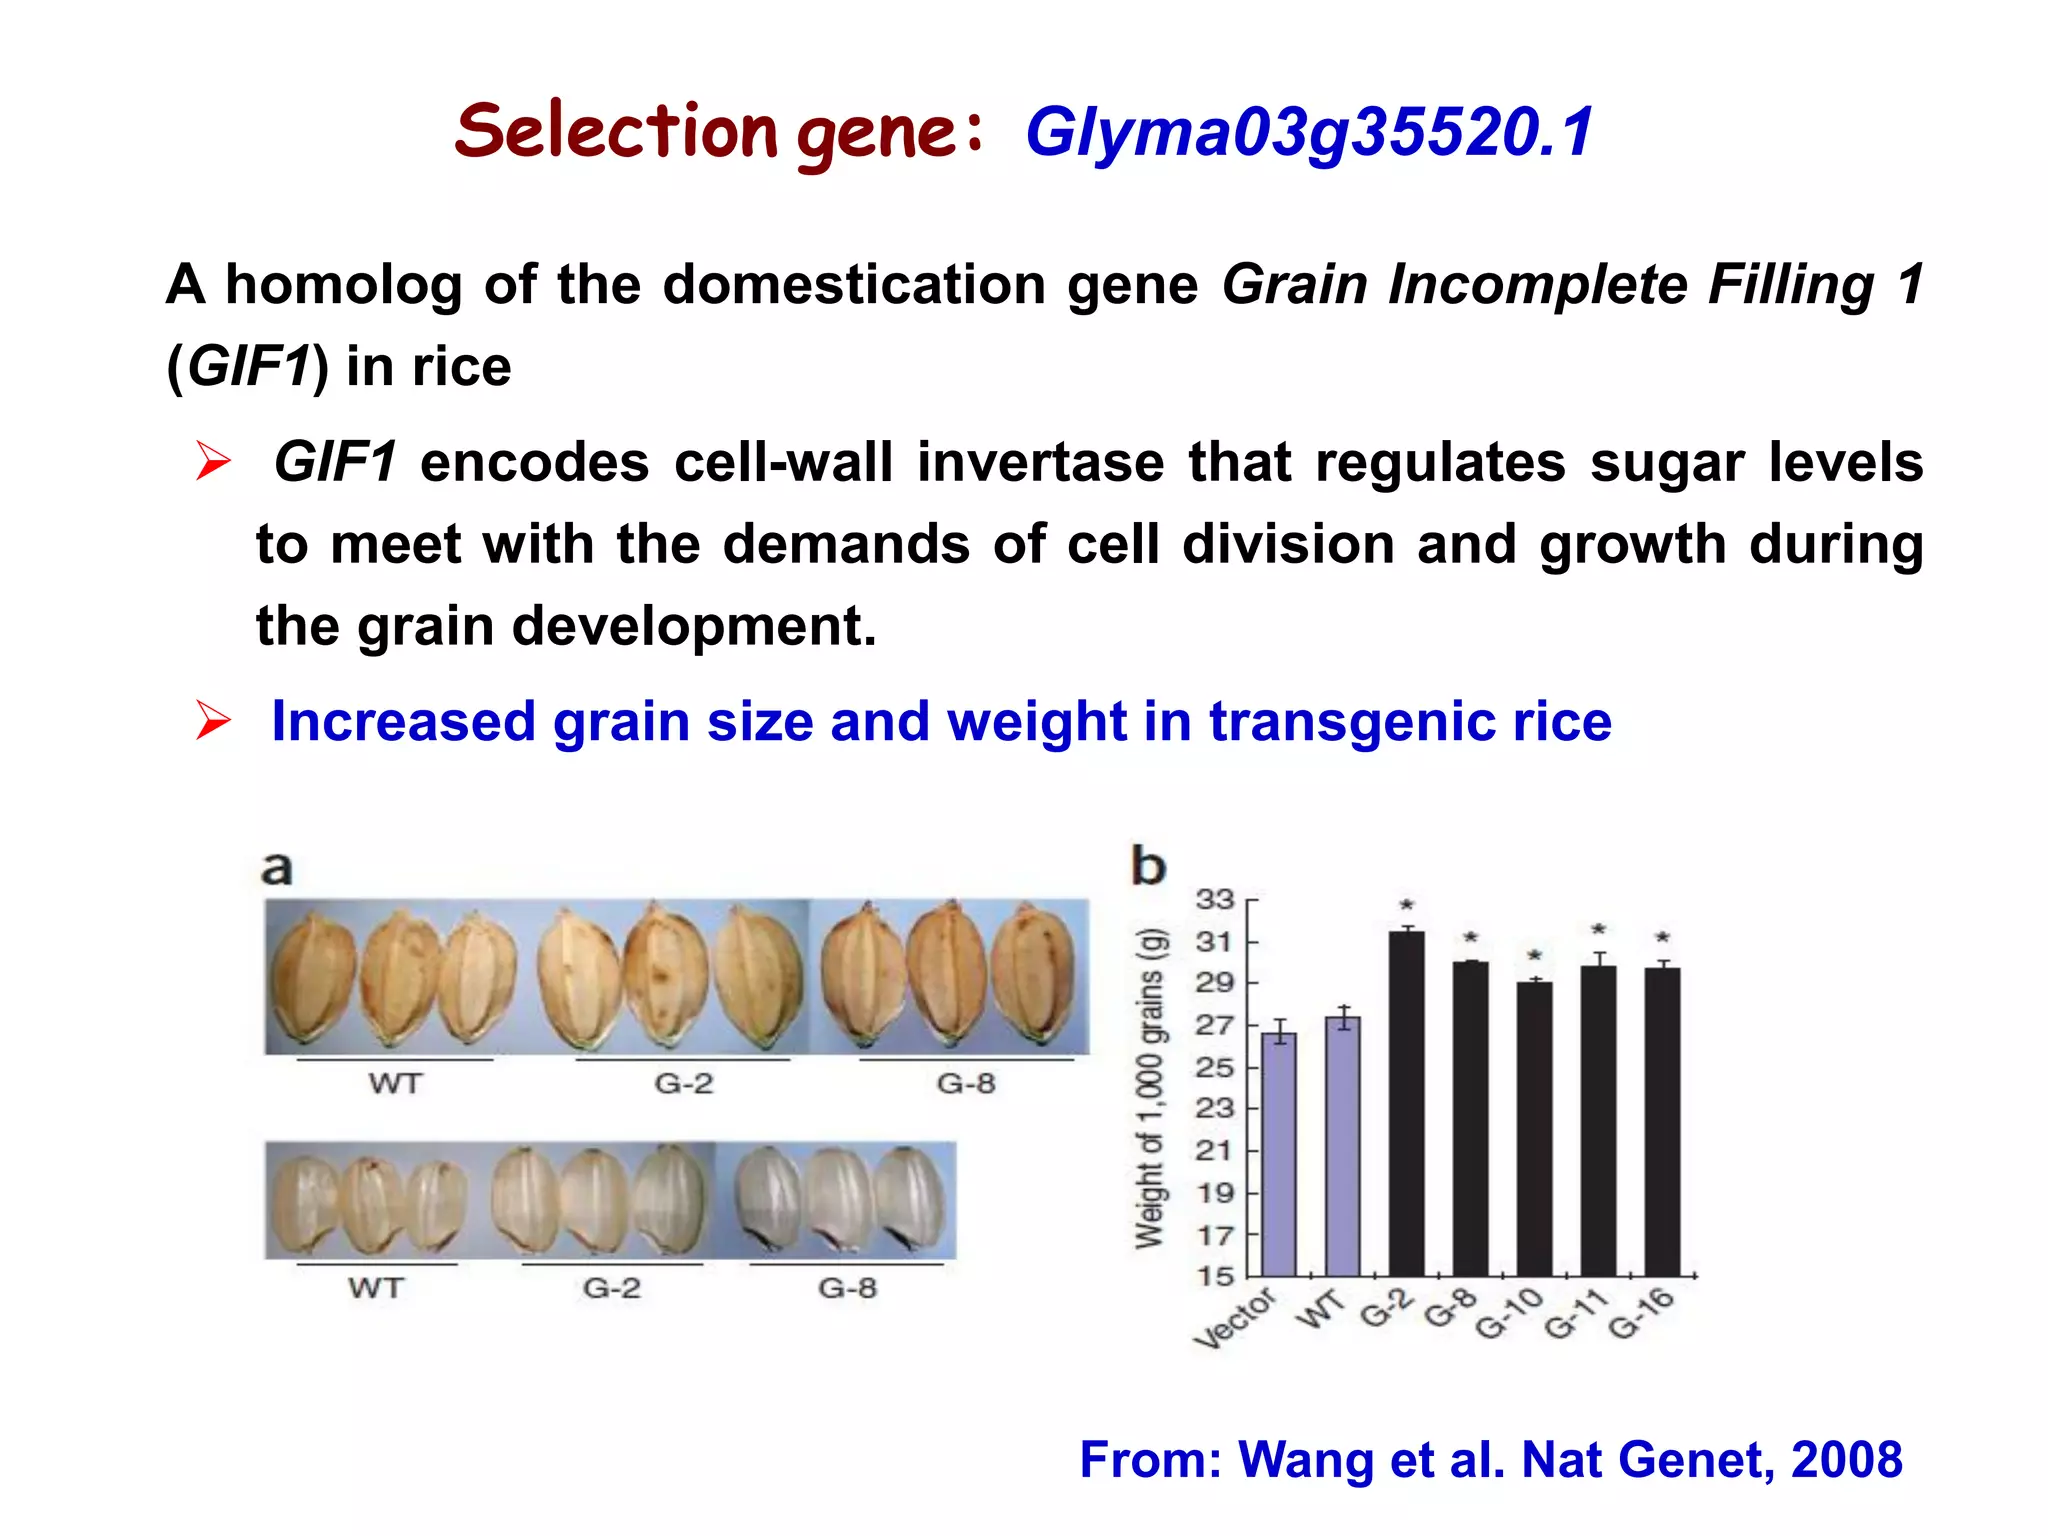
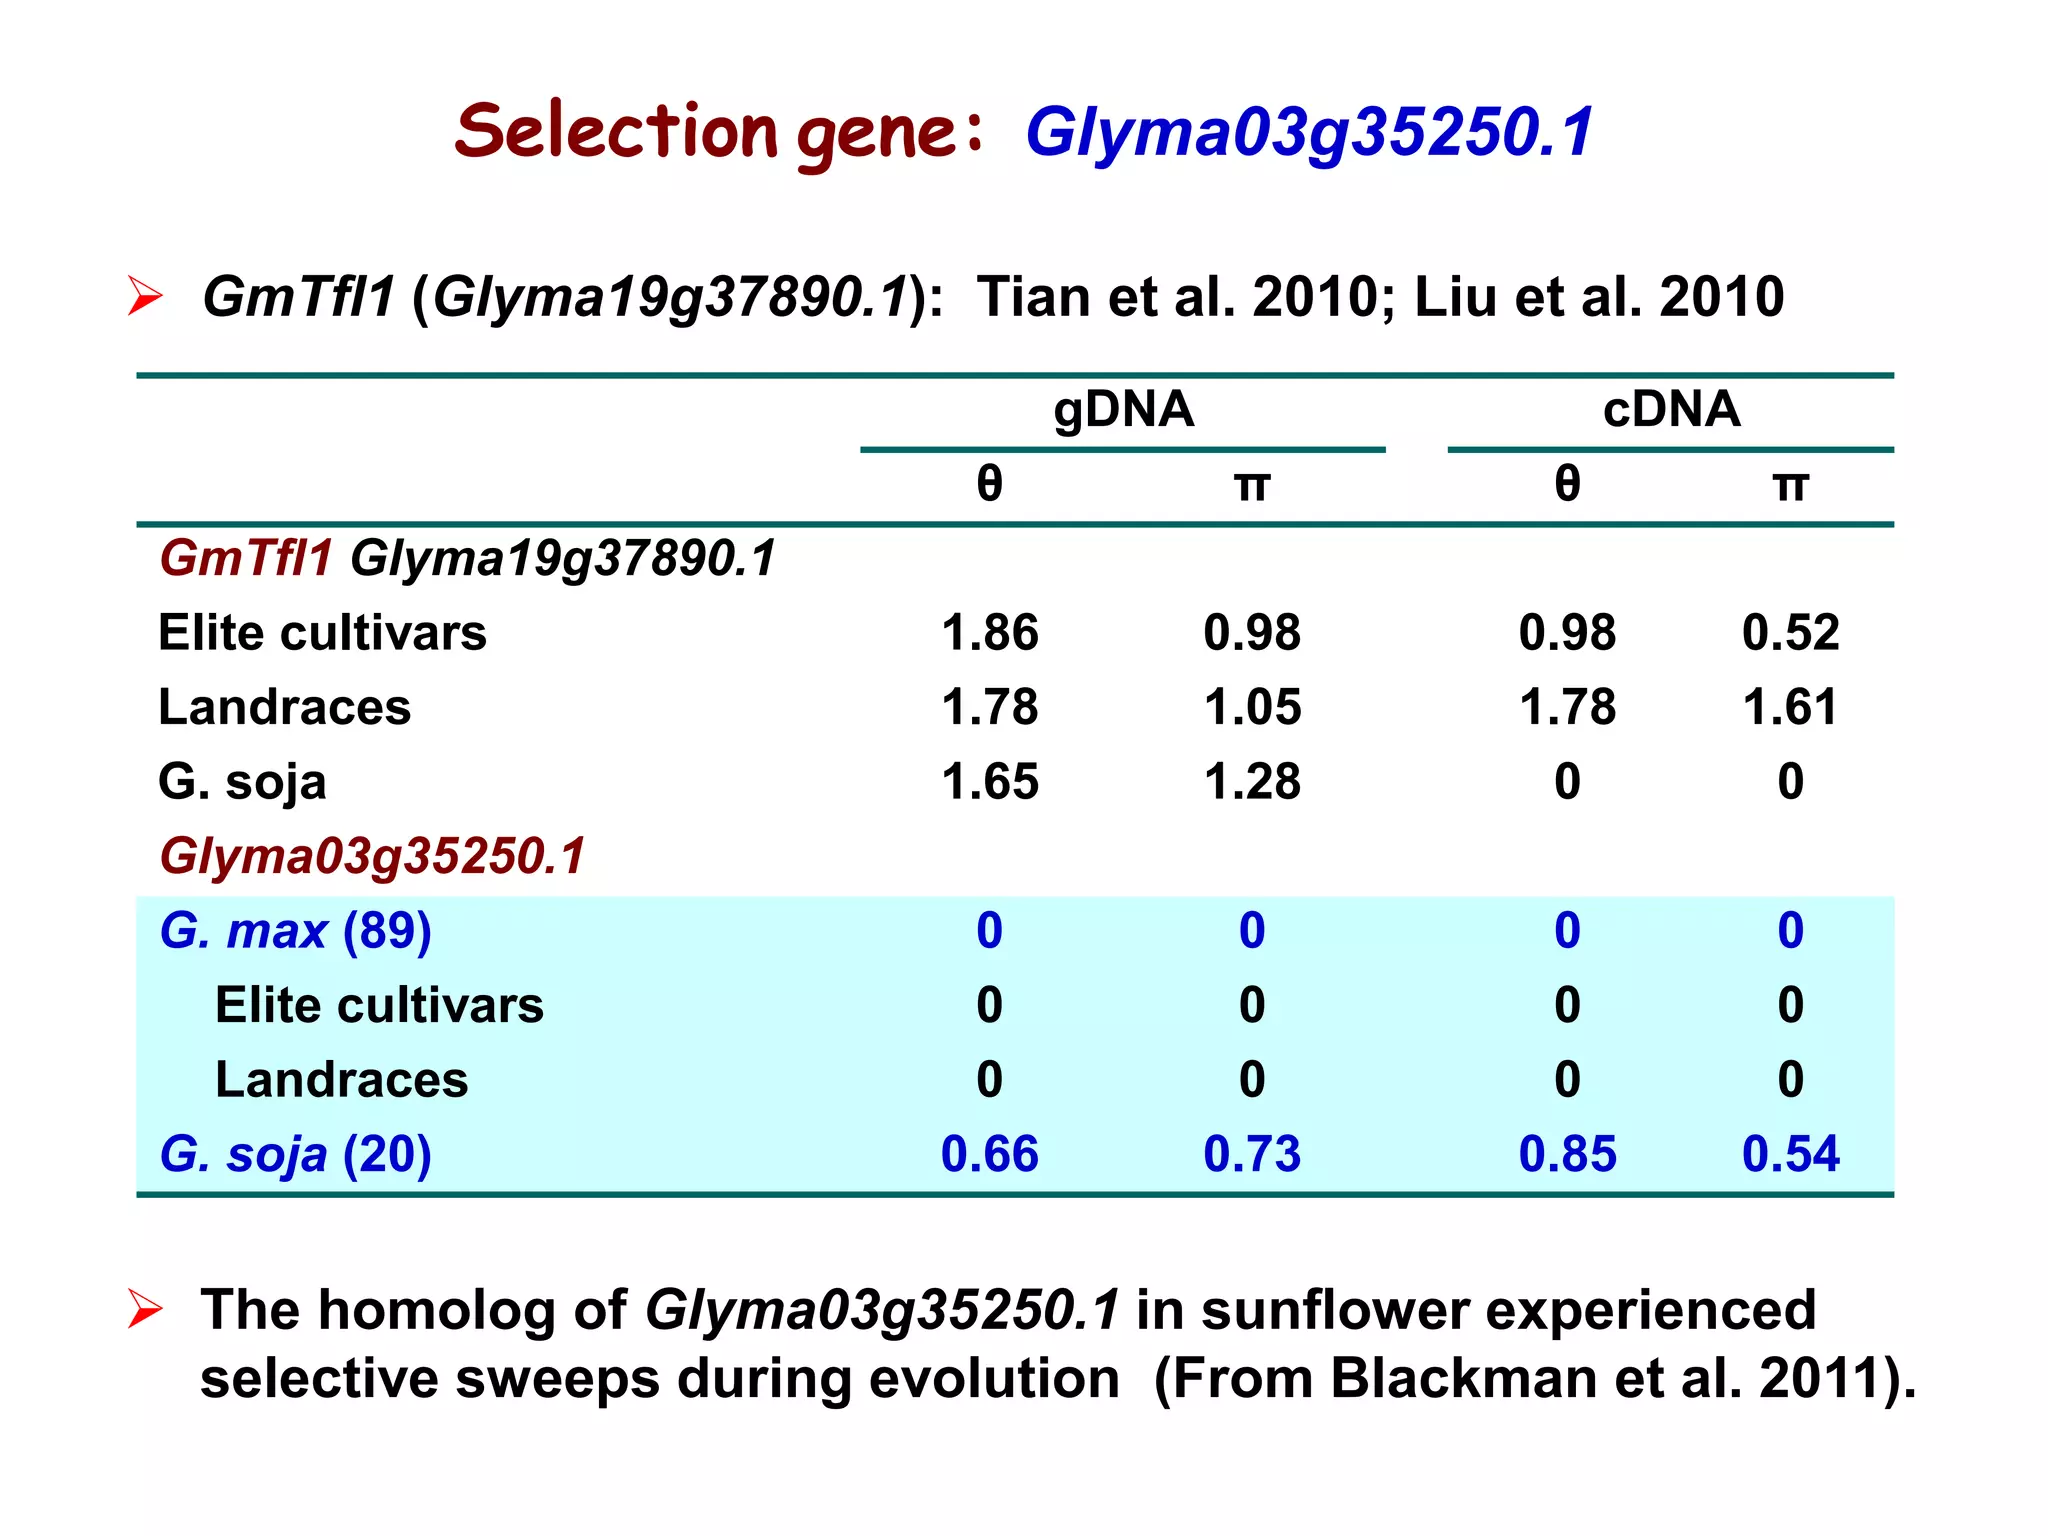
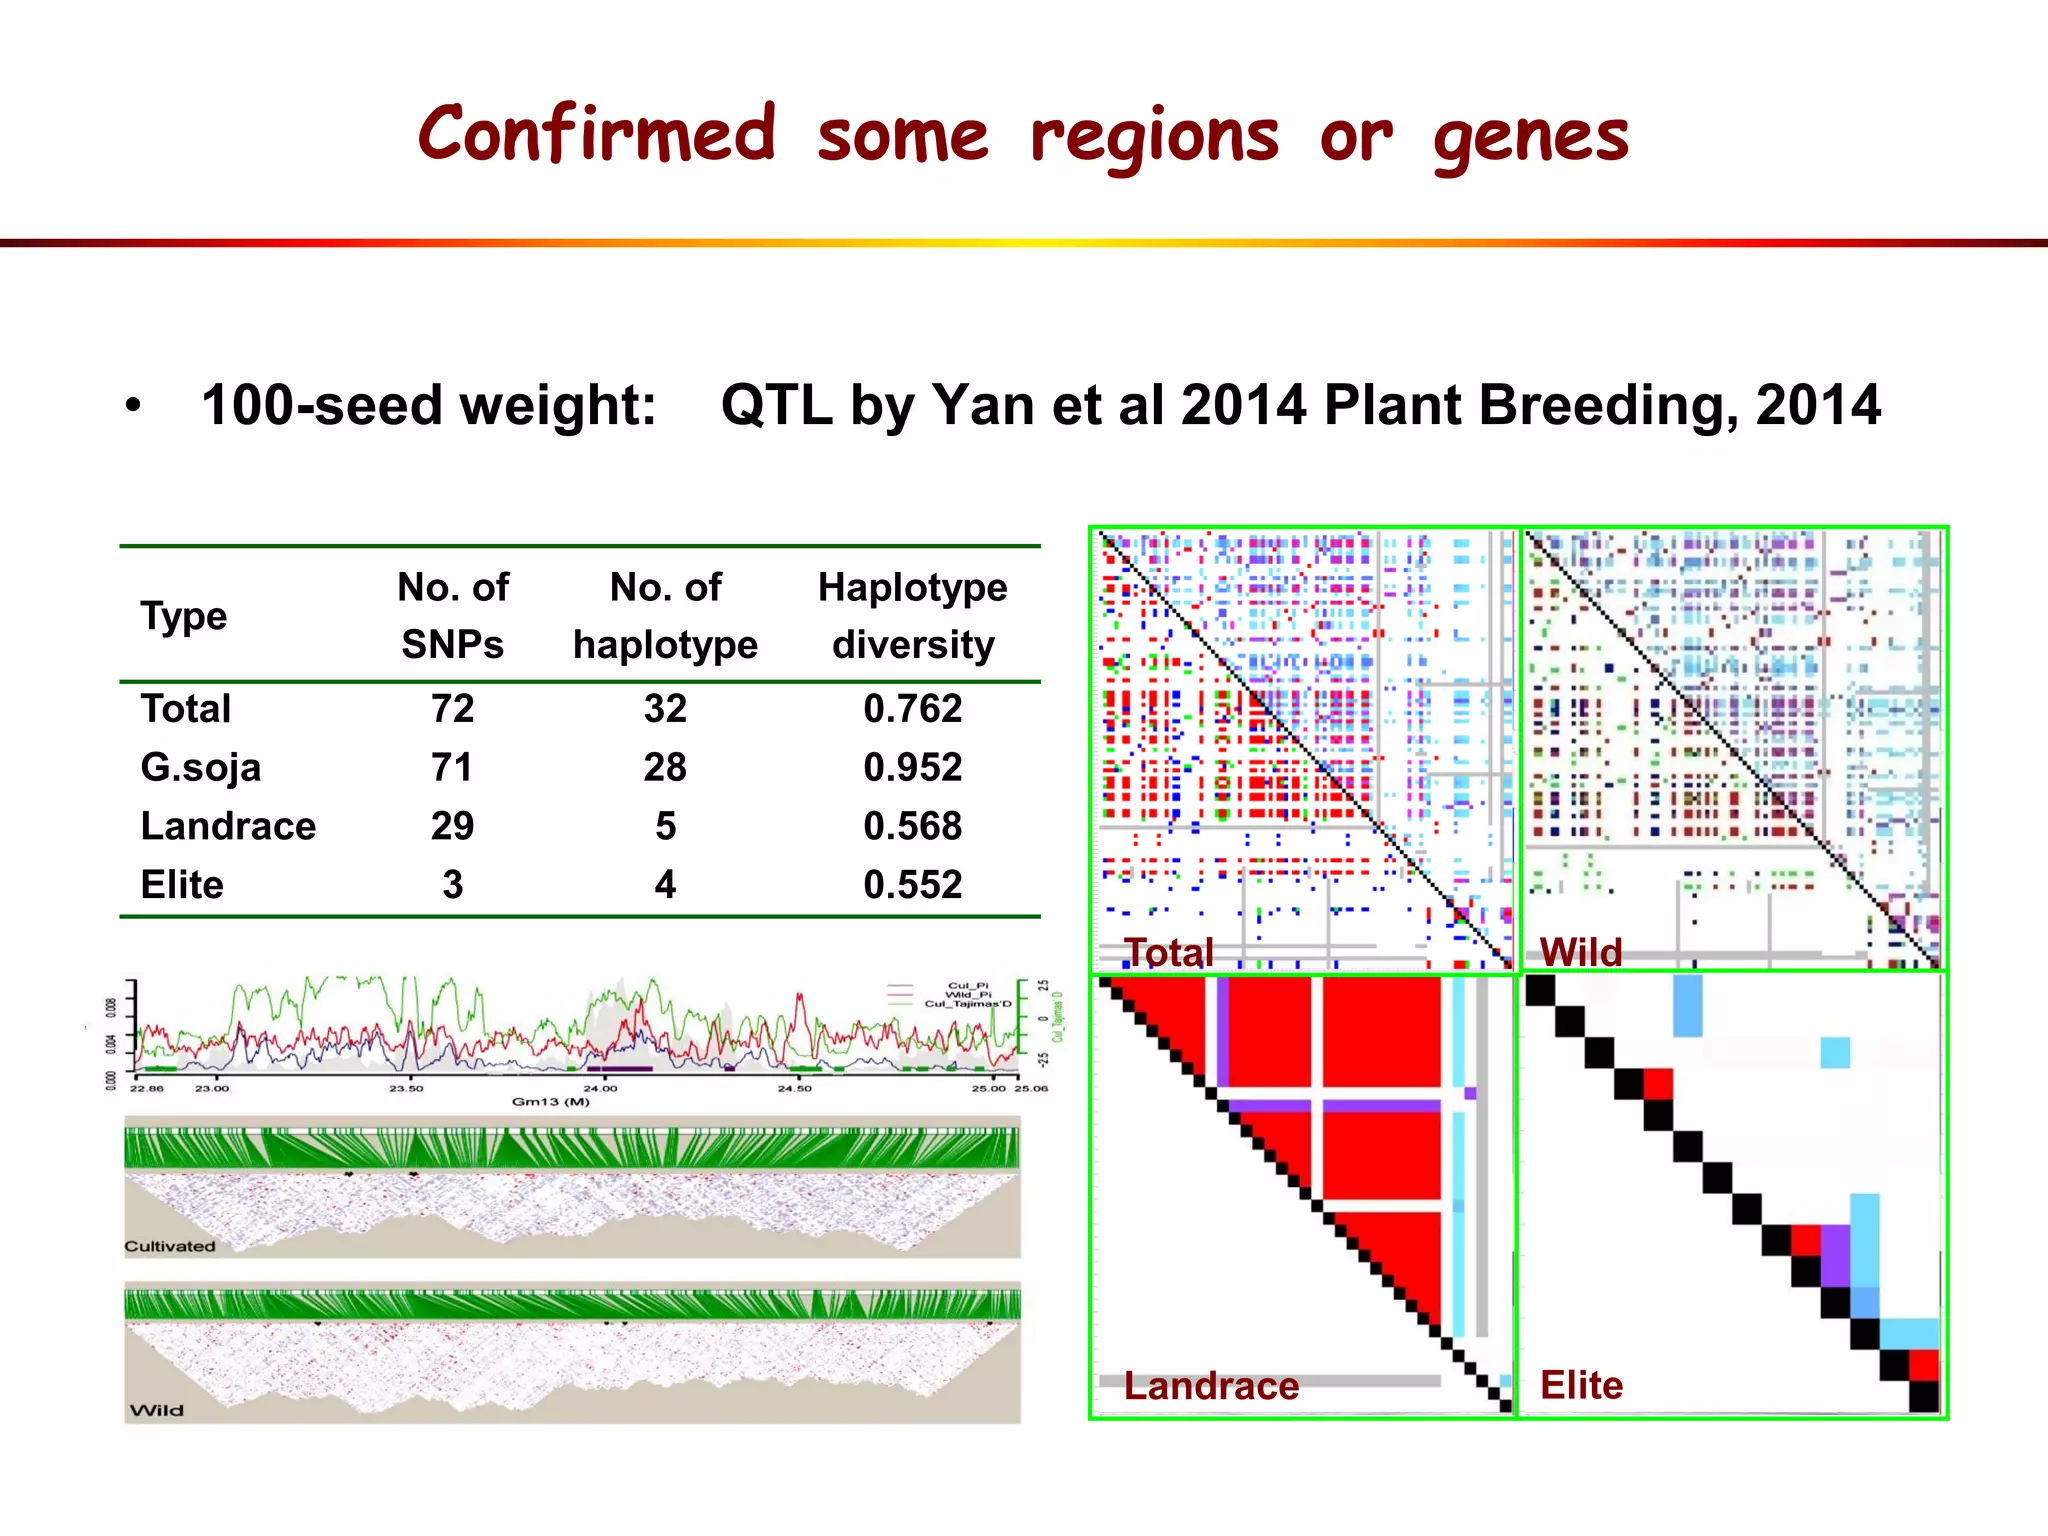
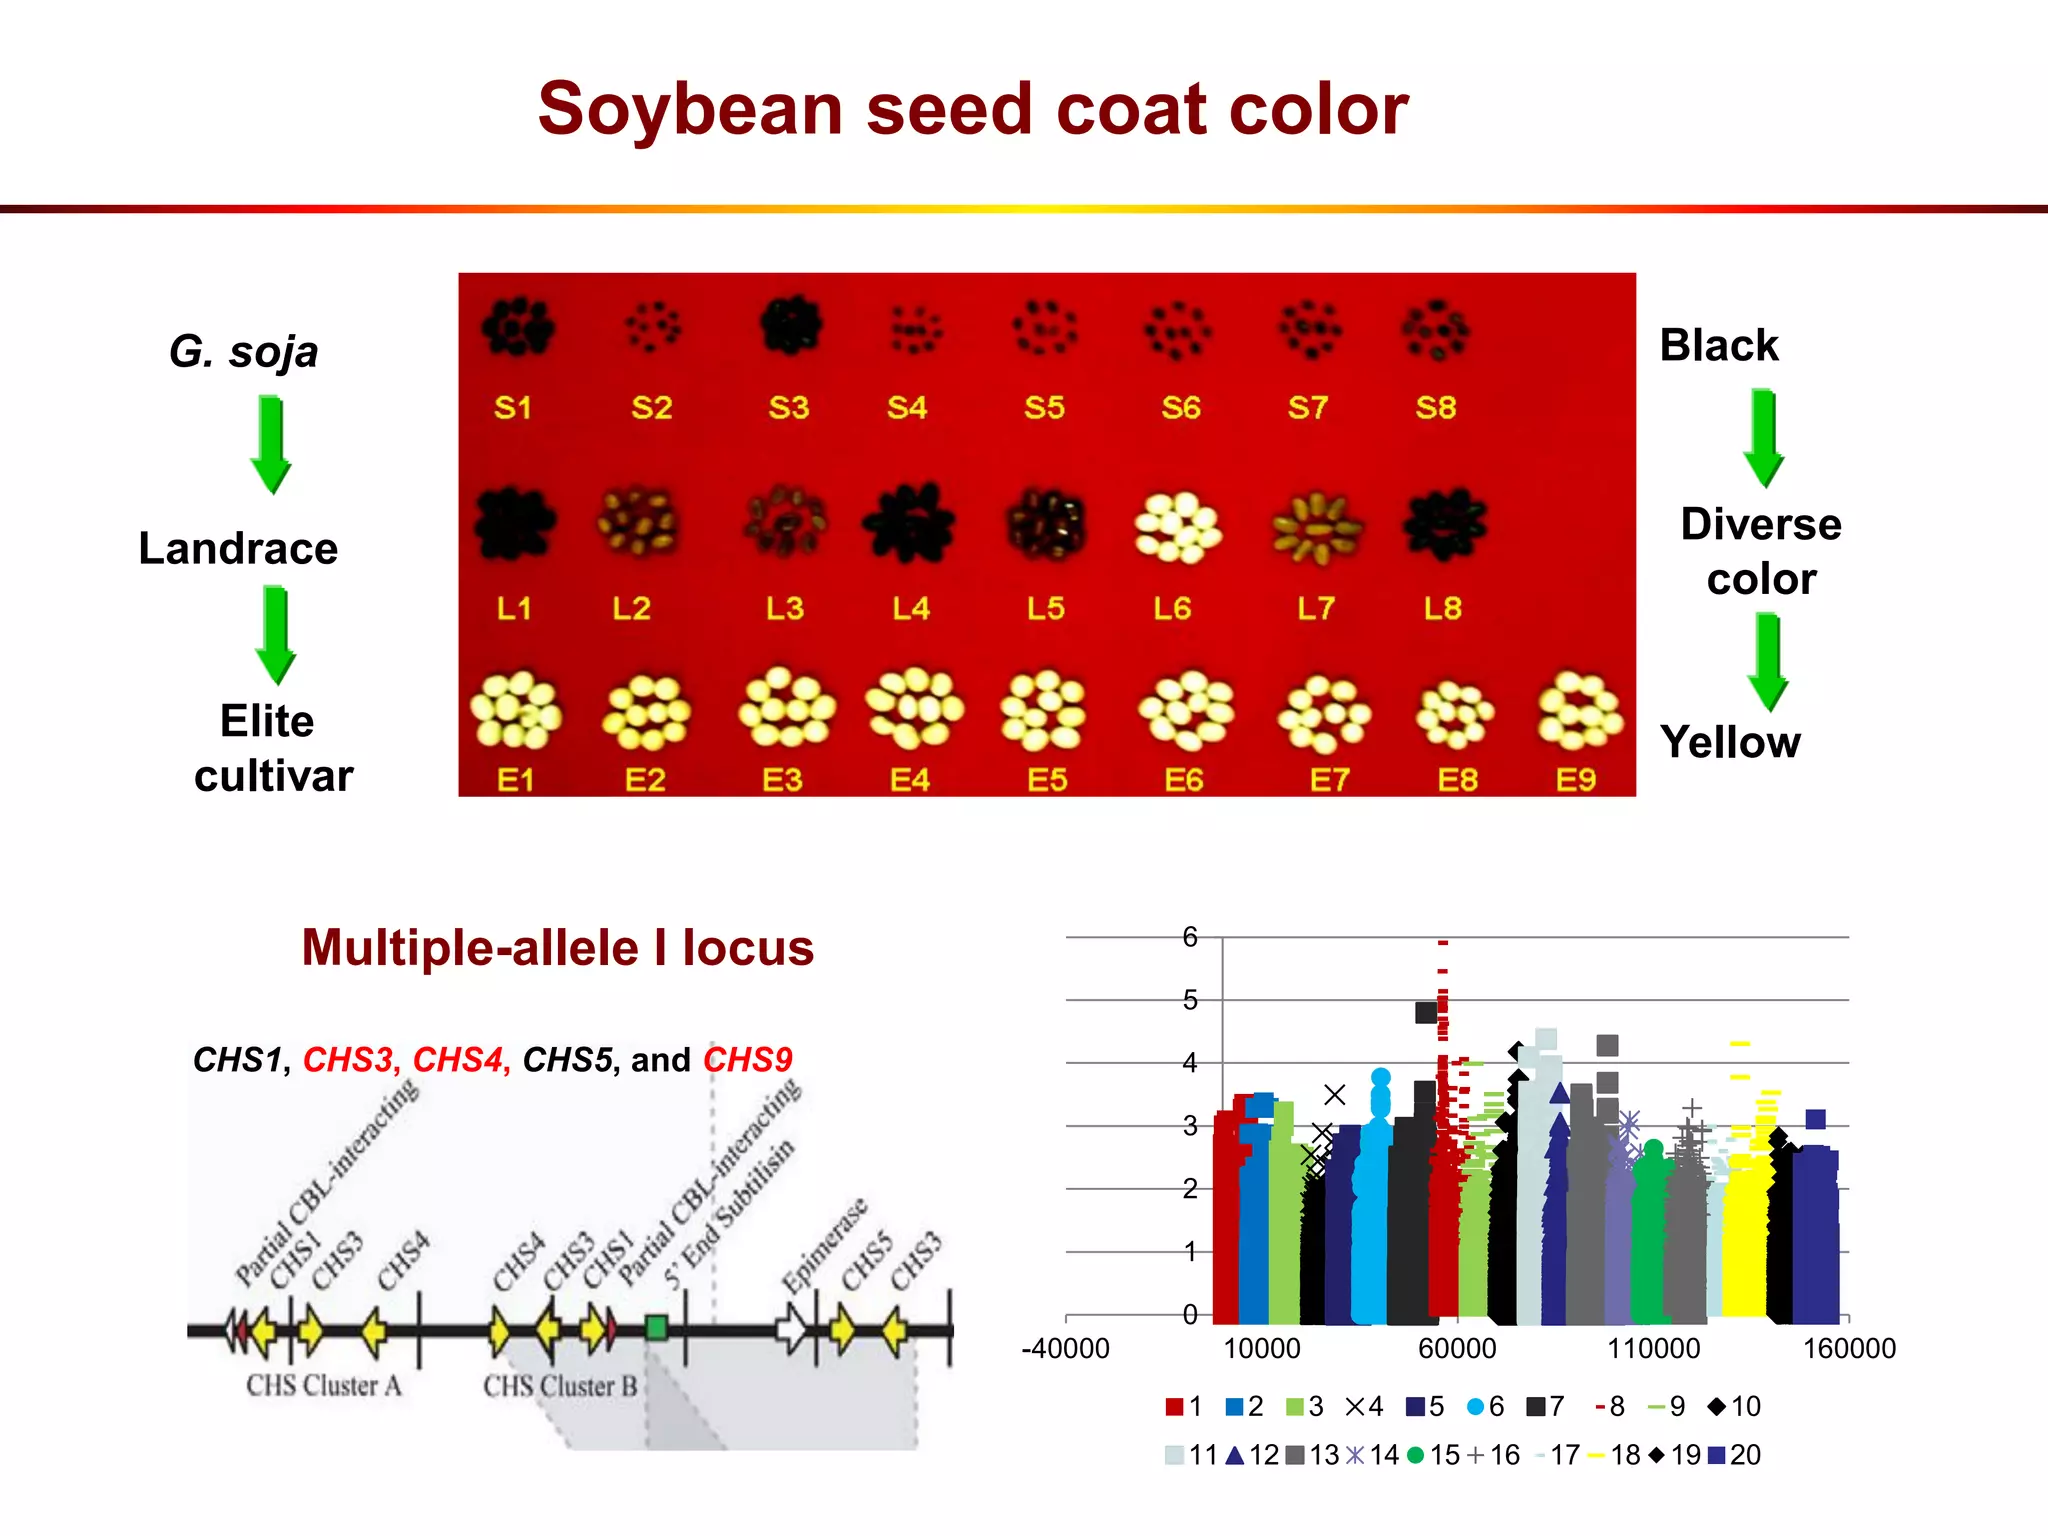
Genomic diversity of domestication in soybean
Institute of Crop Science
Chinese Academy of Agricultural Sciences
Li-juan Qiu
International Workshop on “Applied Mathematics and Omics Technologies for
Discovering Biodiversity and Genetic Resources for Climate Change Mitigation
and Adaptation to Sustain Agriculture in Drylands”
IAV Hassan II – Rabat - Morocco, 24-27 June 2014
1. Background
2. Genetic diversity of G. soja and G. max
3. Pan-genome of G. soja
4. Genomic variation between G. sojas and GmaxW82
5. Selection genes during domestication
Outline
Glycine
Soja
Glycine 26 perenial wild species (mainly in Australia)
Annual wild soybean (G.soja) (East Asia)
Cultivated soybean (G. max) (Worldwide)
Leguminosea, Papilollateae, Glycine
1. Background
G. soja
G. max
Landrace
G. max
Modern Cultivars
Domestication
Improvement
Glycine soja - the wild relative of cultivated
soybean G. max
S econdary G ene Pool
GP-2
unknown
Tertiary Gene Pool
GP-3
Wild perennial species
Tertiary Gene Pool
GP-3
Wild perennial species
From: Harlan and deWet (1971)
Two bottlenecks: domestication and breeding
G. soja
G. max vs G. soja
 Plant
— Plant height
— Growth habit
 Seed
— Size
— Color
— Pod dehiscence
 Physiological
trait
— Protein content
— Oil content Modern cultivar
Genetic variation controlled the difference
 The variation of soybean genome during domestication
Genetic variation, e.g. SNP, InDel, PAV, CNV
Domestication trait related gene
The genetic variation between
wild and cultivated soybean
?
Domestication related traits
The genetic variation between
wild and cultivated soybean
?
Domestication related traits
 The history of soybean cultivation are more than
4500 years since agricultural ancestor Houji, who
planted five crops including soybean.
 According to word record, the earlist name of
soybean was “shu” in “The Book of Odes”.
 The other languages of soybean in the world are
was translated from the “shu”.
Cultivated soybean is native to China
China owns the most of soybean germplasms
 More than 170,000 soybean accessions are in germplasm
collections. Among them, 45,000 accessions are unique
(Carter et al. 2004)
 More than 23,000 cultivated and 7,000 soybean accessions
are conserved in Chinese National Gene bank (CNGB).
Constructing different level of core collections
Qiu et al 2003,Scientia Agricultura Sinics; Qiu et al 2009, PMB 2013
Core collection: represent the genetic diversity of a crop species
and its relatives with a minimum of repetitiveness
Primary
core
collection
Basic
collection
Core
collection
AAAABBBB
CCCCDDDDEEEE
FFFGGGHHH
AABB
CCDDEE
FFGGHHH
ABCEFGH
Primary core collection
(2794)
Basic collection
(23587)
Location
Phenotype
Phenotype
Genotype
Core collection
in the different level
(248; 433…)
Methods
Methods
Primary
core
collection
Basic
collection
Core
collection
AAAABBBB
CCCCDDDDEEEE
FFFGGGHHH
AABB
CCDDEE
FFGGHHH
ABCEFGH
AAAABBBB
CCCCDDDDEEEE
FFFGGGHHH
AABB
CCDDEE
FFGGHHH
ABCEFGH
Primary core collection
(2794)
Basic collection
(23587)
Location
Phenotype
Phenotype
Genotype
Core collection
in the different level
(248; 433…)
Methods
Methods
Primary core collection
(2794)
Basic collection
(23587)
Location
Phenotype
Phenotype
Genotype
Core collection
in the different level
(248; 433…)
Methods
Methods
 The primary division of genetic diversity was between the
wild and domesticated accessions.
 G. soja and G. max represent distinct germplasm pools.
B
A
G.max G.soja G.max G.soja G.max G.soja
K=2
K=3
K=4
K=5
K=6
K=2
K=3
K=4
K=5
K=6
B
A
G.max G.soja G.max G.soja G.max G.soja
K=2
K=3
K=4
K=5
K=6
K=2
K=3
K=4
K=5
K=6
A
G.max G.soja G.max G.soja G.max G.soja
K=2
K=3
K=4
K=5
K=6
K=2
K=3
K=4
K=5
K=6
2. Differentiation between G.soja and G. max
S HH N NE Russia Korea Japa
n
99 SSR
554 SNP
SSR+SNP
S HH N NE Russia Korea Japa
n
S HH N NE Russia Korea Japa
n
99 SSR
554 SNP
SSR+SNP
Li et al. New Phytologist, 2010; Li et al. Theor Appl Genet, 2008
1863 landraces; 59 SSR 112 wild soybean; 99 SSR, 554 SNP
 Population structure within species is accordance with
geographic origin in cultivated and wild soybeans respectively
Genetic diversity was remarkable decreased
after domestication
Li et al. (2010) New Phytologist
Cultivated
Wild
Hyten et al. (2006) PNAS
 Accessions:
26 G. soja
94 G. max
 Molecular data:
111 fragments from 102 genes
 Accessions:
92 G. soja
279 G. max
 Molecular data:
554 SNP markers
99 SSR markers
1807
Wild
0.871
1473
Cultivated
0.68778.3%
81.5%
From Schmutz et al., Nature 2010; 463:178-183
The development of
sequencing technique
Cultivated soybean reference genome
Gmax W82
As an important source of genetic diversity, gene
repertoire in G. soja remains largely unexplored
 Pan-genome: The set of all genes present in the
genomes of a group of organisms
3. Pan-genome of G. soja
From: Morgante et al. Current Opinion in Plant Biology 10, 149-155 (2007)
 Core genome: shared among individuals.
 Dispensable genome: an individual-specific or partially-shared
among individuals.
Why pan-genome ?
Li et al. New Phytologist, 2010
 The largest component of variation (~75%) was among
individuals within population
 A single genome sequence might not reflect the entire genomic
complement of a species
AMOVA
0.0
0.1
0.2
0.3
0.4
0.5
0.6
0.7
0.8
0.9
1.0
1 3 5 7 9 11 13 15 17 19 21 23 25 27 29 31 33 35 37 39 41 43 45 47 49 51 53 55 57 59 61 63 65 67 69 71 73 75 77 79 81 83 85 87 89 91
GsojaC GsojaB GsojaA GsojaG GsojaE GsojaD
 Seven representative wild soybean (New Phytologist, 2010)
 China: Northeast, North,
Huanghuai and South regions
 Other countries:
Japan, Korea, Russia
 Three libraries:
180bp, 500bp, 2kbp
 Data
817Gb, 111.9 X in average
Pan-genome of annual wild soybean
ID GsojaA GsojaB GsojaC GsojaD GsojaE GsojaF GsojaG
Predicated
genome size (Mbp)
981.0 1000.8 1053.78 1118.34 956.43 992.66 889.33
Assembled
geneome
size(Mbp)
813 895 841 985 920 886 878
Contig N50 (Kbp)* 9 22.2 8 11 27 24.3 19.2
Scaffold N50 (Kbp) 18.3 57.2 17 48.7 65.1 52.4 44.9
No. of genes
predicated
58,756 56,655 60,377 62,048 58,414 57,573 58,169
No. of genes
confirmed
55,061 54,256 56,542 57,631 55,901 54,805 54,797
 Number of predicated genes: average 55,570 genes/ genome
 RNA-Seq validation: 67.3% of predicated genes
Summary of data and assembly
The pan-genome is dynamic and a single genome does not
adequately represent the diversity of the species
 The number of total genes
increased as additional
genomes were added and
the no of core genes
decreased
 The average pan-genome
size of any two accessions
accounted for 78.2% of that
found using all seven
accessions
 Pan-genome
Core: 48.6% of genes and 80.1% of genome sequence
Dispensable: 51.4% of genes and 19.9% of genome sequence
59,080 genes Genome size: 986.3 Mbp
Pan-genome of annual wild soybean
8.86/kb
19.93/kb
 The dispensable gene set was more variable than the core
gene set, both structurally and functionally.
 The dispensable genes have experienced weaker purifying
selection and evolved more quickly than core genes
Core genome vs. dispensable genome
 58.3% of the dispensable could not be assigned any
functional annotation versus 33.9% for the core genes set.
 95.5% of core genes had homologs in other species
based on blast searches to 32 plant genomes (excluding
soybean), significantly more than the dispensable gene
set (83.5%, chi-square test, p< 0.01).
lineage-specific genes evolved faster than genes that were
shared between species, either via a higher evolutionary rate
or a higher gene loss rate
Core genes were more functionally conservative
among plant species than dispensable genes
Evolution of the G. max /G. soja species complex
 G. soja diverged from G. max more than 0.8 mya
 Nearly 3 times older than a previous estimate of 0.27 mya
based on re-sequencing of a single G. soja genome
670 conserved single-copy
gene orthologs
4.Genomic variation between G. soja and GmaxW82
 SNPs: 3.63~4.72 million
 Indels: 0.50~0.77 million
 Structure var: CNV, PAV
Thousands of genes
affected by above
variations, some of
which may be useful for
future crop improvement.
G.soja vs G.max: Genomic basis of agronomic traits
photosensing and light signaling coordinately
controlsling
flowering
Two 3nt-indel and 9 non-synonymous
SNP; two variation hotpots
photosensing and light signaling coordinately
controlsling
flowering
Two 3nt-indel and 9 non-synonymous
SNP; two variation hotpots
G. max
G. soja
Re-sequencing*
1 G.soja+1 G.max
Re-sequencing #
25 G.soja+30 G.max
De novo sequencing
7 G.soja+1 G.max
?712???19.6M?250M
33816117972615M85M480M510M
?????70M?510M
?712???19.6M?250M
33816117972615M85M480M510M
?????70M?510M
#: From Li et al. BMC Genomics, 2013; *: FromKim et al. PNAS, 2010
G.soja-
specific
G.max-
specific
CNV-lossCNV-gainLarge
InDel
(5-100bp)
Small
InDel
(1-5bp)
SNP missed
in Re-seq
SNP G.soja-
specific
G.max-
specific
CNV-lossCNV-gainLarge
InDel
(5-100bp)
Small
InDel
(1-5bp)
SNP missed
in Re-seq
SNP
Specific variations identified in this comparison
 9 SNPs in a 62bp fragment
More SNPs were found by assembly-based method
 10 million SNPs, two time of SNPs identified by re-sequencing
(Li et al. BMC Genomics, 2013)
New SNP mostly from divergent regions where assembled
sequences could be aligned and short sequencing reads are
difficult to be mapped
 Copy number variation: 1978 genes
1179 loss
726 gain
73 gain and loss
Category: G. soja > G.max
Number: G. max > G. soja
R genes
>100 bp and <95% identity
PAV sequence: 30.3 Mb
G. soja specific: 11.3 Mb
G. max specific: 19 Mbp
PAV gene:354
G. soja specific: 338
G. max specific:16
 PAV: 24.3% of involved
in defense response
 Gs1-3: biotic and abiotic
stress tolerance or plant
development
 56 resequencing
accession: frequency G.
soja> G. max
Gs1 Gs2 Gs3
8kb
Wild
Culitvated
1
2
3
4
5
1
2
3
4
5
 Population bottleneck or artificial selection will result in the fixation
of alleles during domestication
5. Selection genes during domestication
G. Soja
Landrace
Elite cultivar
25 accessions 93.55Gb 98.2%Glyma1.01
 31 accessions (Lam et al. 2010)
17 G. soja
14 G. max
 25 accessions
Total: 5,102,244 SNPs
Special: 25.5%
specific to our accessionsspecific to our accessions
Li et al. BMC Genomics, 2013
0
10
20
30
40
50
60
G
m
01G
m
02G
m
03G
m
04G
m
05G
m
06G
m
07G
m
08G
m
09G
m
10G
m
11G
m
12G
m
13G
m
14G
m
15G
m
16G
m
17G
m
18G
m
19G
m
20
0
20
40
60
80
100
120
140
No. of region No. of genes
No.ofregions
No.ofgenes
 394 regions: 1.47% of the whole genome (950M)
 928 genes: 2.0% of 46,430 predicted genes
 θπ(cultivated/wild) , Tajima’s D values, FST
 20 Kb sliding window (2Kb step-size).
Artificial Selection
 The distribution of selection regions were not random or even
uniform throughout the genome
 Appeared to be apparent clusters in certain genomic regions
Gm08
Gm12
Similar to the distribution pattern of QTLs underlying domestication
related traits (Ross-Ibarra, Genetics of Adaptation, 2005)
A homolog of the domestication gene Grain Incomplete Filling 1
(GIF1) in rice
 GIF1 encodes cell-wall invertase that regulates sugar levels
to meet with the demands of cell division and growth during
the grain development.
 Increased grain size and weight in transgenic rice
From: Wang et al. Nat Genet, 2008
Selection gene: Glyma03g35520.1
 GmTfl1 (Glyma19g37890.1): Tian et al. 2010; Liu et al. 2010
gDNA cDNA
θ π θ π
GmTfl1 Glyma19g37890.1
Elite cultivars 1.86 0.98 0.98 0.52
Landraces 1.78 1.05 1.78 1.61
G. soja 1.65 1.28 0 0
Glyma03g35250.1
G. max (89) 0 0 0 0
Elite cultivars 0 0 0 0
Landraces 0 0 0 0
G. soja (20) 0.66 0.73 0.85 0.54
 The homolog of Glyma03g35250.1 in sunflower experienced
selective sweeps during evolution (From Blackman et al. 2011).
Selection gene: Glyma03g35250.1
Confirmed some regions or genes
• 100-seed weight: QTL by Yan et al 2014 Plant Breeding, 2014
Type
No. of
SNPs
No. of
haplotype
Haplotype
diversity
Total 72 32 0.762
G.soja 71 28 0.952
Landrace 29 5 0.568
Elite 3 4 0.552
Total Wild
Landrace Elite
Black
Diverse
color
Yellow
G. soja
Landrace
Elite
cultivar
CHS1, CHS3, CHS4, CHS5, and CHS9
Multiple-allele I locus
Soybean seed coat color
0
1
2
3
4
5
6
-40000 10000 60000 110000 160000
1 2 3 4 5 6 7 8 9 10
11 12 13 14 15 16 17 18 19 20
 The hierarchical genetic structure of soybean landraces was
reflected with the geographic region.
 A pan-genome was constructed by de novo sequencing and
assembling seven G. soja accessions.
 Inter-genomic comparisons identified up to 3,000 lineage-
specific genes and genes with CNV, PAV or large-effect
mutations, some of which may contribute to variation of
agronomic traits such as resistance, seed composition,
flowering time, biomass etc.
 A set of candidate genes significantly affected by selection for
preferred agricultural traits underlying soybean domestication
were identified and some genes were confirmed.
 These results will facilitate the harnessing of untapped genetic
diversity from wild soybean for developing elite cultivars.
Summary
Funding:
National Natural Science Foundation of China State Key Basic Research
and Development Plan of China (973)
National Key Technologies R&D Program in the 11th Five-Year Plan (863)
Acknowledgments
Novogene
Prof. Ruiqiang Li
Guangyu Zhou
Wenkai Jiang
Zhouhuao Zhang
University of Georgia
Prof. Scott A. Jackson
Purdue University
Dr. Jianxin Ma

THEME – 4 Genomic diversity of domestication in soybean

  • 1.
    Genomic diversity ofdomestication in soybean Institute of Crop Science Chinese Academy of Agricultural Sciences Li-juan Qiu International Workshop on “Applied Mathematics and Omics Technologies for Discovering Biodiversity and Genetic Resources for Climate Change Mitigation and Adaptation to Sustain Agriculture in Drylands” IAV Hassan II – Rabat - Morocco, 24-27 June 2014
  • 2.
    1. Background 2. Geneticdiversity of G. soja and G. max 3. Pan-genome of G. soja 4. Genomic variation between G. sojas and GmaxW82 5. Selection genes during domestication Outline
  • 3.
    Glycine Soja Glycine 26 perenialwild species (mainly in Australia) Annual wild soybean (G.soja) (East Asia) Cultivated soybean (G. max) (Worldwide) Leguminosea, Papilollateae, Glycine 1. Background
  • 4.
    G. soja G. max Landrace G.max Modern Cultivars Domestication Improvement Glycine soja - the wild relative of cultivated soybean G. max S econdary G ene Pool GP-2 unknown Tertiary Gene Pool GP-3 Wild perennial species Tertiary Gene Pool GP-3 Wild perennial species From: Harlan and deWet (1971) Two bottlenecks: domestication and breeding
  • 5.
    G. soja G. maxvs G. soja  Plant — Plant height — Growth habit  Seed — Size — Color — Pod dehiscence  Physiological trait — Protein content — Oil content Modern cultivar
  • 6.
    Genetic variation controlledthe difference  The variation of soybean genome during domestication Genetic variation, e.g. SNP, InDel, PAV, CNV Domestication trait related gene The genetic variation between wild and cultivated soybean ? Domestication related traits The genetic variation between wild and cultivated soybean ? Domestication related traits
  • 7.
     The historyof soybean cultivation are more than 4500 years since agricultural ancestor Houji, who planted five crops including soybean.  According to word record, the earlist name of soybean was “shu” in “The Book of Odes”.  The other languages of soybean in the world are was translated from the “shu”. Cultivated soybean is native to China
  • 8.
    China owns themost of soybean germplasms  More than 170,000 soybean accessions are in germplasm collections. Among them, 45,000 accessions are unique (Carter et al. 2004)  More than 23,000 cultivated and 7,000 soybean accessions are conserved in Chinese National Gene bank (CNGB).
  • 9.
    Constructing different levelof core collections Qiu et al 2003,Scientia Agricultura Sinics; Qiu et al 2009, PMB 2013 Core collection: represent the genetic diversity of a crop species and its relatives with a minimum of repetitiveness Primary core collection Basic collection Core collection AAAABBBB CCCCDDDDEEEE FFFGGGHHH AABB CCDDEE FFGGHHH ABCEFGH Primary core collection (2794) Basic collection (23587) Location Phenotype Phenotype Genotype Core collection in the different level (248; 433…) Methods Methods Primary core collection Basic collection Core collection AAAABBBB CCCCDDDDEEEE FFFGGGHHH AABB CCDDEE FFGGHHH ABCEFGH AAAABBBB CCCCDDDDEEEE FFFGGGHHH AABB CCDDEE FFGGHHH ABCEFGH Primary core collection (2794) Basic collection (23587) Location Phenotype Phenotype Genotype Core collection in the different level (248; 433…) Methods Methods Primary core collection (2794) Basic collection (23587) Location Phenotype Phenotype Genotype Core collection in the different level (248; 433…) Methods Methods
  • 10.
     The primarydivision of genetic diversity was between the wild and domesticated accessions.  G. soja and G. max represent distinct germplasm pools. B A G.max G.soja G.max G.soja G.max G.soja K=2 K=3 K=4 K=5 K=6 K=2 K=3 K=4 K=5 K=6 B A G.max G.soja G.max G.soja G.max G.soja K=2 K=3 K=4 K=5 K=6 K=2 K=3 K=4 K=5 K=6 A G.max G.soja G.max G.soja G.max G.soja K=2 K=3 K=4 K=5 K=6 K=2 K=3 K=4 K=5 K=6 2. Differentiation between G.soja and G. max S HH N NE Russia Korea Japa n 99 SSR 554 SNP SSR+SNP S HH N NE Russia Korea Japa n S HH N NE Russia Korea Japa n 99 SSR 554 SNP SSR+SNP Li et al. New Phytologist, 2010; Li et al. Theor Appl Genet, 2008 1863 landraces; 59 SSR 112 wild soybean; 99 SSR, 554 SNP  Population structure within species is accordance with geographic origin in cultivated and wild soybeans respectively
  • 11.
    Genetic diversity wasremarkable decreased after domestication Li et al. (2010) New Phytologist Cultivated Wild Hyten et al. (2006) PNAS  Accessions: 26 G. soja 94 G. max  Molecular data: 111 fragments from 102 genes  Accessions: 92 G. soja 279 G. max  Molecular data: 554 SNP markers 99 SSR markers 1807 Wild 0.871 1473 Cultivated 0.68778.3% 81.5%
  • 12.
    From Schmutz etal., Nature 2010; 463:178-183 The development of sequencing technique Cultivated soybean reference genome Gmax W82 As an important source of genetic diversity, gene repertoire in G. soja remains largely unexplored
  • 13.
     Pan-genome: Theset of all genes present in the genomes of a group of organisms 3. Pan-genome of G. soja From: Morgante et al. Current Opinion in Plant Biology 10, 149-155 (2007)  Core genome: shared among individuals.  Dispensable genome: an individual-specific or partially-shared among individuals.
  • 14.
    Why pan-genome ? Liet al. New Phytologist, 2010  The largest component of variation (~75%) was among individuals within population  A single genome sequence might not reflect the entire genomic complement of a species AMOVA
  • 15.
    0.0 0.1 0.2 0.3 0.4 0.5 0.6 0.7 0.8 0.9 1.0 1 3 57 9 11 13 15 17 19 21 23 25 27 29 31 33 35 37 39 41 43 45 47 49 51 53 55 57 59 61 63 65 67 69 71 73 75 77 79 81 83 85 87 89 91 GsojaC GsojaB GsojaA GsojaG GsojaE GsojaD  Seven representative wild soybean (New Phytologist, 2010)  China: Northeast, North, Huanghuai and South regions  Other countries: Japan, Korea, Russia  Three libraries: 180bp, 500bp, 2kbp  Data 817Gb, 111.9 X in average Pan-genome of annual wild soybean
  • 16.
    ID GsojaA GsojaBGsojaC GsojaD GsojaE GsojaF GsojaG Predicated genome size (Mbp) 981.0 1000.8 1053.78 1118.34 956.43 992.66 889.33 Assembled geneome size(Mbp) 813 895 841 985 920 886 878 Contig N50 (Kbp)* 9 22.2 8 11 27 24.3 19.2 Scaffold N50 (Kbp) 18.3 57.2 17 48.7 65.1 52.4 44.9 No. of genes predicated 58,756 56,655 60,377 62,048 58,414 57,573 58,169 No. of genes confirmed 55,061 54,256 56,542 57,631 55,901 54,805 54,797  Number of predicated genes: average 55,570 genes/ genome  RNA-Seq validation: 67.3% of predicated genes Summary of data and assembly
  • 17.
    The pan-genome isdynamic and a single genome does not adequately represent the diversity of the species  The number of total genes increased as additional genomes were added and the no of core genes decreased  The average pan-genome size of any two accessions accounted for 78.2% of that found using all seven accessions
  • 18.
     Pan-genome Core: 48.6%of genes and 80.1% of genome sequence Dispensable: 51.4% of genes and 19.9% of genome sequence 59,080 genes Genome size: 986.3 Mbp Pan-genome of annual wild soybean
  • 19.
    8.86/kb 19.93/kb  The dispensablegene set was more variable than the core gene set, both structurally and functionally.  The dispensable genes have experienced weaker purifying selection and evolved more quickly than core genes Core genome vs. dispensable genome
  • 20.
     58.3% ofthe dispensable could not be assigned any functional annotation versus 33.9% for the core genes set.  95.5% of core genes had homologs in other species based on blast searches to 32 plant genomes (excluding soybean), significantly more than the dispensable gene set (83.5%, chi-square test, p< 0.01). lineage-specific genes evolved faster than genes that were shared between species, either via a higher evolutionary rate or a higher gene loss rate Core genes were more functionally conservative among plant species than dispensable genes
  • 21.
    Evolution of theG. max /G. soja species complex  G. soja diverged from G. max more than 0.8 mya  Nearly 3 times older than a previous estimate of 0.27 mya based on re-sequencing of a single G. soja genome 670 conserved single-copy gene orthologs
  • 22.
    4.Genomic variation betweenG. soja and GmaxW82  SNPs: 3.63~4.72 million  Indels: 0.50~0.77 million  Structure var: CNV, PAV Thousands of genes affected by above variations, some of which may be useful for future crop improvement.
  • 23.
    G.soja vs G.max:Genomic basis of agronomic traits photosensing and light signaling coordinately controlsling flowering Two 3nt-indel and 9 non-synonymous SNP; two variation hotpots photosensing and light signaling coordinately controlsling flowering Two 3nt-indel and 9 non-synonymous SNP; two variation hotpots
  • 24.
    G. max G. soja Re-sequencing* 1G.soja+1 G.max Re-sequencing # 25 G.soja+30 G.max De novo sequencing 7 G.soja+1 G.max ?712???19.6M?250M 33816117972615M85M480M510M ?????70M?510M ?712???19.6M?250M 33816117972615M85M480M510M ?????70M?510M #: From Li et al. BMC Genomics, 2013; *: FromKim et al. PNAS, 2010 G.soja- specific G.max- specific CNV-lossCNV-gainLarge InDel (5-100bp) Small InDel (1-5bp) SNP missed in Re-seq SNP G.soja- specific G.max- specific CNV-lossCNV-gainLarge InDel (5-100bp) Small InDel (1-5bp) SNP missed in Re-seq SNP Specific variations identified in this comparison
  • 25.
     9 SNPsin a 62bp fragment More SNPs were found by assembly-based method  10 million SNPs, two time of SNPs identified by re-sequencing (Li et al. BMC Genomics, 2013) New SNP mostly from divergent regions where assembled sequences could be aligned and short sequencing reads are difficult to be mapped
  • 26.
     Copy numbervariation: 1978 genes 1179 loss 726 gain 73 gain and loss Category: G. soja > G.max Number: G. max > G. soja R genes
  • 27.
    >100 bp and<95% identity PAV sequence: 30.3 Mb G. soja specific: 11.3 Mb G. max specific: 19 Mbp PAV gene:354 G. soja specific: 338 G. max specific:16
  • 28.
     PAV: 24.3%of involved in defense response  Gs1-3: biotic and abiotic stress tolerance or plant development  56 resequencing accession: frequency G. soja> G. max Gs1 Gs2 Gs3 8kb
  • 29.
    Wild Culitvated 1 2 3 4 5 1 2 3 4 5  Population bottleneckor artificial selection will result in the fixation of alleles during domestication 5. Selection genes during domestication
  • 30.
    G. Soja Landrace Elite cultivar 25accessions 93.55Gb 98.2%Glyma1.01  31 accessions (Lam et al. 2010) 17 G. soja 14 G. max  25 accessions Total: 5,102,244 SNPs Special: 25.5% specific to our accessionsspecific to our accessions Li et al. BMC Genomics, 2013
  • 31.
    0 10 20 30 40 50 60 G m 01G m 02G m 03G m 04G m 05G m 06G m 07G m 08G m 09G m 10G m 11G m 12G m 13G m 14G m 15G m 16G m 17G m 18G m 19G m 20 0 20 40 60 80 100 120 140 No. of regionNo. of genes No.ofregions No.ofgenes  394 regions: 1.47% of the whole genome (950M)  928 genes: 2.0% of 46,430 predicted genes  θπ(cultivated/wild) , Tajima’s D values, FST  20 Kb sliding window (2Kb step-size). Artificial Selection
  • 32.
     The distributionof selection regions were not random or even uniform throughout the genome  Appeared to be apparent clusters in certain genomic regions Gm08 Gm12 Similar to the distribution pattern of QTLs underlying domestication related traits (Ross-Ibarra, Genetics of Adaptation, 2005)
  • 33.
    A homolog ofthe domestication gene Grain Incomplete Filling 1 (GIF1) in rice  GIF1 encodes cell-wall invertase that regulates sugar levels to meet with the demands of cell division and growth during the grain development.  Increased grain size and weight in transgenic rice From: Wang et al. Nat Genet, 2008 Selection gene: Glyma03g35520.1
  • 34.
     GmTfl1 (Glyma19g37890.1):Tian et al. 2010; Liu et al. 2010 gDNA cDNA θ π θ π GmTfl1 Glyma19g37890.1 Elite cultivars 1.86 0.98 0.98 0.52 Landraces 1.78 1.05 1.78 1.61 G. soja 1.65 1.28 0 0 Glyma03g35250.1 G. max (89) 0 0 0 0 Elite cultivars 0 0 0 0 Landraces 0 0 0 0 G. soja (20) 0.66 0.73 0.85 0.54  The homolog of Glyma03g35250.1 in sunflower experienced selective sweeps during evolution (From Blackman et al. 2011). Selection gene: Glyma03g35250.1
  • 35.
    Confirmed some regionsor genes • 100-seed weight: QTL by Yan et al 2014 Plant Breeding, 2014 Type No. of SNPs No. of haplotype Haplotype diversity Total 72 32 0.762 G.soja 71 28 0.952 Landrace 29 5 0.568 Elite 3 4 0.552 Total Wild Landrace Elite
  • 36.
    Black Diverse color Yellow G. soja Landrace Elite cultivar CHS1, CHS3,CHS4, CHS5, and CHS9 Multiple-allele I locus Soybean seed coat color 0 1 2 3 4 5 6 -40000 10000 60000 110000 160000 1 2 3 4 5 6 7 8 9 10 11 12 13 14 15 16 17 18 19 20
  • 37.
     The hierarchicalgenetic structure of soybean landraces was reflected with the geographic region.  A pan-genome was constructed by de novo sequencing and assembling seven G. soja accessions.  Inter-genomic comparisons identified up to 3,000 lineage- specific genes and genes with CNV, PAV or large-effect mutations, some of which may contribute to variation of agronomic traits such as resistance, seed composition, flowering time, biomass etc.  A set of candidate genes significantly affected by selection for preferred agricultural traits underlying soybean domestication were identified and some genes were confirmed.  These results will facilitate the harnessing of untapped genetic diversity from wild soybean for developing elite cultivars. Summary
  • 38.
    Funding: National Natural ScienceFoundation of China State Key Basic Research and Development Plan of China (973) National Key Technologies R&D Program in the 11th Five-Year Plan (863) Acknowledgments Novogene Prof. Ruiqiang Li Guangyu Zhou Wenkai Jiang Zhouhuao Zhang University of Georgia Prof. Scott A. Jackson Purdue University Dr. Jianxin Ma