More Related Content
Similar to Farmers Branch TX - Housing Market Report - November 2010 (15)
More from Valarie Littles (17)
Farmers Branch TX - Housing Market Report - November 2010
- 1. Valarie Littles Ultima Real Estate
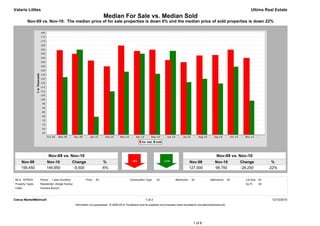
Median For Sale vs. Median Sold
Nov-09 vs. Nov-10: The median price of for sale properties is down 6% and the median price of sold properties is down 22%
Nov-09 vs. Nov-10 Nov-09 vs. Nov-10
Nov-09 Nov-10 Change % Nov-09 Nov-10 Change %
159,450 149,950 -9,500 -6% 127,000 98,750 -28,250 -22%
MLS: NTREIS Period: 1 year (monthly) Price: All Construction Type: All Bedrooms: All Bathrooms: All Lot Size: All
Property Types: Residential: (Single Family) Sq Ft: All
Cities: Farmers Branch
Clarus MarketMetrics® 1 of 2 12/12/2010
Information not guaranteed. © 2009-2010 Terradatum and its suppliers and licensors (www.terradatum.com/about/licensors.td).
1 of 6
- 2. Valarie Littles Ultima Real Estate
Median For Sale vs. Median Sold
Nov-09 vs. Nov-10: The median price of for sale properties is down 6% and the median price of sold properties is down 22%
For Sale # Properties Sold # Properties Price
Time Period Median For Sale Median Sold Difference
Nov-10 149,950 140 98,750 12 -51,199
Oct-10 159,900 139 139,500 13 -20,400
Sep-10 153,475 138 119,375 24 -34,100
Aug-10 152,900 149 125,000 15 -27,900
Jul-10 144,900 157 121,000 20 -23,900
Jun-10 147,500 149 158,500 23 11,000
May-10 159,900 137 131,000 22 -28,900
Apr-10 158,400 153 155,000 23 -3,400
Mar-10 164,900 135 133,500 16 -31,400
Feb-10 139,999 119 110,000 13 -29,999
Jan-10 146,900 122 79,500 9 -67,400
Dec-09 154,900 104 160,000 18 5,100
Nov-09 159,450 126 127,000 23 -32,450
Clarus MarketMetrics® 2 of 2 12/12/2010
Information not guaranteed. © 2009-2010 Terradatum and its suppliers and licensors (www.terradatum.com/about/licensors.td).
2 of 6
- 3. Valarie Littles Ultima Real Estate
Supply & Demand by Month
Nov-09 vs. Nov-10: The number of for sale properties is up 11% and the number of sold properties is down 48%
Nov-09 vs. Nov-10 Nov-09 vs. Nov-10
Nov-09 Nov-10 Change % Nov-09 Nov-10 Change %
126 140 14 +11% 23 12 -11 -48%
MLS: NTREIS Period: 1 year (monthly) Price: All Construction Type: All Bedrooms: All Bathrooms: All Lot Size: All
Property Types: Residential: (Single Family) Sq Ft: All
Cities: Farmers Branch
Clarus MarketMetrics® 1 of 2 12/12/2010
Information not guaranteed. © 2009-2010 Terradatum and its suppliers and licensors (www.terradatum.com/about/licensors.td).
3 of 6
- 4. Valarie Littles Ultima Real Estate
Supply & Demand by Month
Nov-09 vs. Nov-10: The number of for sale properties is up 11% and the number of sold properties is down 48%
# Properties Average DOM # Properties Average DOM
Time Period For Sale For Sale Sold Sold
Nov-10 140 118 12 56
Oct-10 139 140 13 70
Sep-10 138 154 24 59
Aug-10 149 155 15 50
Jul-10 157 153 20 44
Jun-10 149 163 23 100
May-10 137 172 22 59
Apr-10 153 159 23 90
Mar-10 135 170 16 43
Feb-10 119 183 13 90
Jan-10 122 184 9 97
Dec-09 104 196 18 92
Nov-09 126 190 23 75
Clarus MarketMetrics® 2 of 2 12/12/2010
Information not guaranteed. © 2009-2010 Terradatum and its suppliers and licensors (www.terradatum.com/about/licensors.td).
4 of 6
- 5. Valarie Littles Ultima Real Estate
Months Supply of Inventory
Nov-09 vs. Nov-10: The average months supply of inventory is up 8%
Nov-09 vs. Nov-10
Nov-09 Nov-10 Change %
6.2 6.7 0.5 +8%
MLS: NTREIS Period: 1 year (monthly) Price: All Construction Type: All Bedrooms: All Bathrooms: All Lot Size: All
Property Types: Residential: (Single Family) Sq Ft: All
Cities: Farmers Branch
Clarus MarketMetrics® 1 of 2 12/12/2010
Information not guaranteed. © 2009-2010 Terradatum and its suppliers and licensors (www.terradatum.com/about/licensors.td).
5 of 6
- 6. Valarie Littles Ultima Real Estate
Months Supply of Inventory
Nov-09 vs. Nov-10: The average months supply of inventory is up 8%
# Units For Sale # UC Units UC Average
Time Period Last Day of Month During Month MSI DOM
Nov-10 107 16 6.7 68
Oct-10 111 11 10.1 71
Sep-10 109 16 6.8 60
Aug-10 117 18 6.5 54
Jul-10 120 20 6.0 65
Jun-10 118 15 7.9 80
May-10 113 13 8.7 57
Apr-10 105 35 3.0 73
Mar-10 101 24 4.2 65
Feb-10 97 16 6.1 94
Jan-10 81 18 4.5 55
Dec-09 89 4 22.2 74
Nov-09 93 15 6.2 122
Clarus MarketMetrics® 2 of 2 12/12/2010
Information not guaranteed. © 2009-2010 Terradatum and its suppliers and licensors (www.terradatum.com/about/licensors.td).
6 of 6