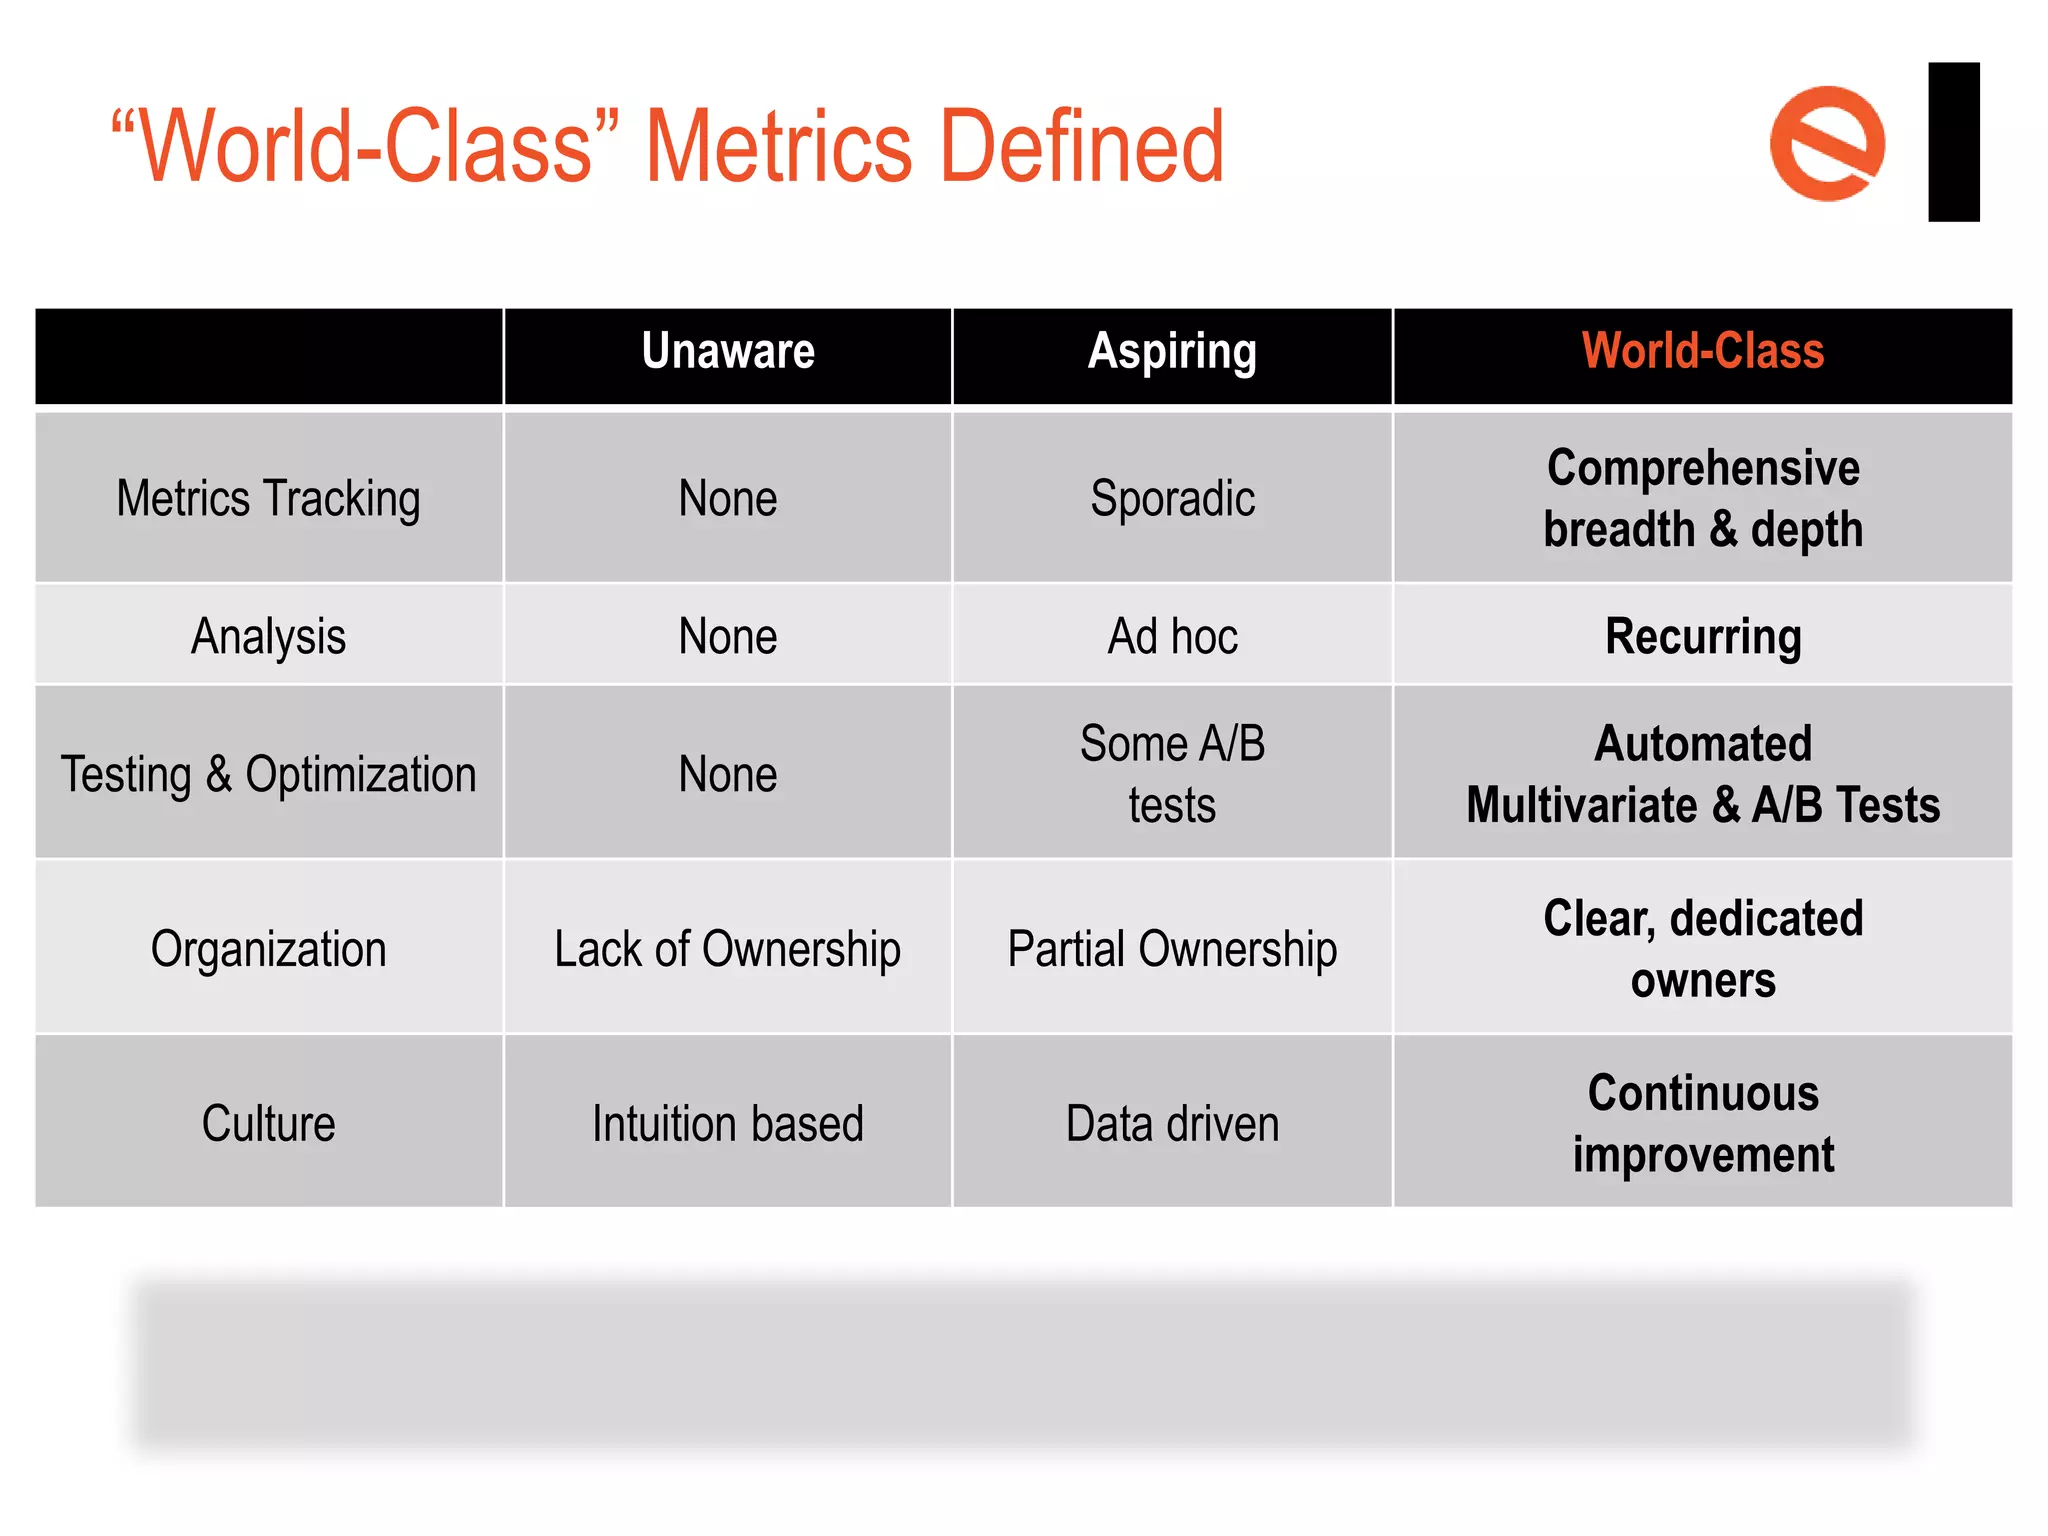
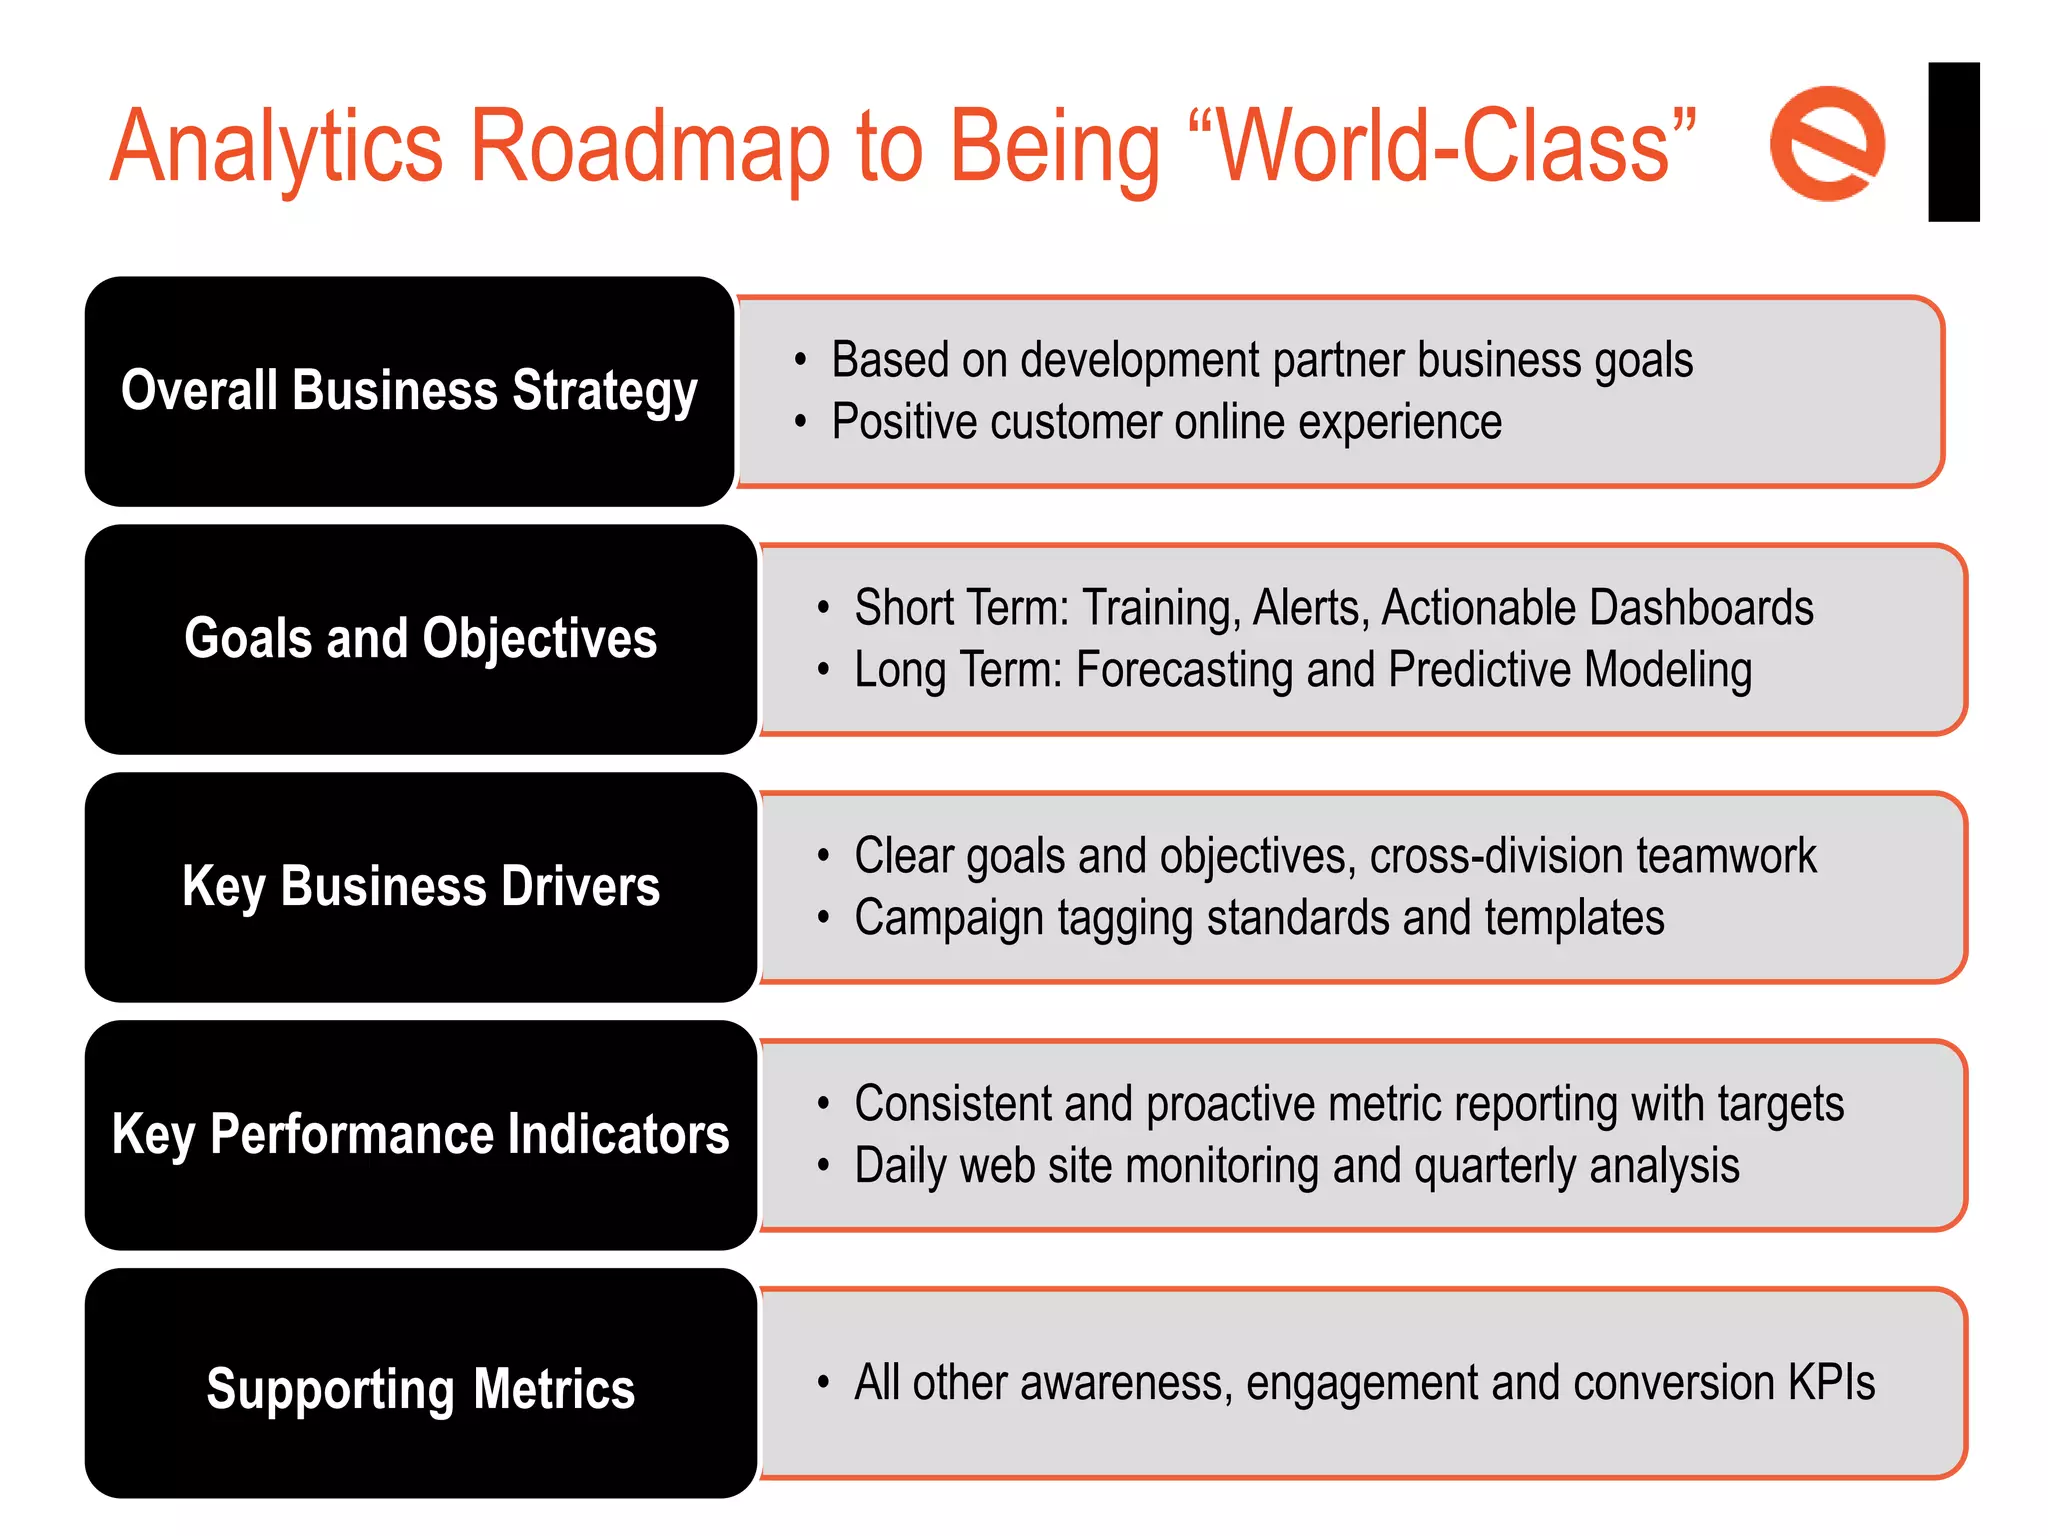
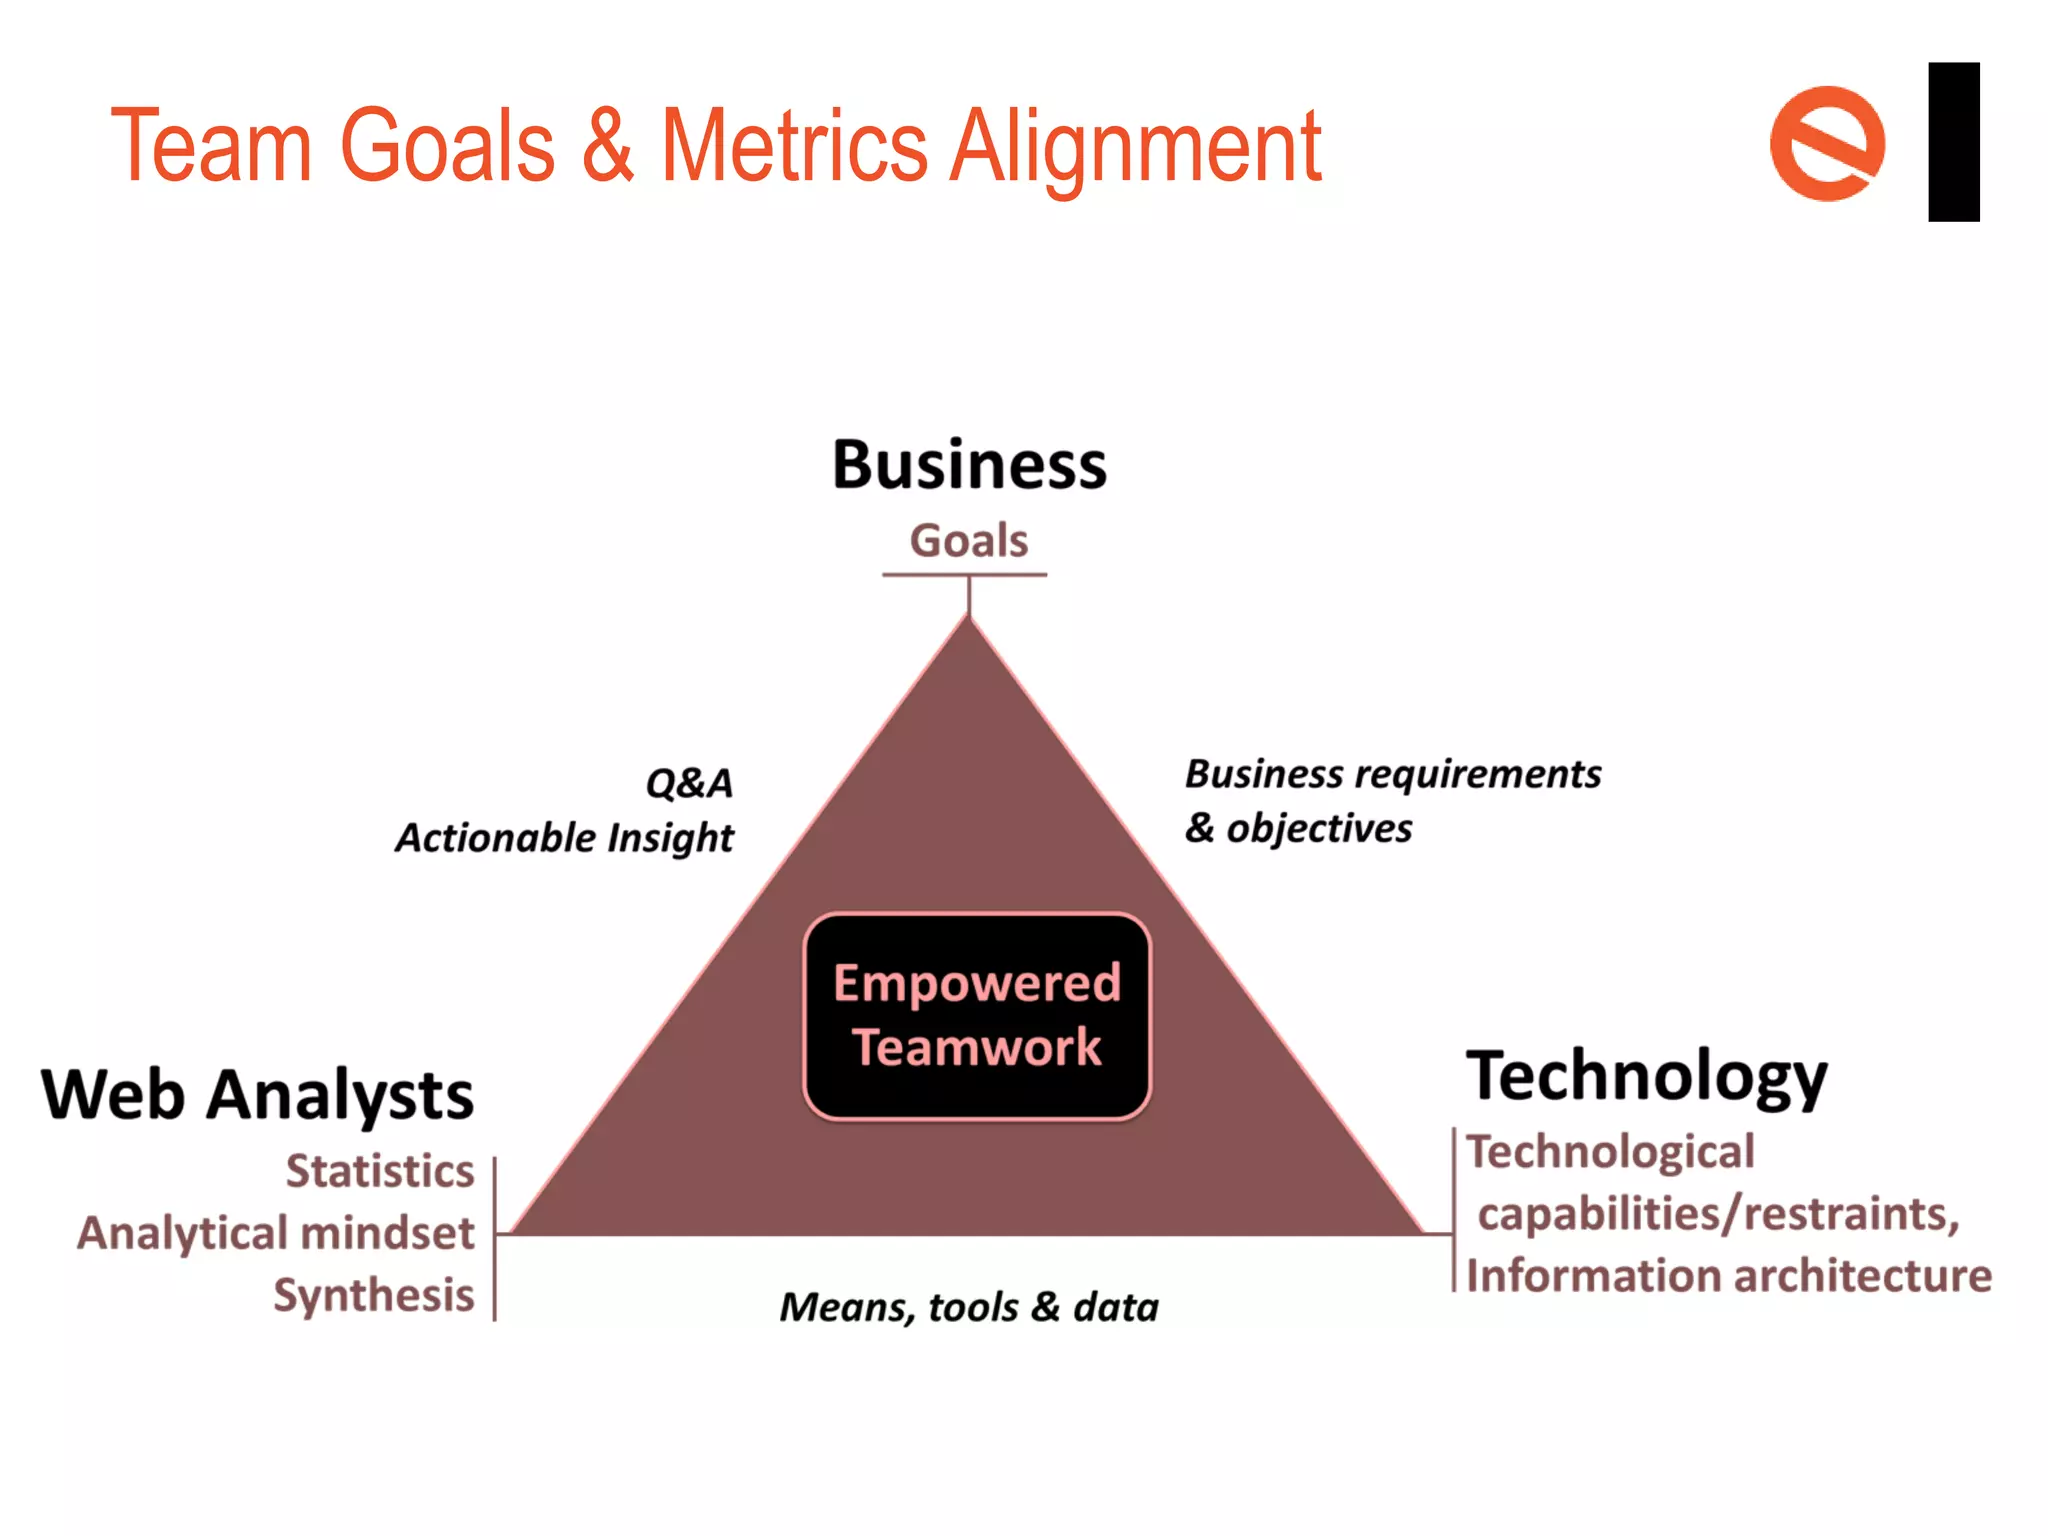
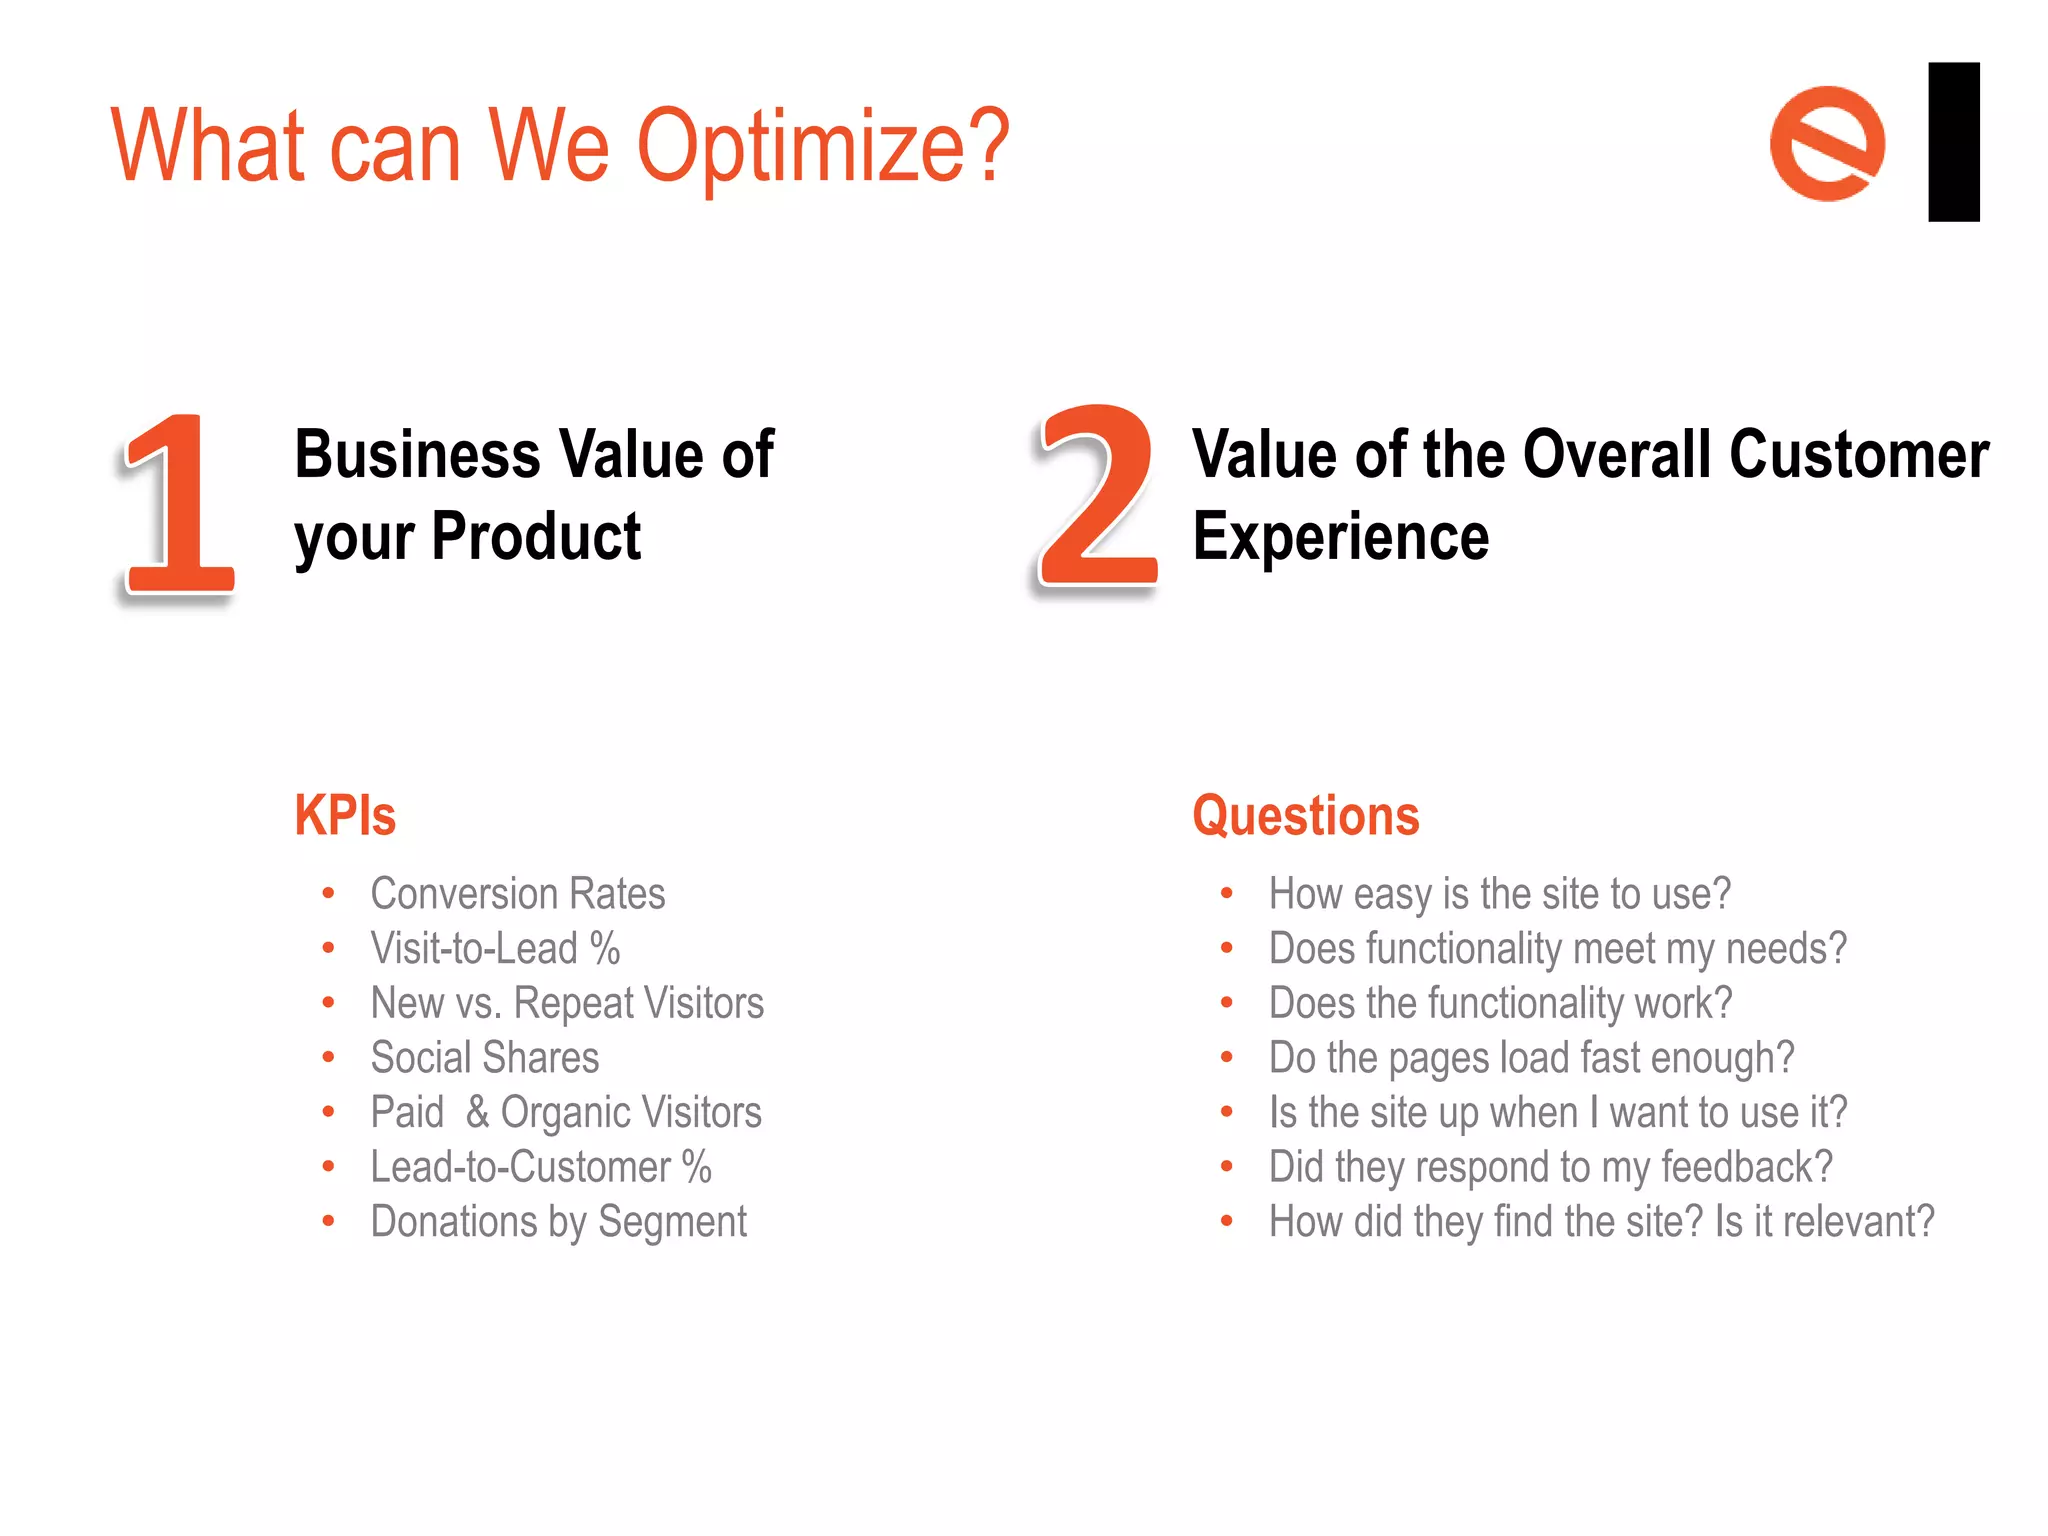
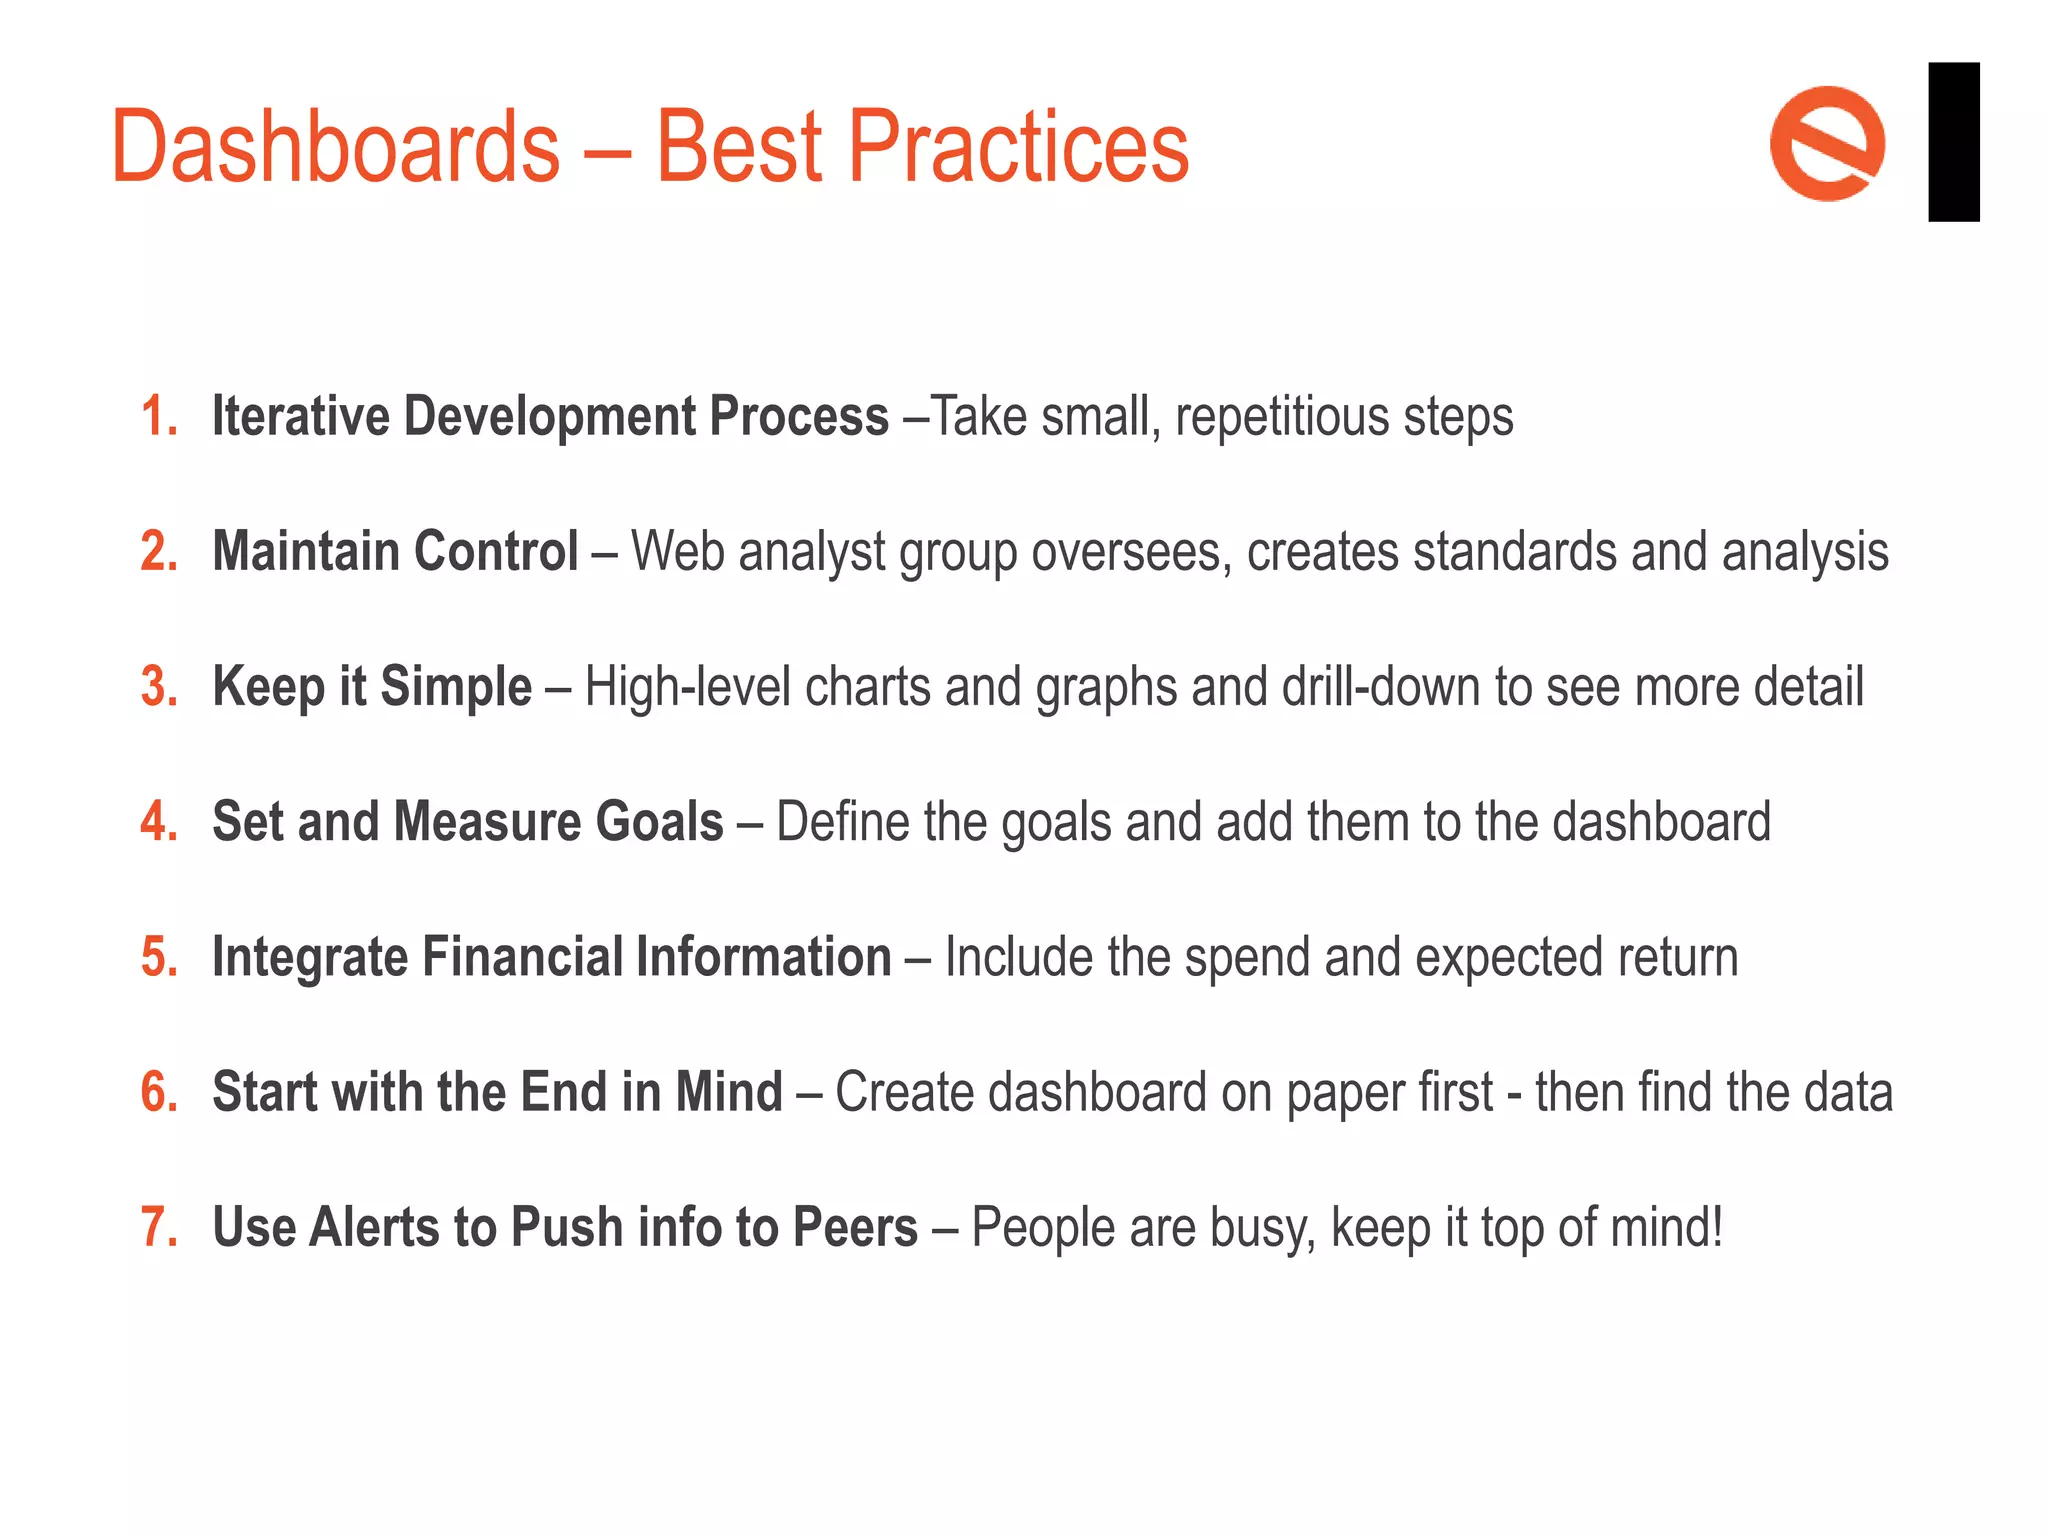
“Analytics without plans for decisionmaking is a waste of time.”
- Tom Davenport

WEB ANALYTICS ROADMAP
Optimization + Speed + Alignment
The Roadmap – a Macro View
New Reporting Opportunities
Previous Platforms

New Platforms

Data Points

Limited Metrics

Over 100 Metrics Available

Speed

24 hr lapse in time

Real-time Data

Goal Tracking

4 goals (contact, donation, buy, etc.)

100s of goals, events and
variables

Cookies

30 days

15 years!

Advanced Data
Segmentation

Limited to a few of the most common
segments

Unlimited options

Mobile Analytics

iPhone only

Multiple devices, screen sizes
& mobile A/B testing
Analytical Maturity of the Enterprise
“World-Class” Metrics Defined
Unaware

Aspiring

World-Class

Metrics Tracking

None

Sporadic

Comprehensive
breadth & depth

Analysis

None

Ad hoc

Recurring

Testing & Optimization

None

Some A/B
tests

Automated
Multivariate & A/B Tests

Organization

Lack of Ownership

Partial Ownership

Clear, dedicated
owners

Culture

Intuition based

Data driven

Continuous
improvement
Analytics Roadmap to Being “World-Class”
Overall Business Strategy

• Based on development partner business goals
• Positive customer online experience

Goals and Objectives

• Short Term: Training, Alerts, Actionable Dashboards
• Long Term: Forecasting and Predictive Modeling

Key Business Drivers

• Clear goals and objectives, cross-division teamwork
• Campaign tagging standards and templates

Key Performance Indicators

• Consistent and proactive metric reporting with targets
• Daily web site monitoring and quarterly analysis

Supporting Metrics

• All other awareness, engagement and conversion KPIs
Team Goals & Metrics Alignment
What can We Optimize?
Business Value of
your Product

Value of the Overall Customer
Experience

KPIs

Questions

•
•
•
•
•
•
•

Conversion Rates
Visit-to-Lead %
New vs. Repeat Visitors
Social Shares
Paid & Organic Visitors
Lead-to-Customer %
Donations by Segment

•
•
•
•
•
•
•

How easy is the site to use?
Does functionality meet my needs?
Does the functionality work?
Do the pages load fast enough?
Is the site up when I want to use it?
Did they respond to my feedback?
How did they find the site? Is it relevant?
Dashboards – Best Practices
1. Iterative Development Process –Take small, repetitious steps
2. Maintain Control – Web analyst group oversees, creates standards and analysis
3. Keep it Simple – High-level charts and graphs and drill-down to see more detail
4. Set and Measure Goals – Define the goals and add them to the dashboard
5. Integrate Financial Information – Include the spend and expected return
6. Start with the End in Mind – Create dashboard on paper first - then find the data
7. Use Alerts to Push info to Peers – People are busy, keep it top of mind!
QUESTIONS?
http://bit.ly/join-the-unfunnel

Web Analytics Roadmap 2018

  • 1.
    “Analytics without plansfor decisionmaking is a waste of time.” - Tom Davenport WEB ANALYTICS ROADMAP Optimization + Speed + Alignment
  • 2.
    The Roadmap –a Macro View
  • 3.
    New Reporting Opportunities PreviousPlatforms New Platforms Data Points Limited Metrics Over 100 Metrics Available Speed 24 hr lapse in time Real-time Data Goal Tracking 4 goals (contact, donation, buy, etc.) 100s of goals, events and variables Cookies 30 days 15 years! Advanced Data Segmentation Limited to a few of the most common segments Unlimited options Mobile Analytics iPhone only Multiple devices, screen sizes & mobile A/B testing
  • 4.
    Analytical Maturity ofthe Enterprise
  • 5.
    “World-Class” Metrics Defined Unaware Aspiring World-Class MetricsTracking None Sporadic Comprehensive breadth & depth Analysis None Ad hoc Recurring Testing & Optimization None Some A/B tests Automated Multivariate & A/B Tests Organization Lack of Ownership Partial Ownership Clear, dedicated owners Culture Intuition based Data driven Continuous improvement
  • 6.
    Analytics Roadmap toBeing “World-Class” Overall Business Strategy • Based on development partner business goals • Positive customer online experience Goals and Objectives • Short Term: Training, Alerts, Actionable Dashboards • Long Term: Forecasting and Predictive Modeling Key Business Drivers • Clear goals and objectives, cross-division teamwork • Campaign tagging standards and templates Key Performance Indicators • Consistent and proactive metric reporting with targets • Daily web site monitoring and quarterly analysis Supporting Metrics • All other awareness, engagement and conversion KPIs
  • 7.
    Team Goals &Metrics Alignment
  • 8.
    What can WeOptimize? Business Value of your Product Value of the Overall Customer Experience KPIs Questions • • • • • • • Conversion Rates Visit-to-Lead % New vs. Repeat Visitors Social Shares Paid & Organic Visitors Lead-to-Customer % Donations by Segment • • • • • • • How easy is the site to use? Does functionality meet my needs? Does the functionality work? Do the pages load fast enough? Is the site up when I want to use it? Did they respond to my feedback? How did they find the site? Is it relevant?
  • 9.
    Dashboards – BestPractices 1. Iterative Development Process –Take small, repetitious steps 2. Maintain Control – Web analyst group oversees, creates standards and analysis 3. Keep it Simple – High-level charts and graphs and drill-down to see more detail 4. Set and Measure Goals – Define the goals and add them to the dashboard 5. Integrate Financial Information – Include the spend and expected return 6. Start with the End in Mind – Create dashboard on paper first - then find the data 7. Use Alerts to Push info to Peers – People are busy, keep it top of mind!
  • 10.