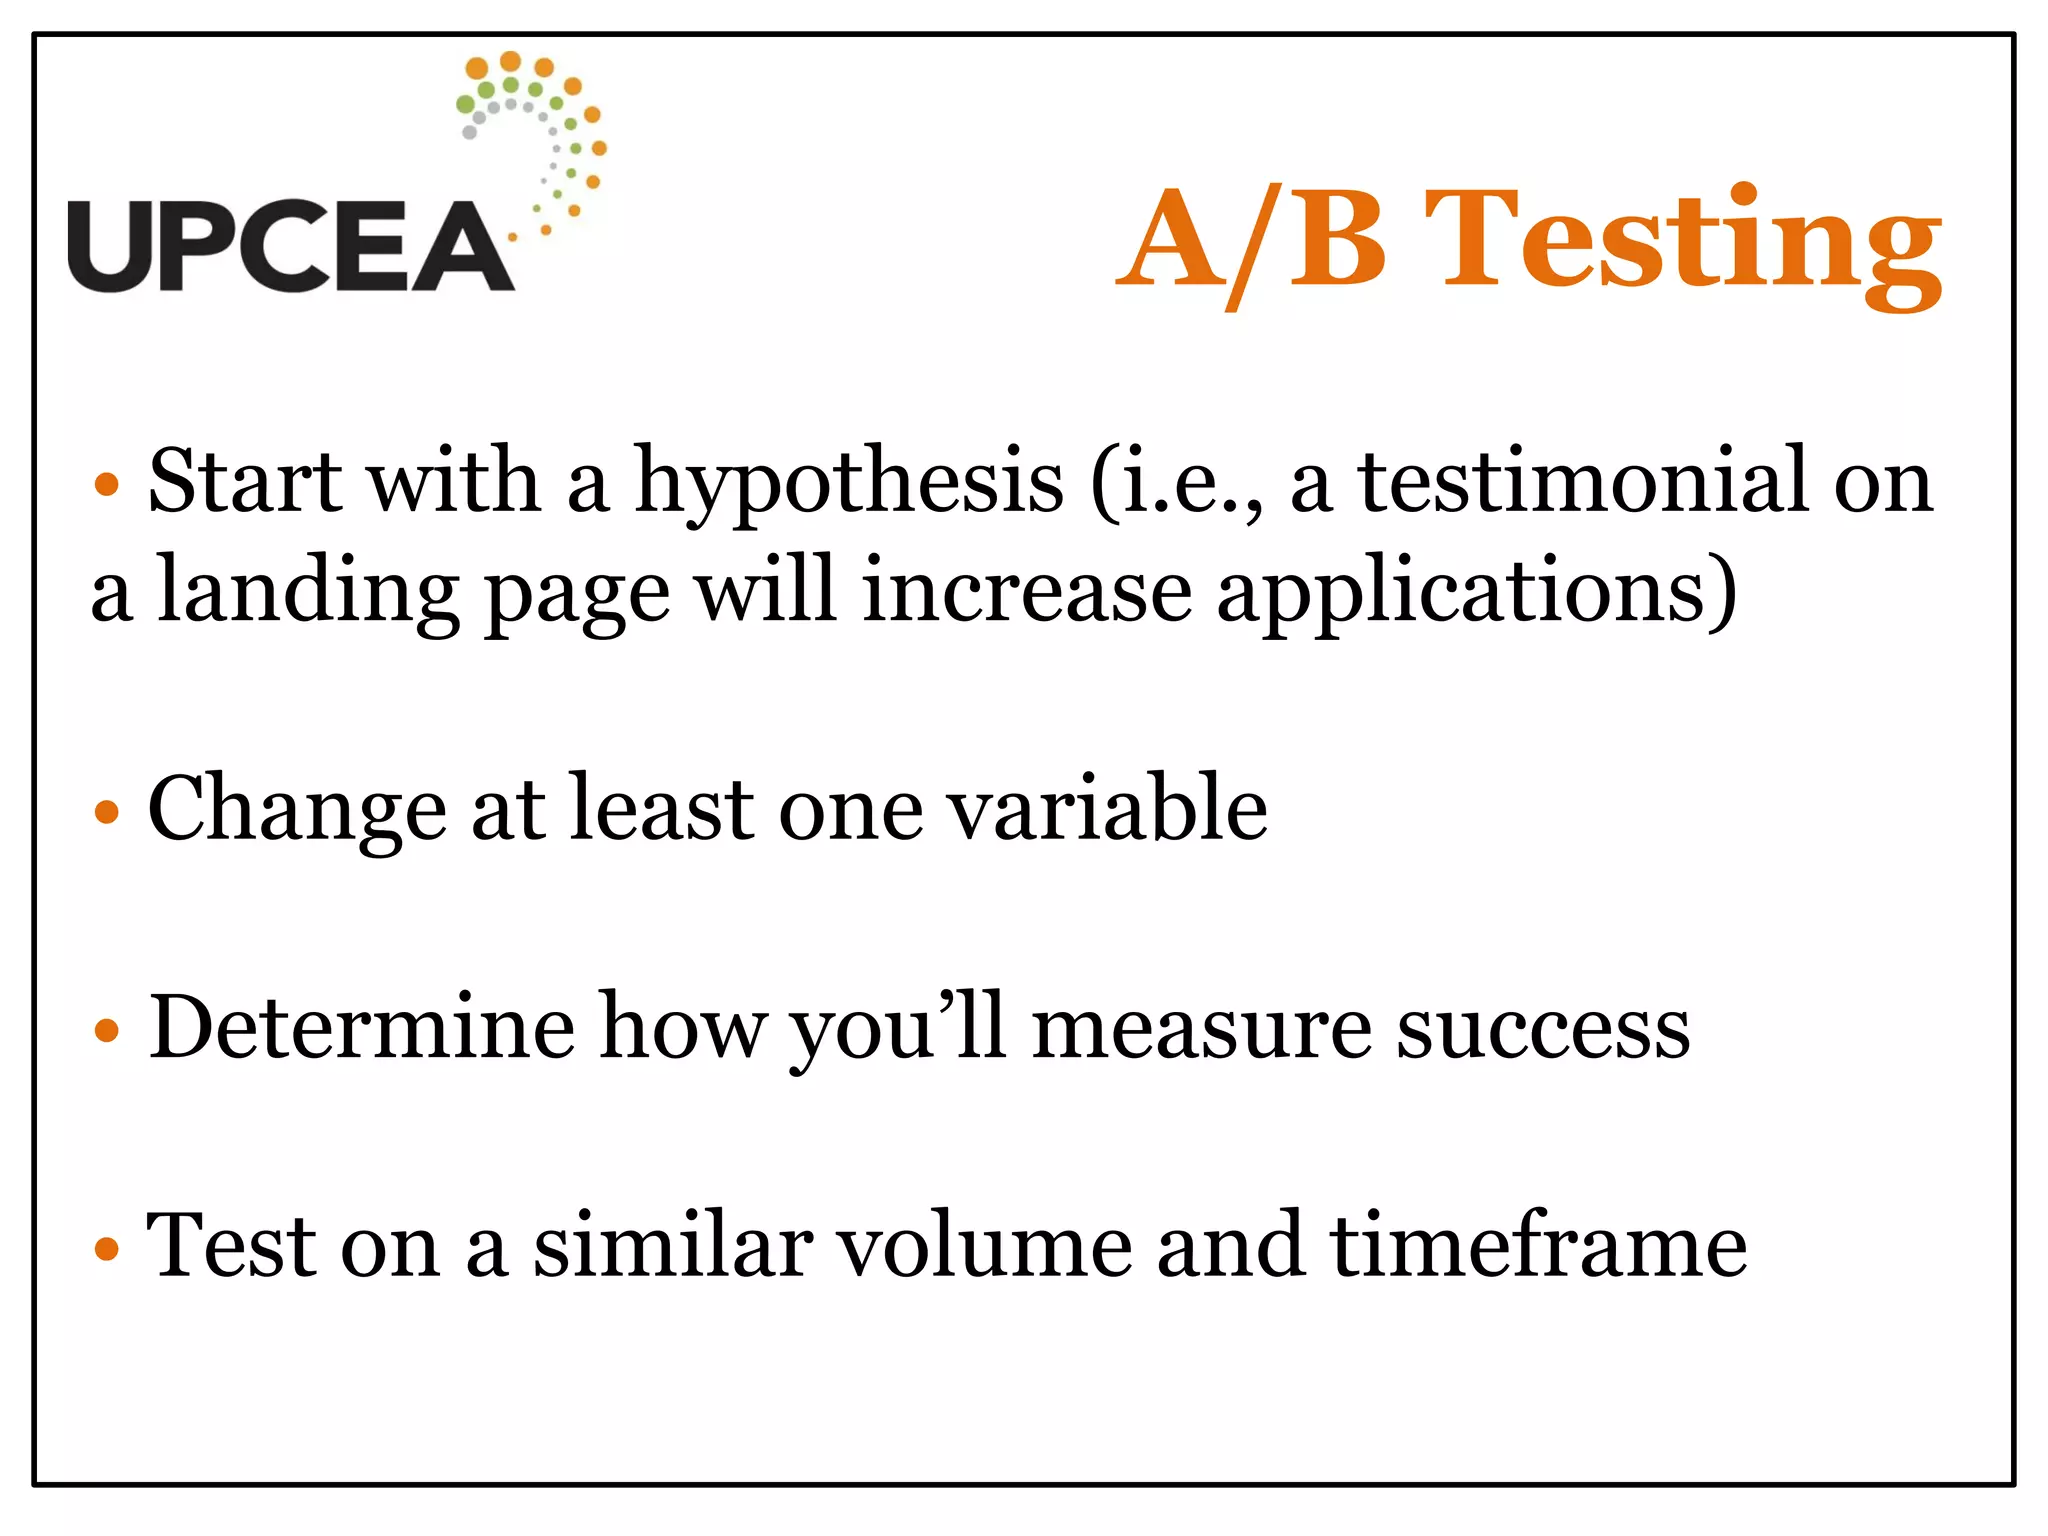
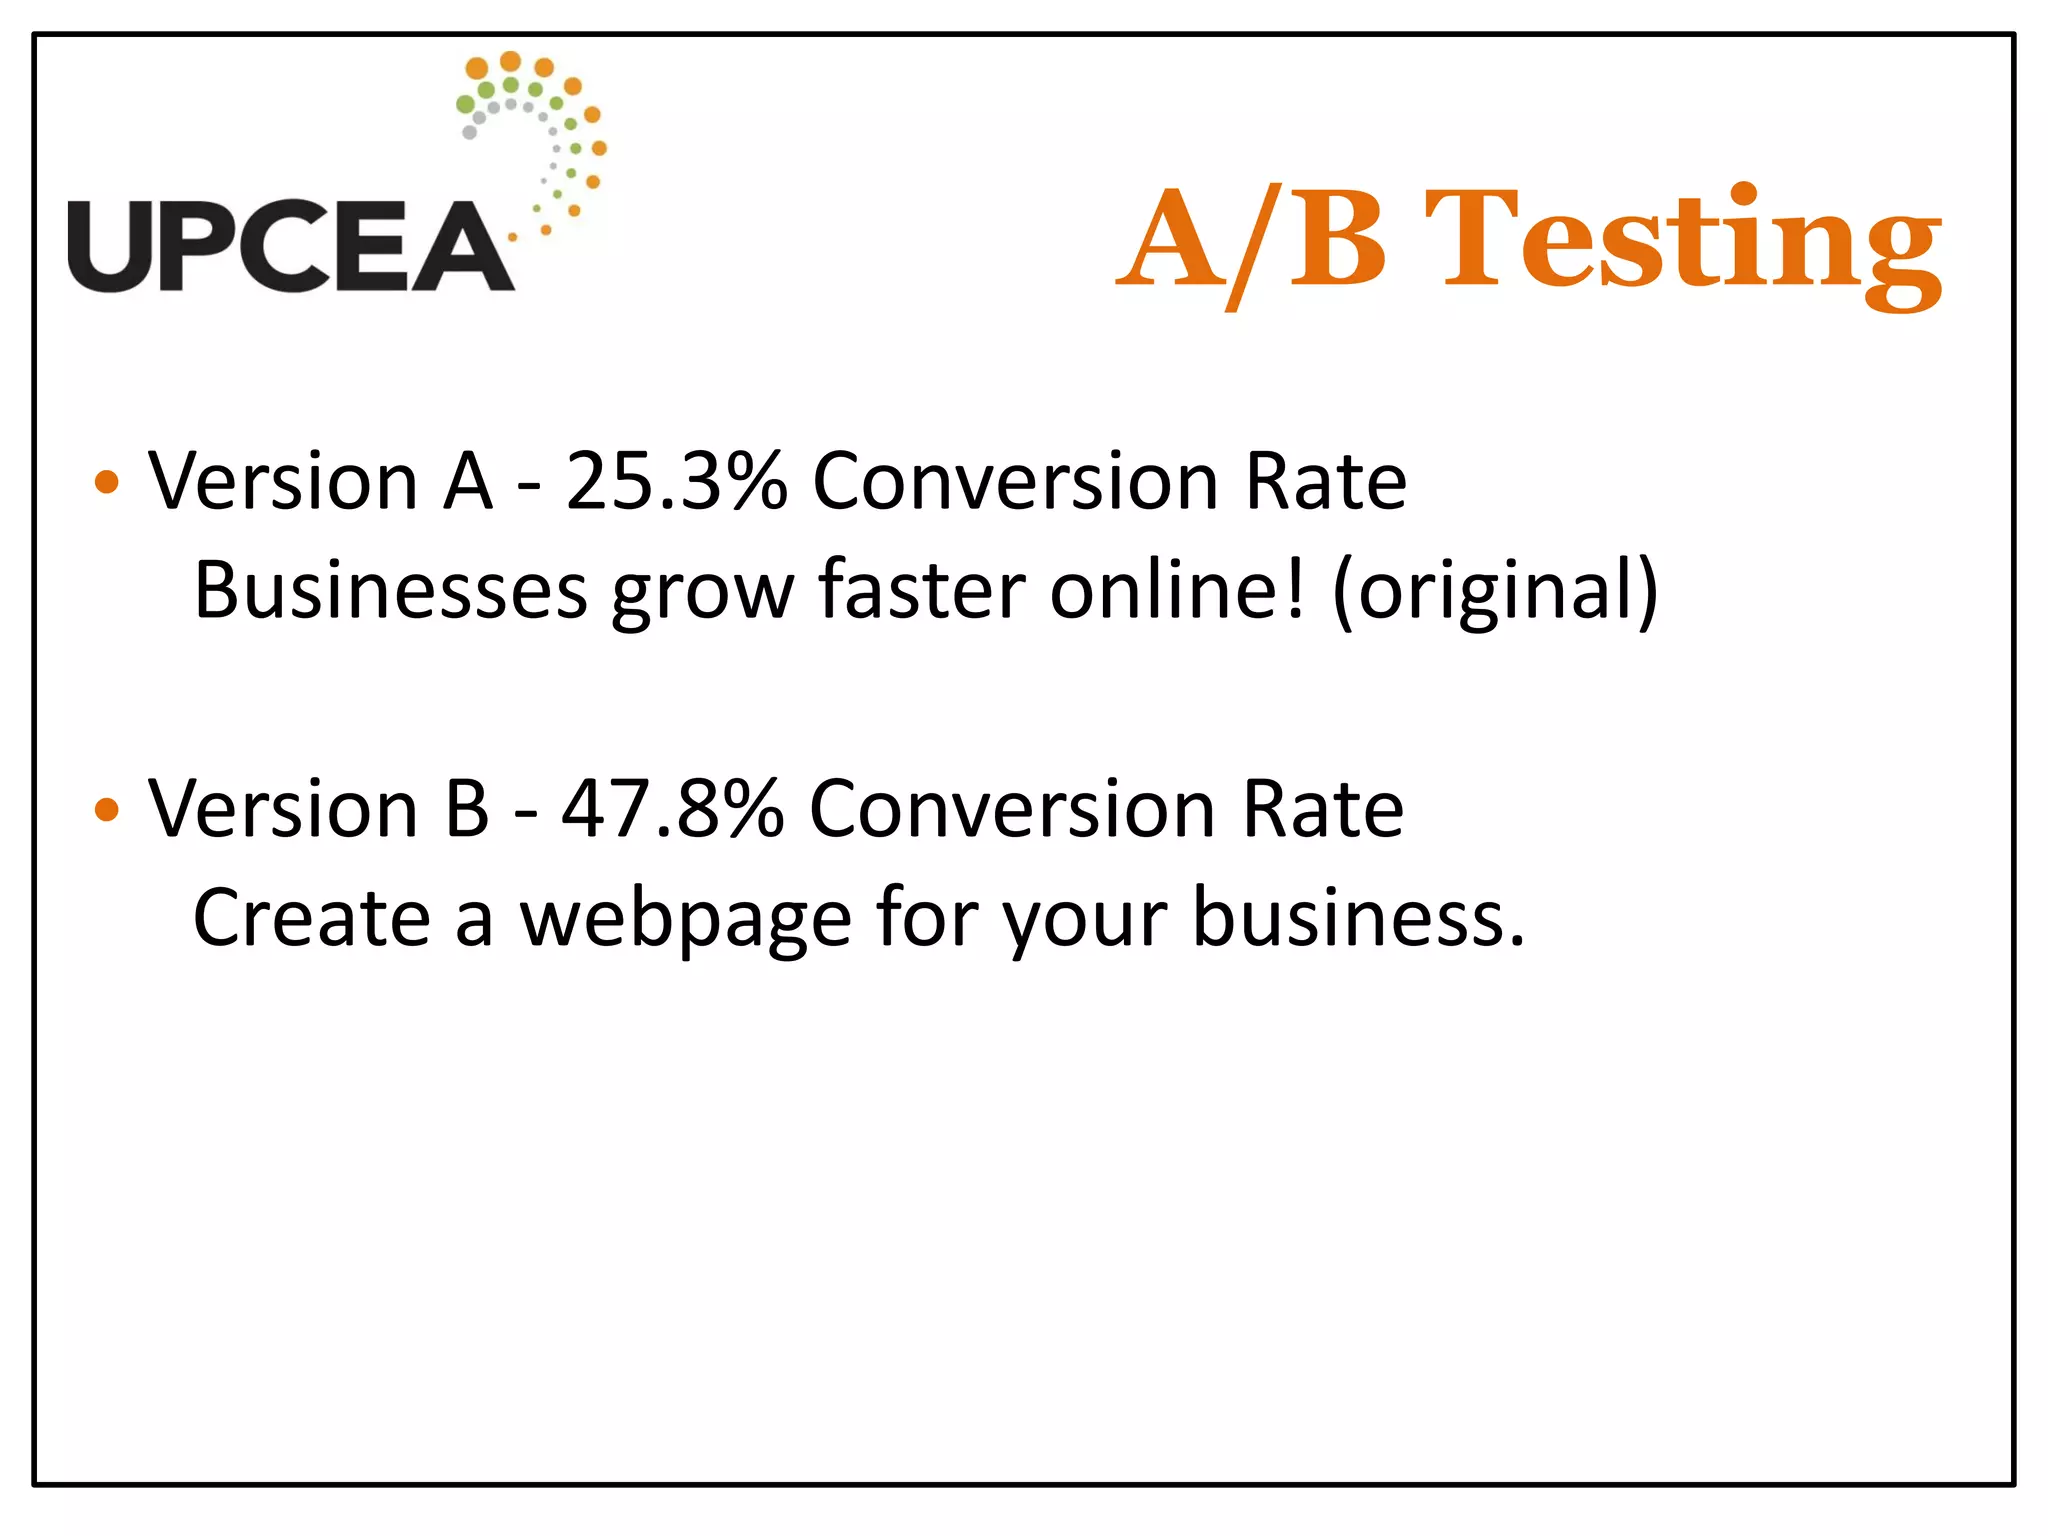
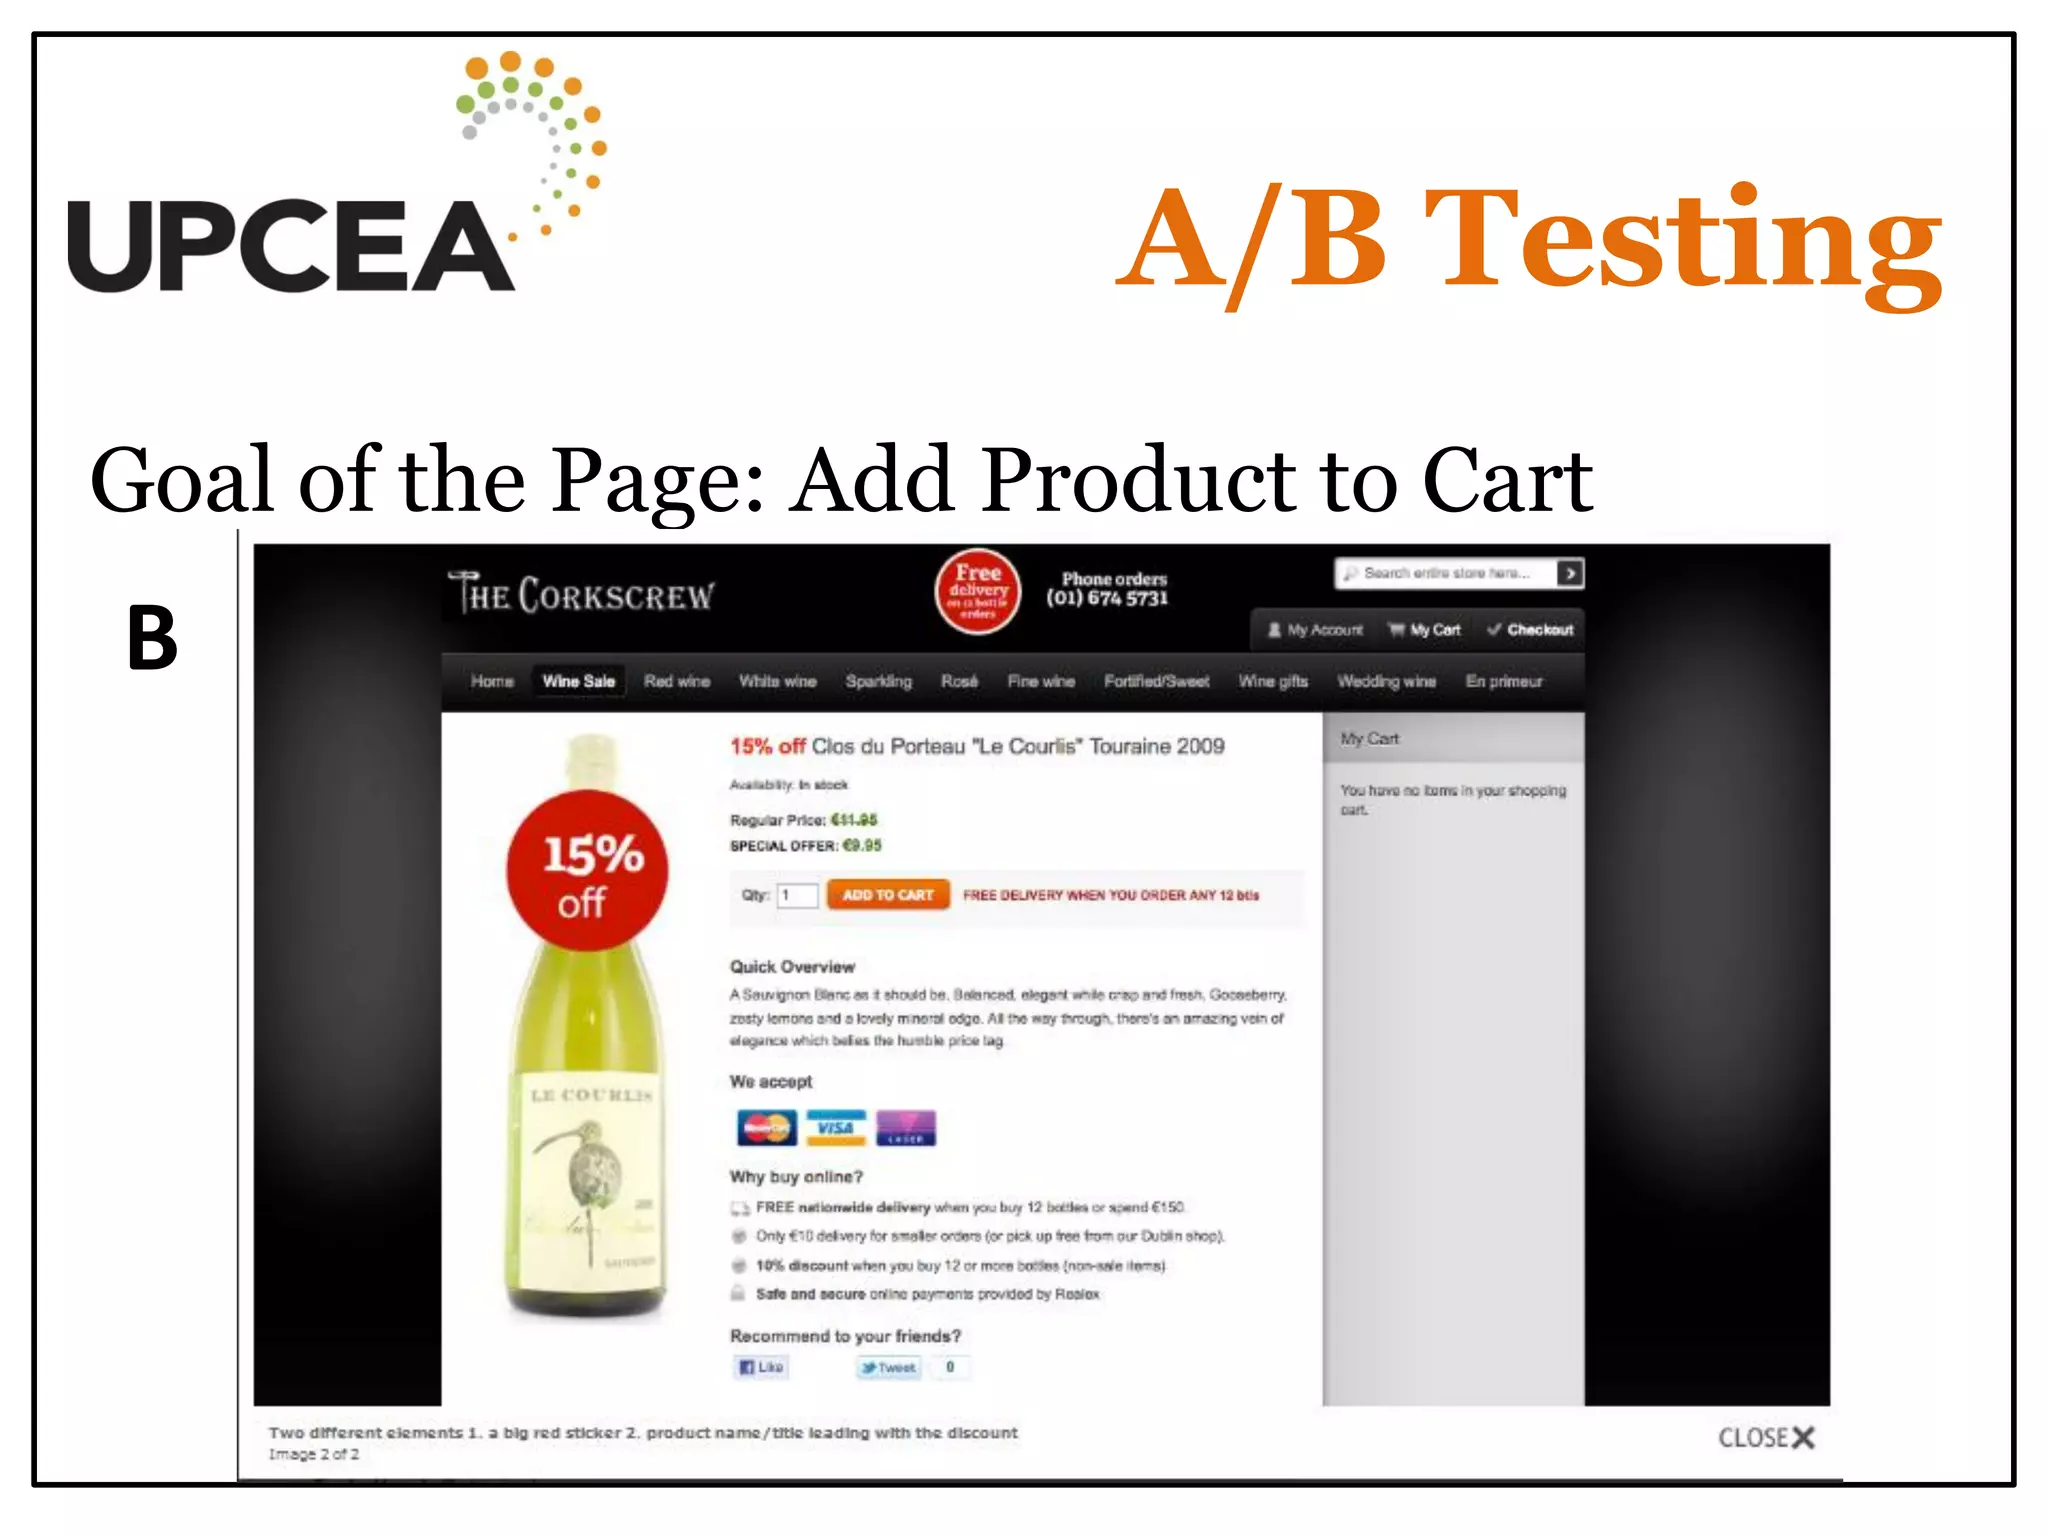
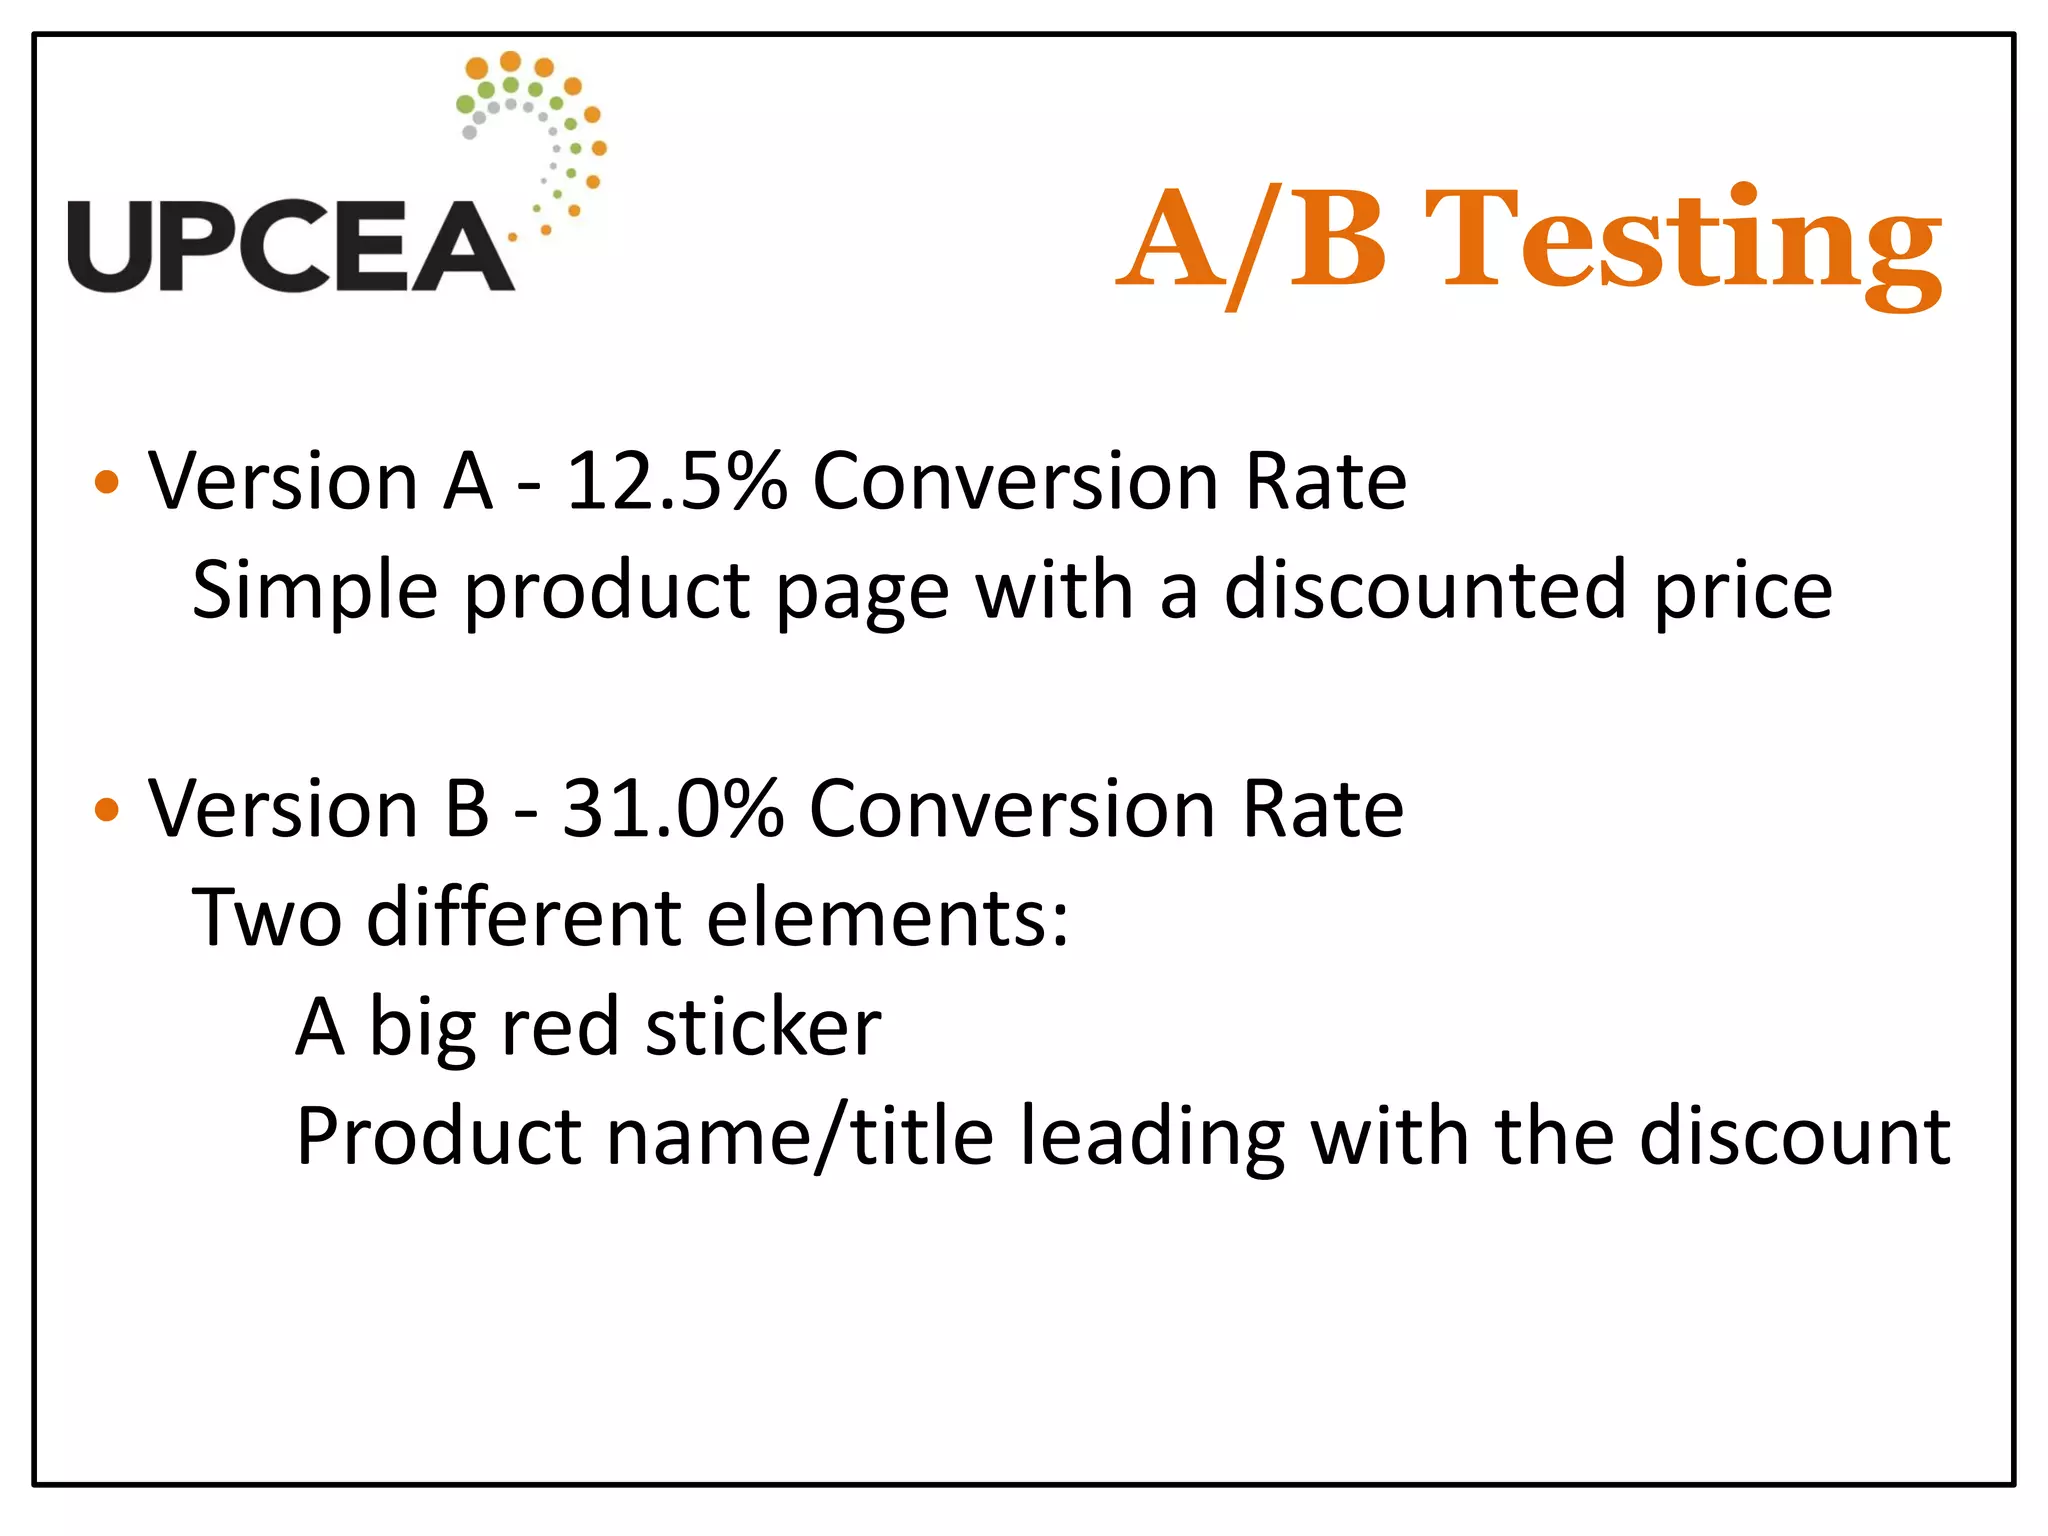
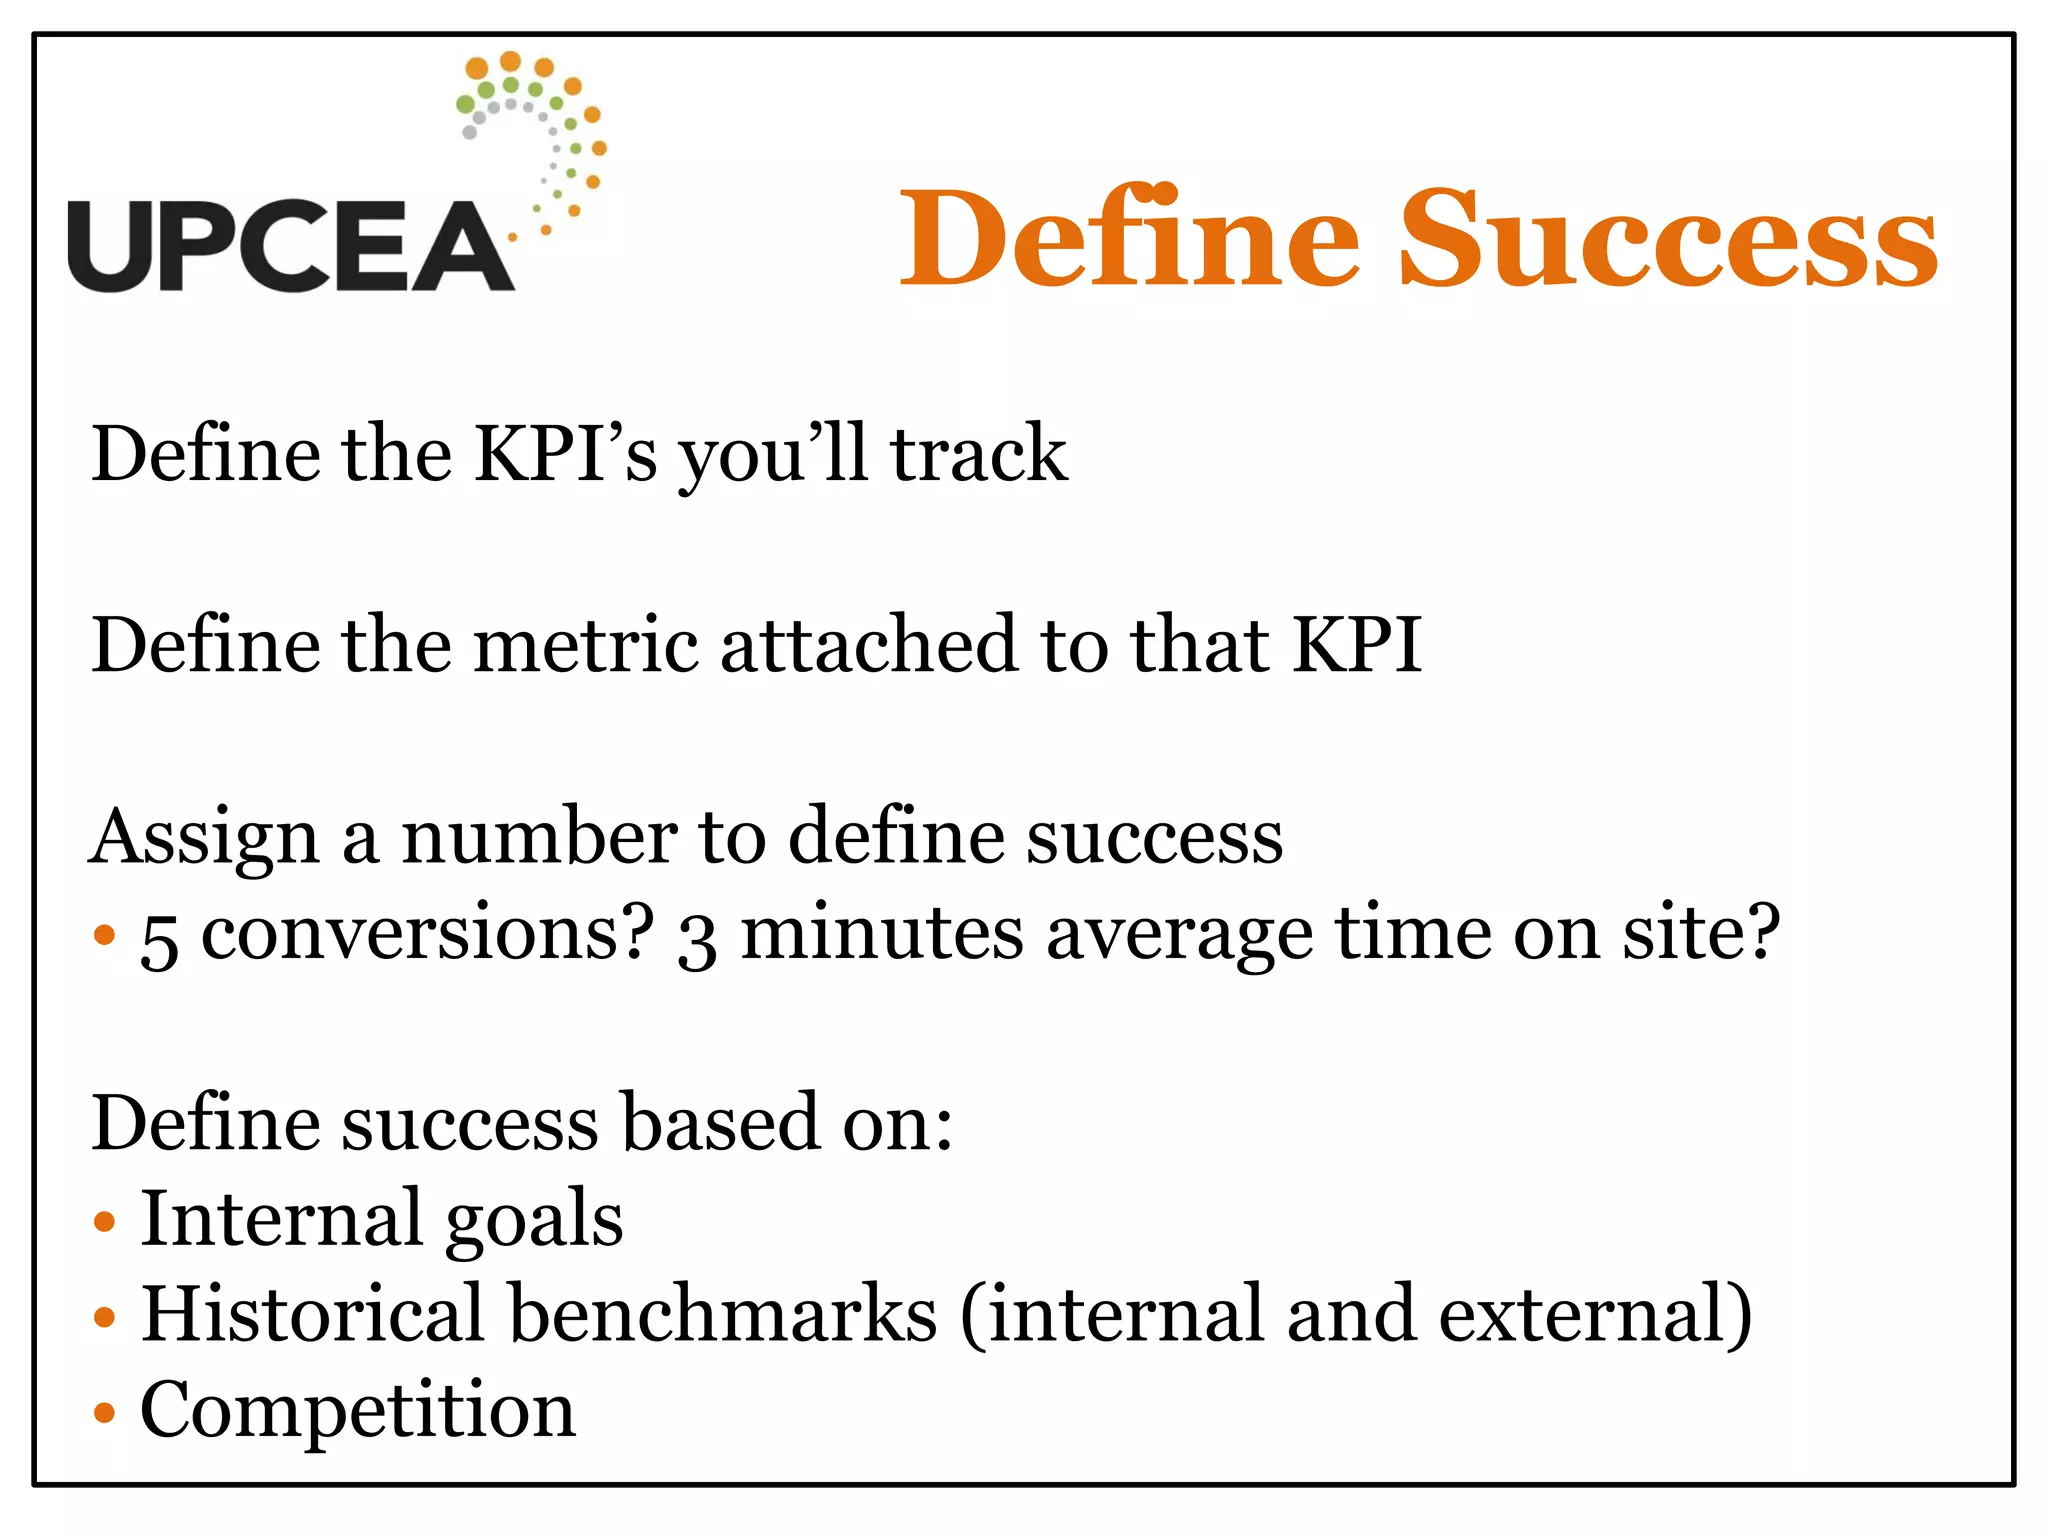
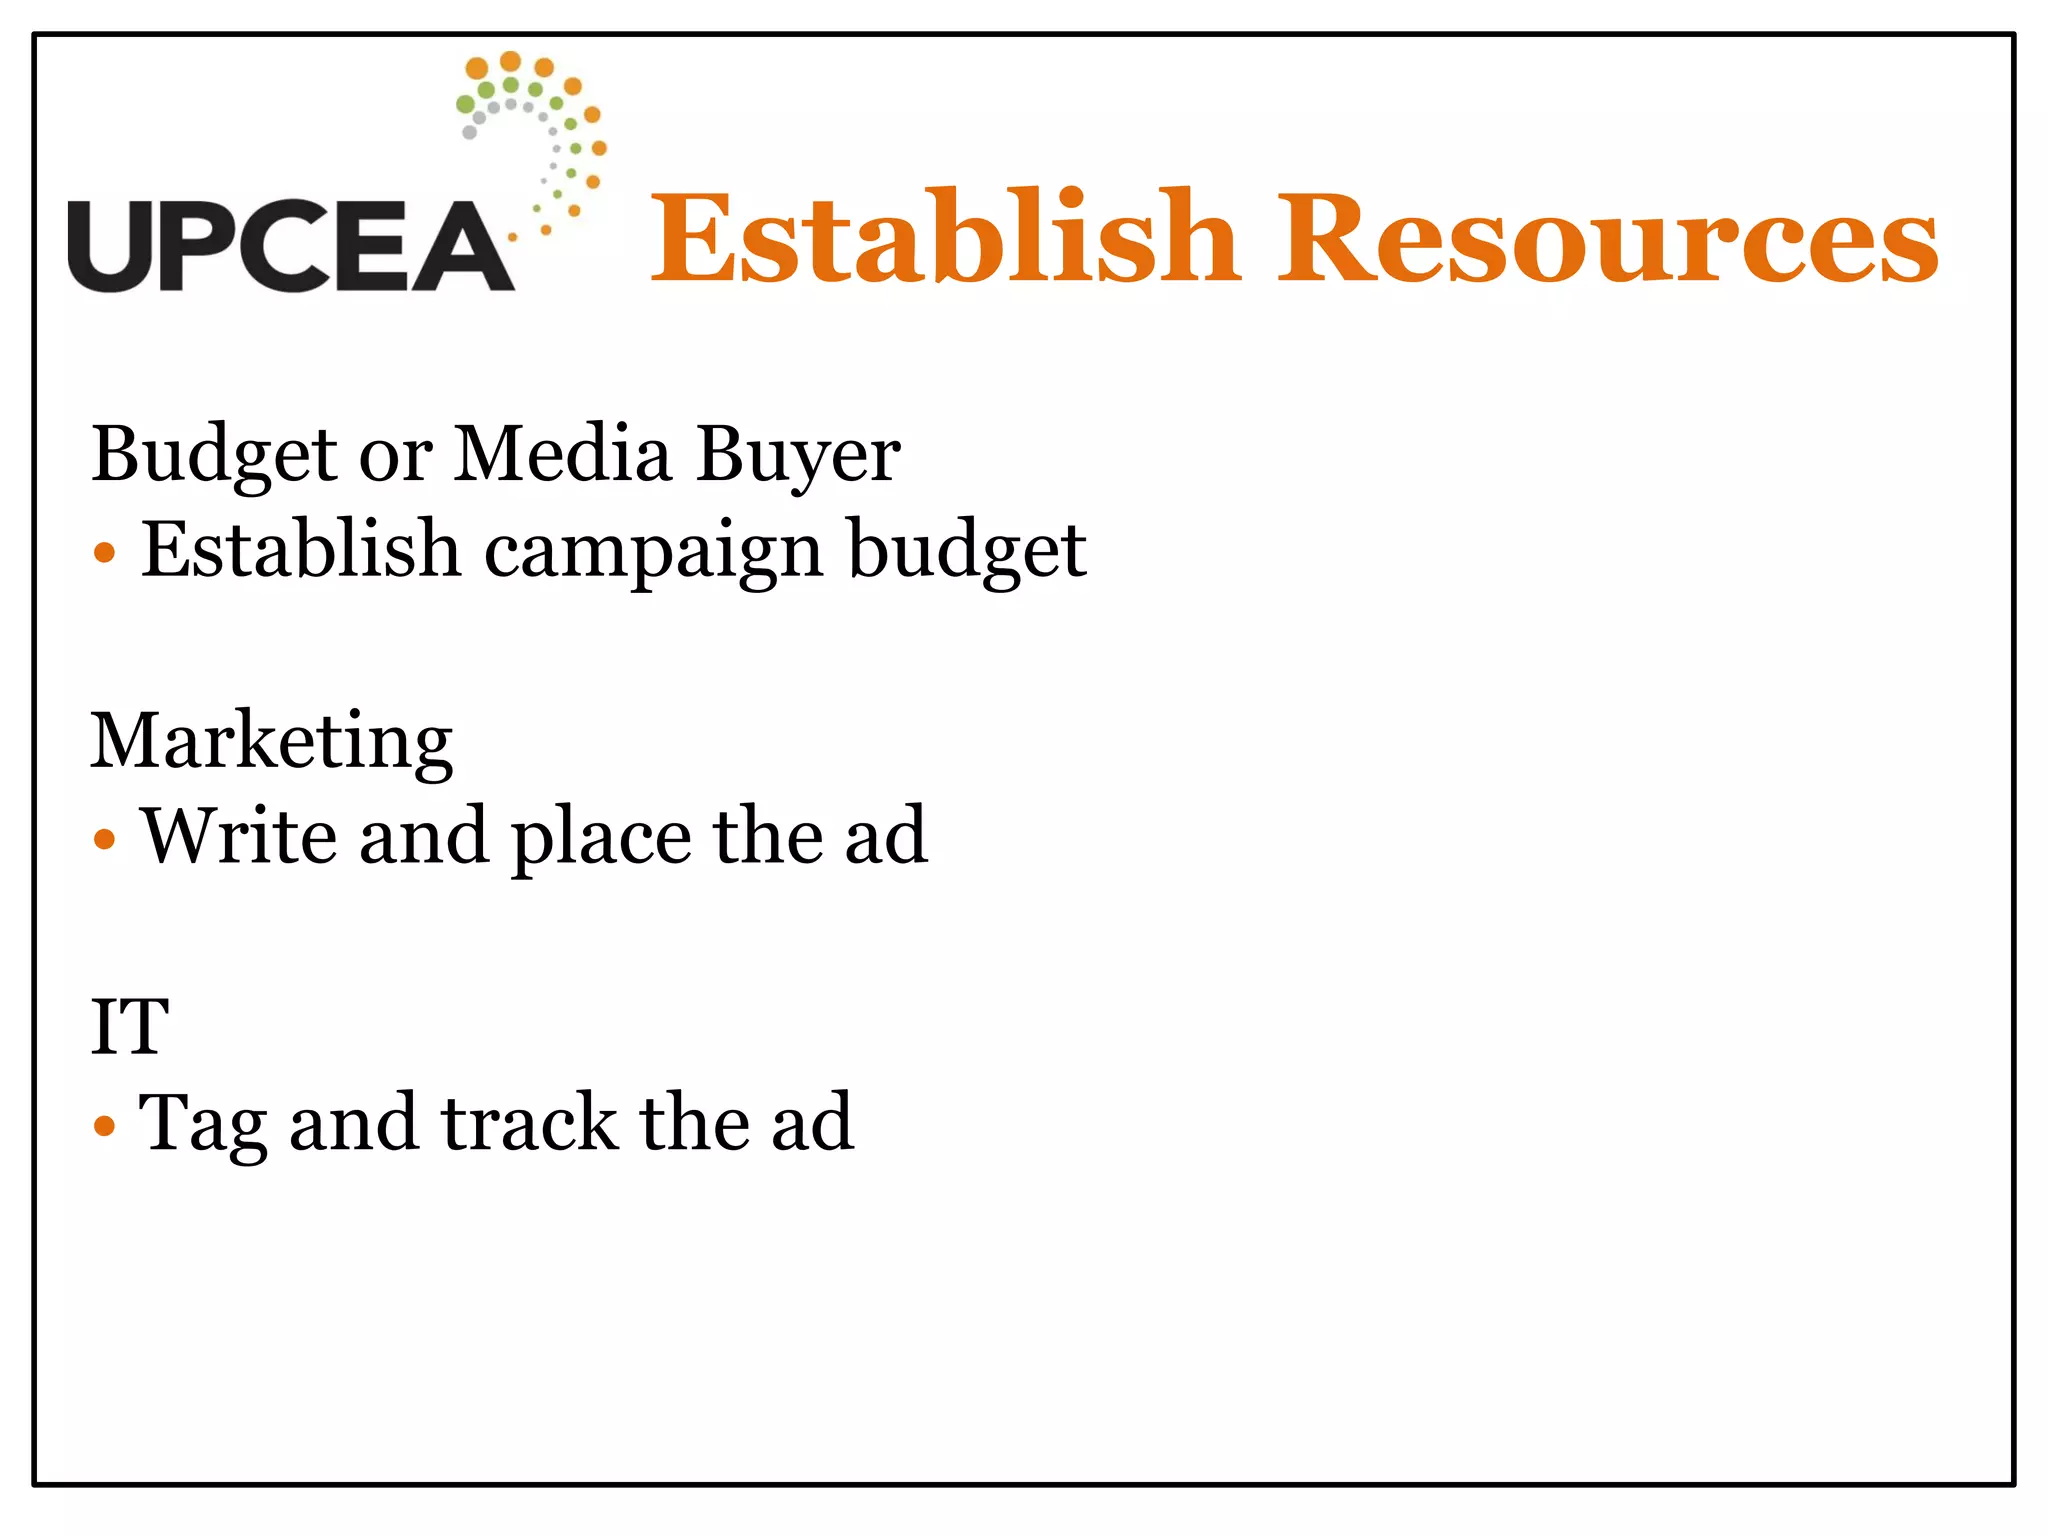
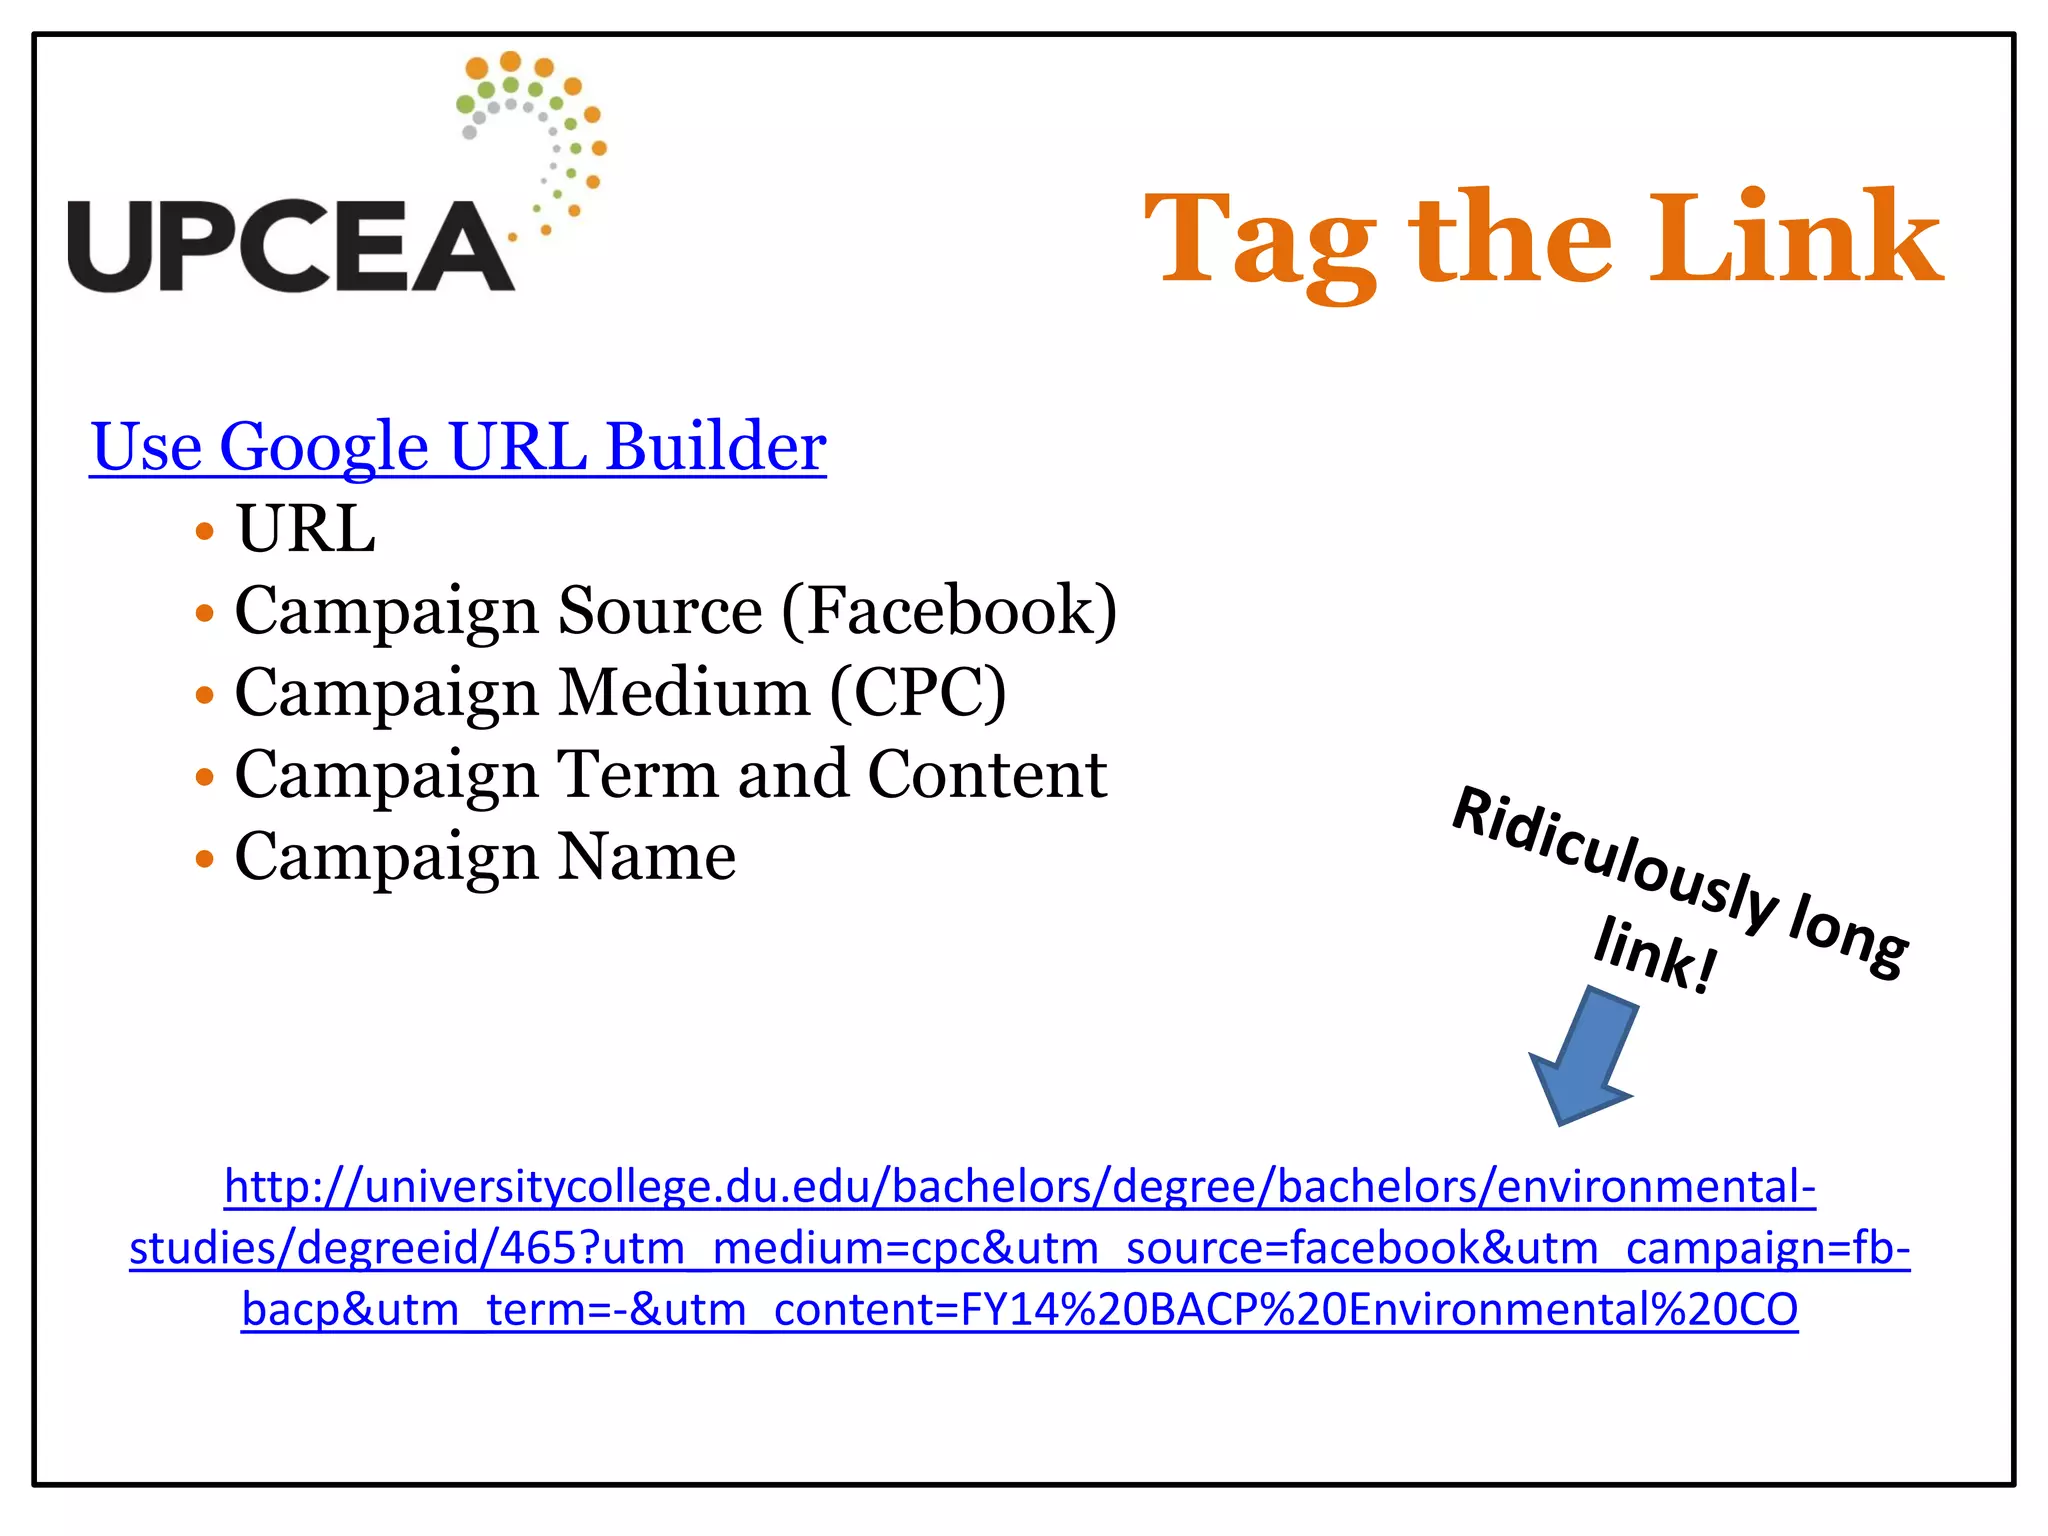
Analytics in Action! Data-Driven Marketing 
How to Create a Website Analytics Plan and Start Making Data-Driven Marketing Decisions
Welcome! 
• Teach Web Analytics and Social Media 
• Marketing & Communications at DU 
• UPCEA MEMS Planning Committee 
victoria.harben@du.edu 
@victoriaharben 
continuingedmarketing.com
Expectations 
• Essential components of an analytics plan 
• Tactics for presenting data to leadership 
• Strategies for creating a culture of metrics 
• Action steps, tools, and resources
WEB ANALYTICS
Pop Quiz! 
For a continuing education website… 
• Average bounce rate? 
• Average time on site? 
• Average number of visitors/month? 
• Day of the week with highest visitors? 
45% 
3:12 
28,000 
Tuesday 
Do you know your metrics? 
Source: JMH Consulting
DEFINITIONS 
PURPOSE 
TERMS 
Overview 
What is web analytics?
Web Analytics 
Data-driven decision-making! 
The combination of marketing research and data to help meet business objectives, improve user experience, and increase ROI.
It’s Not… 
http://youtu.be/haoqBKEwg1A
Questions 
Who is coming to my website? 
What do I want them to do? 
What are they actually doing?
Audience 
Prospective 
•Marketing and promotional 
•Process to attend, cost, deadlines 
Current 
•Resources 
•Schedules, registration, resources 
Both 
•Can your website appeal to both current and prospective students? And alumni?
Outcomes 
• Every website should have the same three outcomes: 
• Increase Revenue 
• Reduce Cost 
• Improve User Satisfaction/Loyalty
Key Terms 
• Metric 
• Key Performance Indicator (KPI) • News Visitors vs. Returning Visitors 
• Referrer 
• Conversion • Exit Page 
• Bounce Rate
Bounce Rate 
0 10 20 30 40 50 60 70 80 90 100 
<- Retail -> 
<- Service-> 
<- Content> 
• Single page view visits divided by entry pages. 
• You want a LOW bounce rate. 
• Typical bounce rates: 
Retail sites: 20-40% bounce 
Service sites: 10-30% bounce 
Content websites: 40-60% bounce
OBJECTIVES/GOALS 
DATA COLLECTION 
TESTING 
COMPETITION 
REPORTING 
The Process
Objectives/Goals 
Consider organization objectives: • Doable • Understandable • Manageable • Beneficial Consider goals (marketing & website): • Specific • Measurable • Actionable • Realistic • Time-Bound
Data 
Quantitative Data (Clickstream) 
• Bounce rates, time on site, depth of visit, exit rates, conversions, etc. 
Qualitative Data • Usability tests, surveys, A/B split tests, multivariate testing.
A/B Testing 
• Start with a hypothesis (i.e., a testimonial on a landing page will increase applications) 
• Change at least one variable 
• Determine how you’ll measure success 
• Test on a similar volume and timeframe
A/B Testing 
Goal of the Page: Click on the Pricing Plan 
A
A/B Testing 
Goal of the Page: Click on the Pricing Plan 
B
A/B Testing 
• Version A - 25.3% Conversion Rate 
Businesses grow faster online! (original) 
• Version B - 47.8% Conversion Rate 
Create a webpage for your business.
A/B Testing 
Goal of the Page: Add Product to Cart 
A
A/B Testing 
Goal of the Page: Add Product to Cart 
B
A/B Testing 
• Version A - 12.5% Conversion Rate 
Simple product page with a discounted price 
• Version B - 31.0% Conversion Rate 
Two different elements: 
A big red sticker 
Product name/title leading with the discount
MVT 
• Identify the challenge and create a hypothesis 
• Add variations to page 
• Determine how you’ll measure success
Competition 
• “Also Visited” data 
• Referrals and destinations 
• Long-term traffic trends/historical data 
• SEO and keyword research 
• Industry benchmarks 
• Tools 
• Alexa, Compete, Hitwise, Comscore 
• Google Insights, Trends, AdWords 
• UserTesting.com, OpenSiteExplorer
Action Dashboard 
Best KPIs to track for university website: 
• Average time on site 
• New vs. returning visitors 
• Conversions 
• Applying/registering for a class 
• Downloading a brochure 
• Using contact form/sending email 
• Spending a certain amount of time 
Create an action dashboard that focuses on performance, insights, and actions.
Action Dashboard 
The Metric 
Key Trends 
Action Steps 
Organizational Impact
CULTURE OF METRICS ANALYTICS OWNERSHIP 
Gaining Buy-In
Who is tracking their own website analytics?
Gaining Buy-In 
Fight the resistance! 
• Discover why your organization has been reluctant to track analytics. Resources? Cost? Lack of understanding? 
Be an advocate and identify stakeholders 
• Find support, solve a problem for them 
Form relationship with IT 
• Have open communication and process
Gaining Buy-In 
Learn the university’s pain points 
• Enrollment? Retention? Donations? Alumni engagement? 
Build credibility by presenting relevant data 
• Show how the data impacts the organization 
Why is analytics necessary? 
• Show, don’t tell, how analytics can help the organization
Ownership 
• Who makes decisions? 
• Who makes changes to the web? 
• Who interprets the data? 
• Who has control over the budget? 
Marketing 
Leadership 
IT
Analytics Manager 
Characteristics: • Passionate advocate • Flexibility • Questions data • Interested in innovation and trends • People-person/relationship-builder • Business savvy
Analytics Manager 
Questions to ask: 
• What resources/websites/blogs do you read to stay informed? 
• What is something coming up in the next six months that will change the world of web analytics?
Vendors 
Consider: • Benefits (Not Just Features) 
• Costs 
• Contractual Obligations 
• How Data is Exported 
• One-on-One Resources Available 
• Admin Access to Tool
Vendors 
Questions to ask: 
• Difference between yours and free tools? 
• Type of offered support: 24/7, account rep? 
• What are you planning for the next 6 months to a year to stay ahead of competition?
Resources 
• Google Analytics 
• Yahoo Web Analytics 
• Crazy Egg ($9-$99/month) 
• TeaLeaf 
• Omniture (avg. $5k/month) 
• Clicktale (free-$99/month) 
• Sitemeter (free-$59/year) 
• VisiStat (starting at $50/month)
Resources 
• Digital Analytics Association 
http://www.digitalanalyticsassociation.org 
• Avinash Kaushik’s Blog http://www.kaushik.net/avinash 
• KISS Metrics http://blog.kissmetrics.com/topics/analytics 
• Search Engine Watch http://searchenginewatch.com/analytics 
• Mashable 
http://www.mashable.com
Resources
Resources 
Predictive Analytics 
Big Data Big Analytics 
Web Analytics Action Hero
DEFINE GOALS/SUCCESS ESTABLISH RESOURCES TAG LINKS CREATE AN AD FOLLOW USERS REPORT AND DELIVER 
In Action
Define Purpose 
Primary Goals 
• Get 25 people to sign up for campus info session 
• 5% of website traffic coming from ad 
• Receive 10% more donations/gifts within a month 
Secondary Goals 
• Promote program awareness 
• Promote brand awareness
Define Success 
Define the KPI’s you’ll track 
Define the metric attached to that KPI 
Assign a number to define success • 5 conversions? 3 minutes average time on site? 
Define success based on: 
• Internal goals 
• Historical benchmarks (internal and external) 
• Competition
Establish Resources 
Budget or Media Buyer 
• Establish campaign budget 
Marketing 
• Write and place the ad 
IT 
• Tag and track the ad
Tag the Link 
Use Google URL Builder 
• URL 
• Campaign Source (Facebook) 
• Campaign Medium (CPC) 
• Campaign Term and Content 
• Campaign Name 
http://universitycollege.du.edu/bachelors/degree/bachelors/environmental- studies/degreeid/465?utm_medium=cpc&utm_source=facebook&utm_campaign=fb- bacp&utm_term=-&utm_content=FY14%20BACP%20Environmental%20CO
Create the Ad
Follow Users 
On Facebook 
On Google Analytics 
Numbers will be different! 
Acquisition > Campaigns > Search by “Ad Content” > Find Tagged Ad
Report 
Goal Conversion Rate 
• Users primarily converted the week before the event. 
• Users visited an average of 2.36 pages prior to conversion. 
10 conversions through use of Facebook ads at minimal cost ($0.81 average price). 
Next campaign, run multiple ads starting one week prior to event. 
Conversions 
Key Insights 
Impact 
Metric 
Action Steps
Deliver 
Marketing Director 
IT Lead 
Media Buyer 
Academic Director 
Dean
START TRACKING DATA ASAP 
DEFINE YOUR PURPOSE 
DETERMINE YOUR RESOURCES 
GET LEADERSHIP ON BOARD 
DIVE IN! 
Your Action Steps
Tracking Data 
Do you have Google Analytics or another vendor implemented on your website?
Define Purpose 
Who does your website target? What are your objectives and goals?
Define Resources 
Who owns web analytics— marketing, IT, web team, leadership? What’s your process?
Leadership 
Does leadership believe in the value of tracking analytics? Have you identified the benefits?
Dive In! 
Are you testing? Do you know your competition? Have you defined your key performance indicators? Do you have a process for reporting?
Questions? 
victoria.harben@du.edu 
@victoriaharben

Analytics in Action - UPCEA Central

  • 1.
    Analytics in Action!Data-Driven Marketing How to Create a Website Analytics Plan and Start Making Data-Driven Marketing Decisions
  • 2.
    Welcome! • TeachWeb Analytics and Social Media • Marketing & Communications at DU • UPCEA MEMS Planning Committee victoria.harben@du.edu @victoriaharben continuingedmarketing.com
  • 3.
    Expectations • Essentialcomponents of an analytics plan • Tactics for presenting data to leadership • Strategies for creating a culture of metrics • Action steps, tools, and resources
  • 4.
  • 5.
    Pop Quiz! Fora continuing education website… • Average bounce rate? • Average time on site? • Average number of visitors/month? • Day of the week with highest visitors? 45% 3:12 28,000 Tuesday Do you know your metrics? Source: JMH Consulting
  • 6.
    DEFINITIONS PURPOSE TERMS Overview What is web analytics?
  • 7.
    Web Analytics Data-drivendecision-making! The combination of marketing research and data to help meet business objectives, improve user experience, and increase ROI.
  • 8.
  • 9.
    Questions Who iscoming to my website? What do I want them to do? What are they actually doing?
  • 10.
    Audience Prospective •Marketingand promotional •Process to attend, cost, deadlines Current •Resources •Schedules, registration, resources Both •Can your website appeal to both current and prospective students? And alumni?
  • 11.
    Outcomes • Everywebsite should have the same three outcomes: • Increase Revenue • Reduce Cost • Improve User Satisfaction/Loyalty
  • 12.
    Key Terms •Metric • Key Performance Indicator (KPI) • News Visitors vs. Returning Visitors • Referrer • Conversion • Exit Page • Bounce Rate
  • 13.
    Bounce Rate 010 20 30 40 50 60 70 80 90 100 <- Retail -> <- Service-> <- Content> • Single page view visits divided by entry pages. • You want a LOW bounce rate. • Typical bounce rates: Retail sites: 20-40% bounce Service sites: 10-30% bounce Content websites: 40-60% bounce
  • 14.
    OBJECTIVES/GOALS DATA COLLECTION TESTING COMPETITION REPORTING The Process
  • 15.
    Objectives/Goals Consider organizationobjectives: • Doable • Understandable • Manageable • Beneficial Consider goals (marketing & website): • Specific • Measurable • Actionable • Realistic • Time-Bound
  • 16.
    Data Quantitative Data(Clickstream) • Bounce rates, time on site, depth of visit, exit rates, conversions, etc. Qualitative Data • Usability tests, surveys, A/B split tests, multivariate testing.
  • 17.
    A/B Testing •Start with a hypothesis (i.e., a testimonial on a landing page will increase applications) • Change at least one variable • Determine how you’ll measure success • Test on a similar volume and timeframe
  • 18.
    A/B Testing Goalof the Page: Click on the Pricing Plan A
  • 19.
    A/B Testing Goalof the Page: Click on the Pricing Plan B
  • 20.
    A/B Testing •Version A - 25.3% Conversion Rate Businesses grow faster online! (original) • Version B - 47.8% Conversion Rate Create a webpage for your business.
  • 21.
    A/B Testing Goalof the Page: Add Product to Cart A
  • 22.
    A/B Testing Goalof the Page: Add Product to Cart B
  • 23.
    A/B Testing •Version A - 12.5% Conversion Rate Simple product page with a discounted price • Version B - 31.0% Conversion Rate Two different elements: A big red sticker Product name/title leading with the discount
  • 24.
    MVT • Identifythe challenge and create a hypothesis • Add variations to page • Determine how you’ll measure success
  • 25.
    Competition • “AlsoVisited” data • Referrals and destinations • Long-term traffic trends/historical data • SEO and keyword research • Industry benchmarks • Tools • Alexa, Compete, Hitwise, Comscore • Google Insights, Trends, AdWords • UserTesting.com, OpenSiteExplorer
  • 26.
    Action Dashboard BestKPIs to track for university website: • Average time on site • New vs. returning visitors • Conversions • Applying/registering for a class • Downloading a brochure • Using contact form/sending email • Spending a certain amount of time Create an action dashboard that focuses on performance, insights, and actions.
  • 27.
    Action Dashboard TheMetric Key Trends Action Steps Organizational Impact
  • 28.
    CULTURE OF METRICSANALYTICS OWNERSHIP Gaining Buy-In
  • 29.
    Who is trackingtheir own website analytics?
  • 30.
    Gaining Buy-In Fightthe resistance! • Discover why your organization has been reluctant to track analytics. Resources? Cost? Lack of understanding? Be an advocate and identify stakeholders • Find support, solve a problem for them Form relationship with IT • Have open communication and process
  • 31.
    Gaining Buy-In Learnthe university’s pain points • Enrollment? Retention? Donations? Alumni engagement? Build credibility by presenting relevant data • Show how the data impacts the organization Why is analytics necessary? • Show, don’t tell, how analytics can help the organization
  • 32.
    Ownership • Whomakes decisions? • Who makes changes to the web? • Who interprets the data? • Who has control over the budget? Marketing Leadership IT
  • 33.
    Analytics Manager Characteristics:• Passionate advocate • Flexibility • Questions data • Interested in innovation and trends • People-person/relationship-builder • Business savvy
  • 34.
    Analytics Manager Questionsto ask: • What resources/websites/blogs do you read to stay informed? • What is something coming up in the next six months that will change the world of web analytics?
  • 35.
    Vendors Consider: •Benefits (Not Just Features) • Costs • Contractual Obligations • How Data is Exported • One-on-One Resources Available • Admin Access to Tool
  • 36.
    Vendors Questions toask: • Difference between yours and free tools? • Type of offered support: 24/7, account rep? • What are you planning for the next 6 months to a year to stay ahead of competition?
  • 37.
    Resources • GoogleAnalytics • Yahoo Web Analytics • Crazy Egg ($9-$99/month) • TeaLeaf • Omniture (avg. $5k/month) • Clicktale (free-$99/month) • Sitemeter (free-$59/year) • VisiStat (starting at $50/month)
  • 38.
    Resources • DigitalAnalytics Association http://www.digitalanalyticsassociation.org • Avinash Kaushik’s Blog http://www.kaushik.net/avinash • KISS Metrics http://blog.kissmetrics.com/topics/analytics • Search Engine Watch http://searchenginewatch.com/analytics • Mashable http://www.mashable.com
  • 39.
  • 40.
    Resources Predictive Analytics Big Data Big Analytics Web Analytics Action Hero
  • 41.
    DEFINE GOALS/SUCCESS ESTABLISHRESOURCES TAG LINKS CREATE AN AD FOLLOW USERS REPORT AND DELIVER In Action
  • 42.
    Define Purpose PrimaryGoals • Get 25 people to sign up for campus info session • 5% of website traffic coming from ad • Receive 10% more donations/gifts within a month Secondary Goals • Promote program awareness • Promote brand awareness
  • 43.
    Define Success Definethe KPI’s you’ll track Define the metric attached to that KPI Assign a number to define success • 5 conversions? 3 minutes average time on site? Define success based on: • Internal goals • Historical benchmarks (internal and external) • Competition
  • 44.
    Establish Resources Budgetor Media Buyer • Establish campaign budget Marketing • Write and place the ad IT • Tag and track the ad
  • 45.
    Tag the Link Use Google URL Builder • URL • Campaign Source (Facebook) • Campaign Medium (CPC) • Campaign Term and Content • Campaign Name http://universitycollege.du.edu/bachelors/degree/bachelors/environmental- studies/degreeid/465?utm_medium=cpc&utm_source=facebook&utm_campaign=fb- bacp&utm_term=-&utm_content=FY14%20BACP%20Environmental%20CO
  • 46.
  • 47.
    Follow Users OnFacebook On Google Analytics Numbers will be different! Acquisition > Campaigns > Search by “Ad Content” > Find Tagged Ad
  • 48.
    Report Goal ConversionRate • Users primarily converted the week before the event. • Users visited an average of 2.36 pages prior to conversion. 10 conversions through use of Facebook ads at minimal cost ($0.81 average price). Next campaign, run multiple ads starting one week prior to event. Conversions Key Insights Impact Metric Action Steps
  • 49.
    Deliver Marketing Director IT Lead Media Buyer Academic Director Dean
  • 50.
    START TRACKING DATAASAP DEFINE YOUR PURPOSE DETERMINE YOUR RESOURCES GET LEADERSHIP ON BOARD DIVE IN! Your Action Steps
  • 51.
    Tracking Data Doyou have Google Analytics or another vendor implemented on your website?
  • 52.
    Define Purpose Whodoes your website target? What are your objectives and goals?
  • 53.
    Define Resources Whoowns web analytics— marketing, IT, web team, leadership? What’s your process?
  • 54.
    Leadership Does leadershipbelieve in the value of tracking analytics? Have you identified the benefits?
  • 55.
    Dive In! Areyou testing? Do you know your competition? Have you defined your key performance indicators? Do you have a process for reporting?
  • 56.