1. Course 3, Lesson 9-5
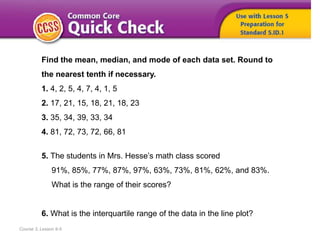
Find the mean, median, and mode of each data set. Round to
the nearest tenth if necessary.
1. 4, 2, 5, 4, 7, 4, 1, 5
2. 17, 21, 15, 18, 21, 18, 23
3. 35, 34, 39, 33, 34
4. 81, 72, 73, 72, 66, 81
5. The students in Mrs. Hesse’s math class scored
91%, 85%, 77%, 87%, 97%, 63%, 73%, 81%, 62%, and 83%.
What is the range of their scores?
6. What is the interquartile range of the data in the line plot?
5. To
• calculate the mean absolute deviation of a
data set,
• use the standard deviation of a data set
Course 3, Lesson 9-5
Statistics and Probability
6. • mean absolute deviation
• standard deviation
Course 3, Lesson 9-5
Statistics and Probability
7. 1
Need Another Example?
2
3
4
Step-by-Step Example
1. The table shows the heights of the first eight
people standing in line to ride a roller coaster.
Find the mean absolute deviation of the set of
data. Describe what the mean absolute
deviation represents.
Find the absolute value of the differences between each value in the data set
and the mean.
Find the mean.
The mean absolute deviation is 3.75. This means that the average distance
each person’s height is from the mean height is 3.75 inches.
Find the average of the absolute values of the differences between each value in
the data set and the mean.
= 56
|52 – 56| = 4 |59 – 56| = 3
|48 – 56| = 8 |54 – 56| = 2
|60 – 56| = 4 |58 – 56| = 2
|55 – 56| = 1 |62 – 56| = 6
8. Answer
Need Another Example?
The table shows the admission prices at different movie
theaters. Find the mean absolute deviation of the set of data.
Describe what the mean absolute deviation represents.
0.50; Sample answer: The average distance
each value is from the mean is $0.50.
9. 1
Need Another Example?
2
3
Step-by-Step Example
2. The standard deviation of quiz
scores for Class A is about 1.2.
Describe the quiz scores that are
within one standard deviation of
the mean.
Find the range of values that are within one standard deviation of the mean.
Find the mean.
Quiz scores that are between 7.05 and 9.45 points are within one standard
deviation of the mean.
mean = = 8.25
8.25 – 1.2 = 7.05
8.25 + 1.2 = 9.45
Subtract the standard deviation from the mean.
Add the standard deviation to the mean.
10. Answer
Need Another Example?
The standard deviation of posts on a Web site
is about 30.7. Describe the posts that are within
one standard deviation of the mean.
The number of posts that are between
145 and 206.4 are within one standard
deviation of the mean.
11. How did what you learned
today help you answer the
How are patterns used
when comparing two quantities?
Course 3, Lesson 9-5
GeometryStatistics and Probability
12. How did what you learned
today help you answer the
How are patterns used
when comparing two quantities?
Course 3, Lesson 9-5
GeometryStatistics and Probability
Sample answers:
• One pattern is the mean absolute deviation. The mean
absolute deviation describes the average distance
between each data value and the mean.
• Another pattern is the standard deviation. Most of the
data in a set fall within one standard deviation of the
mean.
13. Write a set of directions for
finding the mean absolute
deviation for a data set.
Course 3, Lesson 9-5
Ratios and Proportional RelationshipsFunctionsStatistics and Probability