IB Chemistry on ICT, 3D software, Jmol, Pymol and Rasmol for Internal Assessment
•
1 like•1,446 views

IB Chemistry on ICT, 3D software, Jmol, Pymol and Rasmol for Internal Assessment

Recommended
Recommended
More Related Content
What's hot
What's hot (11)
Viewers also liked
Viewers also liked (20)
Similar to IB Chemistry on ICT, 3D software, Jmol, Pymol and Rasmol for Internal Assessment
Similar to IB Chemistry on ICT, 3D software, Jmol, Pymol and Rasmol for Internal Assessment (20)
More from Lawrence kok
More from Lawrence kok (20)
Recently uploaded
Recently uploaded (20)
IB Chemistry on ICT, 3D software, Jmol, Pymol and Rasmol for Internal Assessment
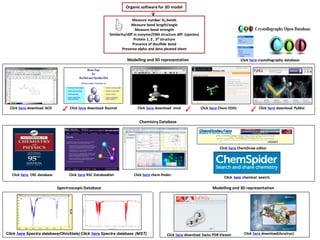
- 1. Measure number H2 bonds Measure bond length/angle Measure bond strength Similarity/diff in enzyme/DNA structure diff (species) Protein 1, 2 , 3O structure Presence of disulfide bond Presence alpha and beta pleated sheet Organic softwarefor 3D model Click here download Rasmol Click here download PyMolClick here download ACD Click here download Jmol Click here Chem EDDL Click here ChemDraw editor Click here download(Accelrys) Click here chemical search. Click here CRC database Click here RSC Databooklet Modelling and 3D representation Chemistry Database Click here Spectra database(OhioState) Click here Spectra database (NIST) Click here chem finder. Spectroscopic Database Click here download Swiss PDB Viewer Modelling and 3D representation Click here crystallography database. ✓ ✓ ✓
- 2. Measure number H2 bonds Measure bond length/angle Measure bond strength Similarity/diff in enzyme/DNA structure diff (species) Protein 1, 2 , 3O structure Presence of disulfide bond Presence alpha and beta pleated sheet Click here J mol protein video Type PDB code – 1BOU Right click – select console Select all Colour gray Select 39-46 Colour blue Right click Select proteins – by residue name – cyc Right click – Style – scheme –ball stick Right click – Select all Zoom in Measure distanceusing ruler bet cyc Chemical viewer 3D structure (Jmol) Uses molecular modelling 1 J mol executable file Console Type in above Measure distance final product final product J mol executable file 1 Designing CH3COOH molecule Open model kit Drag to bond – choose carbon Drag to bond – choose oxygen Choose double bond – cursor center Model kit – Minimize structure Choose ruler for measurement Measure bond length C = O Measure bond length C - O Model kit to design molecule Click here J mol tutorial 2 2 3 4 3 4 Click here J mol download
- 3. Measure number H2 bonds Measure bond length/angle Measure bond strength Similarity/diff in enzyme/DNA structure diff (species) Protein 1, 2 , 3O structure Presence of disulfide bond Presence alpha and beta pleated sheet J mol executable file Type -PDB ID - 4 letter code to J mol Protein Data Bank Protein database key in - PDB 4 letter code Click here - List all pdb source Click here J mol tutorial Minimise structure– (most stable form) Model kit – press minimise Click here J mol download 1 2 3 Click here - List all pdb insulin H bonds Bond length/angle Uses molecular modelling Model kit to design molecule Measure distance/angle 4 Get structure from PDB and MOL Right click to get console 1 2 3 Chemical viewer 3D structure (Jmol) Click here for pdb files 4
- 4. Measure number H2 bonds Measure bond length/angle Measure bond strength Similarity/diff in enzyme/DNA structure diff (species) Protein 1, 2 , 3O structure Presence of disulfide bond Presence alpha and beta pleated sheet Organic softwarefor 3D model (Pymol) download pdb file text 1 1 Click here - Protein Data Bank Protein database key in - PDB 4 letter code 3 Click here download PyMol Click here Pymol video tutorialClick here Pymol video tutorial Click file – open your download pdb file from Protein Data bank Get to command term – Type fetch 3CSY H - Hide – S - Show cartoon – C – Type by ss Distance bet 2 atoms Click here for pdb files 2 Press S – sequence at bottom screen. Right click – zoom in Select amino acid 1 – 60 by dragging Look 3CSY – H – hide everything Look sele – S – Show stick Wizard – Measure – select 2 atom measure distance – done Look sele – A – action – find polar contact to any atom – yellow bond 4 Uses molecular modelling 2 3
- 5. Measure number H2 bonds Measure bond length/angle Measure bond strength Similarity/diff in enzyme/DNA structure diff (species) Protein 1, 2 , 3O structure Presence of disulfide bond Presence alpha and beta pleated sheet Organic softwarefor 3D model (Rasmol) Click here resources Rasmol Click here download Rasmol RasMol - exploring structure of molecules. Stored in a PDB. (Protein Data Bank) file Go to File > Open, look PDB file you want download pdb file text 3 1 4 Click on file – open your download pdb file from Protein Data bank - (3B6F) 5 Open file – 3B6F Command term – type - restrict dna – colour blue Select – setting – pick distance – measure distance bet 2 atoms Rasmol command term Click here to view command terms 6 Click here - Protein Data Bank Protein database key in - PDB 3B6F 2 Press setting – pick bond distance and angle Zoom in – press shift and left click Select distance atoms and angles to measure Command term – type hbonds 50 – colour red Uses molecular modelling 3 Click here for pdb files
- 6. Measure number H2 bonds Measure bond length/angle Measure bond strength Similarity/diff in enzyme/DNA structure diff (species) Protein 1, 2 , 3O structure Presence of disulfide bond Presence alpha and beta pleated sheet Organic softwarefor 3D model (ACD Lab) Click here download ACD Lab Finish product in 3D viewer Uses molecular modelling 1 Draw chloromethane Press copy to 3D or press 3D viewer Measure C – CI bond length/ H – C – CI bond angle Press 3D Optimizationbefore measurement Compareit to J mol Compareit to CRC Data booklet Compareit to Chem EDDL Compute the average bond length /angle H - C - CI Measure distance Measure distanceSelect atom 1 Draw chlorobenzene Press copy to 3D or press 3D viewer Measure C – CI bond length/ bond angle Press optimizationbefore measurement Compareit to J mol Compareit to CRC Data booklet Compareit to Chem EDDL Compute the average bond length /angle Finish product in 3D viewer 22 33
- 7. Measure number H2 bonds Measure bond length/angle Measure bond strength Similarity/diff in enzyme/DNA structure diff (species) Protein 1, 2 , 3O structure Presence of disulfide bond Presence alpha and beta pleated sheet Click here download ACD Lab Finish product in 3D viewer Uses molecular modelling 1 Select tools Generate structurefrom SMILES and InChI Paste it from Protein databank Measure distance Measure bond angleSelect tools – generate structure from SMILES/InChI Draw chlorobenzene Press copy to 3D or press 3D viewer Measure C – CI bond length/ bond angle Press optimizationbefore measurement Compareit to J mol Compareit to CRC Data booklet Compareit to Chem EDDL Compute the average bond length /angle Finish product in 3D viewer Structure from SMILES Structure from InChI Click here to get in Protein Databank Select tools Calculateall properties 2 3 Generate 3D view Press 3D Optimization bef measure bond length 1 Organic softwarefor 3D model (ACD Lab) 2 3
- 8. Possible ResearchQuestion Measuring distance using 3D modelling (A=T)/(G≡C) Data Collection using 3D modelling Data Collection using Database Click here Jmol Click here PyMol Click here RasmolClick here ACD - Is H2 bond distance(A=T)/(G≡C) the same across diff species (Archaea/Eubacteria/Eukaryotic) - Is H2 bond distance (A=T)/(G≡C) the same in diff cell types Is distance H2 bond (A=T)/(G≡C) always the same bet base pair in diff cell types How H2 bond length change with changing temperature Is distance of H2 bond bet bases always the same across diff DNA species How number H2 bond affect stability of alpha helix/beta pleated protein Is H2 bond distance (A-T)/(G-C) the same in all diff cell type (liver, kidney, brain) Is H2 bond distance the same across diff species (Archaea/Eubacteria/Eukaryotic) Is H2 bond length in ice and liq water the same? If not how big is the variation? N6 –H6 ----------- O4 N1 ------------H3–N3 H2 bonding between Click here NCBI Click here UCSC Click here Ensembl Hydrogen Bonding AdenineThymine 66 4 3 cytosineguanine 4 22 O6 ----------------H4–N4 N1 - H1 ---------- N3 N2 - H2 ---------- O2 H2 bonding between H2 bond distance
- 9. Possible ResearchQuestion Data Collection using 3D modelling Data Collection using Database Click here Jmol Click here PyMol Click here RasmolClick here ACD - Is H2 bond distance(A=T)/(G≡C) the same across diff species (Archaea/Eubacteria/Eukaryotic) - Is H2 bond distance (A=T)/(G≡C) the same in diff cell types Click here NCBI Click here UCSC Click here Ensembl Hydrogen Bonding DataCollection from 3D modelling (A=T)/(G≡C) in diff cell type (liver/kidney/brain) DataCollection from Database(A=T)/(G≡C) in diff cell type (liver/kidney/brain) Bond length Jmol Pymol Rasmol Average A=T (N6 – H6 ----O4) 2.83 2.84 2.82 2.82 A=T (N1 ------H3- N3) 2.81 2.82 2.82 2.81 G≡C (O6 ---H4 – N4) 2.78 2.77 2.75 2.76 G≡C (N1 – H1 --- N3) 2.87 2.88 2.87 2.87 G≡C (N2 – H2----O2) 2.87 2.87 2.88 2.87 Bond length NCBI UCSC Esemble Average A=T (N6 – H6 ----O4) 2.85 2.84 2.84 2.84 A=T (N1 ------H3- N3) 2.80 2.80 2.82 2.80 G≡C (O6 ---H4 – N4) 2.77 2.78 2.77 2.77 G≡C (N1 – H1 --- N3) 2.88 2.88 2.87 2.88 G≡C (N2 – H2----O2) 2.89 2.90 2.90 2.90 Is distance H2 bond (A=T)/(G≡C) always the same bet base pair in diff cell types How H2 bond length change with changing temperature Is distance of H2 bond bet bases always the same across diff DNA species How number H2 bond affect stability of alpha helix/beta pleated protein Is H2 bond distance (A-T)/(G-C) the same in all diff cell type (liver, kidney, brain) Is H2 bond distance the same across diff species (Archaea/Eubacteria/Eukaryotic) Is H2 bond length in ice and liq water the same? If not how big is the variation?
- 10. Possible ResearchQuestion Data Collection using 3D modelling Data Collection using Database Click here Jmol Click here PyMol Click here RasmolClick here ACD - Is H2 bond distance(A=T)/(G≡C) the same across diff species (Archaea/Eubacteria/Eukaryotic) - Is H2 bond distance (A=T)/(G≡C) the same in diff cell types Click here NCBI Click here UCSC Click here Ensembl Hydrogen Bonding Evaluationand Limitationusing 3D modelling Must use a variety of sources/programmeto verify/validatethe validity and reliability of data collected Average is computedfrom diff software and checked with databaseto confirm. Check on methodological limitationusing 3D model. (MUST perform 3D Optimization to most stable form structure) Criticaland skeptical of result produced by computationalchemistry. Major limitationof computation,they assume non-interactingmolecule. (Ideal situation, ex molecule in vacuum or isolated state) Most appropriatemolecule are those whose coordinates are not theoreticalbut derive from experimentalstructuraldetermination (using X ray diffraction) Be carefulof predicted arrangement from simulation /3D model Datasources are supported using diff method/3D model/database Certain databaselike NIST and CRC are more reliable source Check if there is a good agreement bet CRC, diff databases and 3D model predictionbefore making conclusion Computation programmeis always based on approximationand we cannot conclusive prove anything Reflect of validity and reliability of data Is model a true representation of reality? Is distance H2 bond (A=T)/(G≡C) always the same bet base pair in diff cell types How H2 bond length change with changing temperature Is distance of H2 bond bet bases always the same across diff DNA species How number H2 bond affect stability of alpha helix/beta pleated protein Is H2 bond distance (A-T)/(G-C) the same in all diff cell type (liver, kidney, brain) Is H2 bond distance the same across diff species (Archaea/Eubacteria/Eukaryotic) Is H2 bond length in ice and liq water the same? If not how big is the variation?
- 11. Permanent dipole Polar Non Polar Temporary dipole (instantaneously induced dipole) London dispersion forces Van Der Waals’ Forces attraction Polar molecule (dipole – dipole attraction) Polar molecules due to diff in EN values Dipole/dipole interaction Electrostatic forces attraction bet molecules Dipole/dipole attraction Dipole/dipole attraction Hydrogen bonding (dipole – dipole attraction) H atom bond to electronegative atom, N, O, F Partial H+ attract to lone pair electron on N, O, F Electrostatic force attraction bet molecules involve H Intermolecular force bet molecule (IMF) Non Polar molecule (Induced dipole attraction) Random movement /distribution of electron Instantaneous negative charge on atom Induced a temporary dipole separation Electrostatic forces attraction bet molecules Non polar molecules Polar molecules Polar molecules Forces bet molecule Molecules
- 12. Hydrogen bonding (dipole – dipole attraction) H atom bond to electronegative atom, N, O, F Partial H+ attract to lone pair electron on N, O, F Electrostatic force attraction bet molecules involve H Permanent dipole Polar Non Polar Temporary dipole (instantaneously induced dipole) London dispersion forces Van Der Waals’ Forces attraction Polar molecule Polar molecules due to diff in EN values Dipole/dipole interaction Electrostatic forces attraction bet molecules Dipole/dipole attraction Dipole/dipole attraction Molecules Non Polar molecule (Induced dipole attraction) Random movement /distribution of electron Instantaneous negative charge on atom Induced a temporary dipole separation Instantaneous dipole in one atom induce a dipole in its neighbor Electrostatic forces attraction bet molecules Non polar molecules Polar molecules Polar molecules Requirement for H bonding •H atom bond to N, O, F •N, O, F - Highly electronegative/small size •Attract electron close to itself – Polarised H+ •N---H, O—H, F—H bonds VERY POLAR •Very polar H+ attract closely to lone pair on N, O, F N ---- H O ---- H F ---- H δ- δ- δ-δ+ δ-+ δ+
- 13. Types of forces/Bonding Factors affecting VDF forcesIntermolecular force bet molecule (IMF) Interaction Strength Boiling Point/C Covalent Strongest High Ionic Strong High Ion dipole Strong HIgh Dipole- dipole (H bond) Moderate High Dipole – dipole Weak Low Temporary induce dipole (London dispersion) Weakest Low Dipole – dipole attraction Induced – dipole attraction London dispersion forces Polar Non Polar All molecules have London dispersion forces due to uneven distribution of electron cloud - - - - - - - - - - - - - - - δ+δ- London dispersion forces RMM/Size Surface Area London dispersion forces Van Der Waals’ Forces attraction N N F F RMM – 38 RMM – 28 Size/ RMM increase Number electrons increase Temporary induced dipole increase Van Der Waal bet molecule increase RMM same Surface area increase Temporary induced dipole increase Van Der Waal bet molecule increase RMM –72 RMM– 72 Pentane (C5H12) Factor affecting b/p of molecules Temporary dipole attraction London dispersion force Permanent dipole attraction Dipole/dipole attraction Hydrogen bonding
- 14. Factors affecting VDF forcesFactor affecting b/p of molecules RMM/Size Surface Area N N F F RMM – 38 RMM – 28 Size/ RMM increase Number electrons increase Temporary induced dipole increase Van Der Waals bet molecule increase RMM same Surface area increase Temporary induced dipole increase Van Der Waals bet molecules increase Temporary dipole attraction London dispersion force Permanent dipole attraction Dipole/dipole attraction Hydrogen bonding H2 N2 CI2 H2O RMM 2 28 71 18 Boiling Point/C -252 -196 -34 100 Forces London force London force London force London force Dipole/dipole Hydrogen bonding - - -- -- H2 London forces N2 London forces CI2 London forces H2O London forces Dipole/dipole Hydrogen bond RMM increase - London force/VDF increase – boiling point increase - - - - -- - - -- - - - - - - Hydrogen bondingHydrogen bonding RMM lowest - boiling point highest - due to hydrogen bonding Pentane (C5H12) RMM –72 RMM– 72
- 15. HCI HBr HI HF RMM 36.5 81 128 20 Boiling Point/C -85 -66 -35 19.5 Forces London force/VDF London force/VDF London force/VDF London force/VDF Dipole/dipole Hydrogen bond RMM increase - London force/VDF increase – boiling point increase Which liquid has higher boiling point? H H H H H H DNA Br Br Br I I I Hydrogen bonding RMM lowest - boiling point highest - due to hydrogen bonding Br2 ICI RMM 162 162 B/p/C 58 97 Forces London force/VDF London force/VDF Dipole/dipole Which liquid has higher boiling point? - - - - - - Br2 London forces bet molecules Br Br Br Br I I ICI CI CI+ + +- - - ICI London forces + Dipole –dipole attraction Hydrogen Bond bet nitrogenous base