Pragmatic Approach to Data Science
•Download as PPTX, PDF•
0 likes•124 views

Pragmatic Approach to Data Science

Recommended
More Related Content
What's hot
What's hot (20)
Similar to Pragmatic Approach to Data Science
Similar to Pragmatic Approach to Data Science (20)
More from Kanchana Weerasinghe
More from Kanchana Weerasinghe (14)
Recently uploaded
Recently uploaded (20)
Pragmatic Approach to Data Science
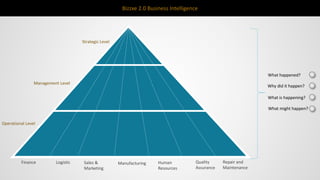
- 1. Bizzxe 2.0 Business Intelligence Finance Logistic Sales & Marketing Manufacturing Human Resources Strategic Level Management Level Operational Level What happened? Why did it happen? What is happening? What might happen? Quality Assurance Repair and Maintenance
- 2. Bizzxe Dashboard 1 Identification of target audience 2 Select right type of dashboard/s 3 Information prioritization 4 Information visualization 5 Implement & Test • Based on the target audience identification select the right dashboard/s type • Operational (what ?) Display data that facilitate the operational side of a business • Executive (What ?) Provide the KPIs (Key Performance Indicators) that a companies executive team track on a periodic (daily, weekly or monthly basis). A high-level overview of the state of the business together with the opportunities the business faces. • Analytical (What? / Why ?) Display insight on your historical, present, and predictive data. This information can be used to understand your current strategy, and determine what adjustments need to be made in the future. • Identifying user role • Identifying Responsible outcomes of role / User - KPI • Identifying Visual requirement of User / Role • Identification of information for different section in the dashboard based on criticality “ Data isn’t like your kids. You don’t have to pretend to love them equally” • Logical data grouping • Make data relevant • The whole company • By Department • Individuals • Identification of data refresh rate • Identification of most optimum data visualization component/s • Follow Gestalt Laws Proximity Similarity Continuity Figure and Ground
- 3. Bizzxe Dashboard User Role 2 User Role 3 User Role 1 Changes in EquityData SourcesKPI How often Criticality Dashboard Type Widget KPI - 01 KPI - 02
- 4. Bizzxe Analytics Diagnostic Predictive Prescriptive Descriptive Finance Logistic Sales & Marketing Manufacturing What is happening? How many, how often, where? Why is it happening? What exactly is the problem? What is likely to happen? What do I need to do? Human Resources Quality Assurance Repair and Maintenance
- 5. Finance Descriptive Functional Reports MIS Transactional Reports All the proper formatted output with company logo which can be used as a legal document Changes in Equity All the internally use semi-formatted report which describe the set of function and movement Income Balance sheetCash flow All the unformatted row data reports Which can be sued for analysing the current status of the company Data Gathering Template
- 6. Debtors Receipts Payments (Employees & Suppliers Cash generated from Operations Interest and Income Taxes Payment: Acquisition & Sale of Financial Assets Dividends Received Payments & Proceeds Share Issue Costs Borrowings Finance – Cash Flow CASH FLOW FROM OPERATING ACTIVITIES Repayments Disposals Investments Net Cash In-Flow Net Cash Out-Flow Intangible Assets CASH FLOW FROM INVESTING ACTIVITIES CASH FLOW FROM FINANCING ACTIVITIES PAYMENTS Share Buy Backs Share Buy Back Costs PROCEEDS Issue of Redeemable Preference Shares Issue of Perpetual Notes Debt Issue Cost Borrowings Government Loans DIVIDENDS Paid on Redeemable Preference Shares Paid to Company Owners REPAYMENT
- 7. Finance – Income Statement OPERATIONS Revenue Cost of Sales Investment Income Other Gains or Losses Finance Expenses Distribution Expenses Marketing Expenses Administration Expenses Other Expenses Share of Profit of Associates Share of Profit of Joint Venture Gain Recognized on Disposal of Interest of Former Associate Other (Describe) Tax Expenses Continuing Operations ProfitfortheYEAR Discontinued Operations Other Comprehensive Income Gain on Property Revaluation Share of other Comprehensive Income Re-measurement (Defined Benefit Obligation) Subsequent Reclassification P&L Exchange Difference on Foreign Operations Exchange Difference on Foreign Operations Fair Value Gain on available Asset Sale Gain on hedging into Cash Flow hedges Earning Per Share Basic Continuing & Discontinued Operations Diluted Basic Continuing Operations Diluted Equity Holders of the holding company Non-Controlling Interest
- 8. Finance - Balance Sheet ASSETS Property, Plant & Equipment Non-Current ASSETS Investment Goodwill Intangible Assets Investments Lease & Other Assets Inventories Current ASSETS Trade & Other Receivables Finance Lease Receivables Customer Amount Due Lease & Other Assets EQUITY Capital & Share Premiums Capital & Reserves Retained Earnings LIABILITIES Borrowings Non-Current LIABILITIES Benefit Obligation Deferred Tax Provisions Deferred Revenue Other Liabilities Trade & Other Payables Current LIABILITIES Borrowings Current Tax Liabilities Provisions Other Liabilities Assets Held for Sales (Liability association) Investments in Joint Venture Deferred Tax Assets Investments Property Current Tax Assets Cash & Bank Balances Held to Maturity Investments Issues Capital Asset Revaluation Reserve Non-Controlling Interest
- 9. Finance – Report Template FDL Viti foods Common Template Changes in EquityWhy Data SourcesReport Title How oftenReport Description Issues Criticality Size Of Report Used By Format
- 10. Logistic Descriptive Functional Reports MIS Transactional Reports All the proper formatted output with company logo which can be used as a legal document Outbound Logistic All the internally use semi-formatted report which describe the set of function and movement Purchasing Receiving Master Data Setup All the unformatted row data reports Which can be sued for analysing the current status of the company Data Gathering Template Item Receipting Item Transferring Warehouse Operation
- 11. Logistic – Master Data Setup Item Suppler Service Payment Terms HS Code UOM , UOM Control Items Brand , Item Category Customer Category Payment Terms , Trade Terms
- 12. Logistic – Purchasing PO Requisition Quotation Purchase Order Purchase Return
- 13. Logistic – Receiving Item Receiving Milk Receiving
- 14. Logistic – Item Receipting Goods Receipting Milk Receipting
- 15. Logistic – Item Transfer Internal Transfer Bin To Bin Transfer Store to Store/ Raw material Transfer
- 16. Logistic – Outbound Logistic Item Issue Supplier Return
- 17. Logistic – Warehouse Operation Stock Take Item Location Mapping Item Issue Mapping Item Reorder Level
- 18. Logistic – Report Template FDL Viti foods Common Template Changes in EquityWhy Data SourcesReport Title How oftenReport Description Issues Criticality Size Of Report Used By Format
- 19. Sales And Marketing Descriptive Functional Reports MIS Transactional Reports All the proper formatted output with company logo which can be used as a legal document All the internally use semi-formatted report which describe the set of function and movement Product Customer Sales Force All the unformatted row data reports Which can be sued for analysing the current status of the company Data Gathering Template Sales Marketing
- 20. Sales And Marketing – Sales Sales Funnel Leads Opportunity Wins Payment Outstanding Pending Pending Draft Unpaid Invoice Draft Unpaid Profitability Sales Risk Sales Performance Break-Even Analysis Competitor Sales Analysis
- 21. Sales And Marketing – Product Product Portfolio Product life cycle Introduction Growth Maturity Decline Product Price Product Distribution Rejection & Recalls Customer Feedback
- 22. Sales And Marketing – Customer Customer Portfolio Customer life cycle Introduction Growth Maturity Decline Customer Payment Customer Returns Profitability Customer Feedback
- 23. Sales And Marketing – Sales Force Sales Funnel Opportunity Wins Sales Revenue Cost of Sales Sales Volume Upselling Activity Follow-up Rate Lead Response Time Sales Commission Leads
- 24. Sales And Marketing – Marketing Market Trend Market Risk Market Share Competitor SWOT Customer Feedback Complexity Gap Marketing Attribution
- 25. Manufacturing Descriptive Functional Reports MIS Transactional Reports All the proper formatted output with company logo which can be used as a legal document All the internally use semi-formatted report which describe the set of function and movement Production Workforce All the unformatted row data reports Which can be sued for analysing the current status of the company Data Gathering Template Material
- 26. Manufacturing – Material Usage Variance Loss BOM
- 27. Manufacturing – Production Execution Closing Efficiency Time Types Monitoring Productivity Finish Goods Forecast Vs Actual Forecast Vs Actual Waste and Variance Labour Roster Update Adjustment Labour Pool Machine Shift Excess Raw material Production Planning Demand Process Order Scheduling Resource Scheduling Workforce Machine Work Center Rework
- 28. Manufacturing – Workforce Labour Cost Labour Pool Identification Allocation Adjustment
- 29. Quality Assurance Descriptive Functional Reports MIS Transactional Reports All the proper formatted output with company logo which can be used as a legal document All the internally use semi-formatted report which describe the set of function and movement Supply Chain QA Production QA All the unformatted row data reports Which can be sued for analysing the current status of the company Data Gathering Template General QA Customer Feedback
- 30. Quality Assurance – General QA QA Template and Parameter Identification Monitoring Assurance Action Approval Correction Rejection Exceptional Non Conformance
- 31. Quality Assurance – Supply Chain QA QA Template and Parameter Identification Monitoring Assurance Action Approval Correction Rejection Exceptional Non Conformance
- 32. Quality Assurance – Production QA QA Template and Parameter Identification Monitoring Assurance Action Approval Correction Rejection Exceptional Clearance Non Conformance
- 33. Manufacturing – Customer Feedback ComplaintSuggestion Product Recall
- 34. Bizzxe Analytics Predictive 1 Collect Data 4 ETL and Data Warehousing 2 Ask a sharp questions No Yes 6 Data Visualization 3 Is target data captured 5 Forecast Strengthening Forecasting Philosophies Machine Learning 5 Forecasting
- 35. Bizzxe Analytics - Forecasting Philosophies Predictive
- 36. Bizzxe Analytics - Machine Learning Predictive
- 37. Bizzxe Analytics - Forecast Strengthening Predictive
- 38. Bizzxe Analytics – Ask Shape Questions Predictive Vague Questions Sharp Questions A Question can’t be answered with number or name 1 ) What is going to happen with my stock? 2 ) How can I increase my profit? A Question can be answered with number or name 1 ) What will my stock’s sale price be next week? 2) How much capital do we need on hand to meet these requirements? 3) Which car in my fleet is going to fail first?
- 39. Finance Cash flow base analytics
- 41. Empowering for better decision making Risk Identification Trend analysis for setting up goals Manufacturing Opportunity Identification Salsas And Marketing Finance Logistics
- 42. Agenda Discount targeting •What is the probability of inducing the desired behavior with a discount Reactivation likelihood •What is the reactivation likelihood for a given customer •usage: online algorithm and static report •competitions : Acquire Valued Shoppers Challenge (evaluation: area under the ROC curve) Predicting Red Hat Business Value (evaluation: area under the ROC curve) Marketing Logistics •Demand forecasting • How many of what thing do you need and where will we need them? (Enables lean inventory and prevents out of stock situations.) • revenue impact: supports growth and militates against revenue leakage • usage: online algorithm and static report
- 43. Introduction Risk •Credit risk •Treasury or currency risk • How much capital do we need on hand to meet these requirements? •Fraud detection • predicting whether or not a transaction should be blocked because it involves some kind of fraud (eg credit card fraud) •Accounts Payable Recovery • Predicting the probably a liability can be recovered given the characteristics of the borrower and the loan •Anti-money laundering • Using machine learning and fuzzy matching to detect transactions that contradict AML legislation (such as the OFAC list)
- 44. Finance Cash flow base analytics Leading indicators
- 45. Analytics 1)Start with the business problem 2
- 46. Analytics
- 56. Boston Matrix.
- 58. Geographic Behavioural Priori Segmentation Changes in EquityWhy Business ValuesDescription Data Sheet Sales & Marketing – Customer – Customer Segmentation Uses a classification scheme based on publicly available characteristics such as industry and company size To categorize the customers in to widely known variable or classification scheme 1) Can be developed quickly and inexpensively 2) Show the basic categorization of customers Where your customers live dictates the products and services that benefit them the most 1) To identify the products and services that benefit for individual customer groups 2) To optimize the delivery pattern 3) To determine the salesforce strength 1) Product and service identification 2) Delivery pattern optimization 3) Salesforce management 4) Promotions management Dividing consumers into groups according to any of the following attributes usage, loyalties, awareness, occasions, knowledge, liking, and purchase patterns. To Understand Product usage Purchasing pattern Product awareness 1) Product and service development Insight 2) Product campaign target 3) Price determination 4) Production insight 5) Delivery insight RFM Segmentation Recency – How long ago was last purchase? (days) – Measured for “As Of Date” of data set Frequency – How many orders in analysis period (2 ½ years) – Attempting to measure engagement Monetary – What is total $ value of all orders in analysis period To identify the best customers 1) Who are my best customers? 2) Which customers are at the verge of churning? 3) Who has the potential to be converted in more profitable customers? 4) Who are lost customers that you don’t need to pay much attention to? 5) Which customers you must retain? 6) Who are your loyal customers? 7) Which group of customers is most likely to respond to your current campaign?