C05 Flowchart
•
0 likes•121 views

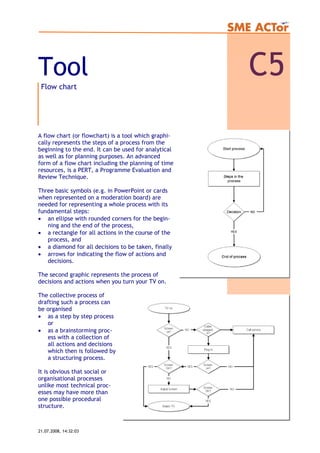
This document discusses flow charts, which are tools that graphically represent processes from beginning to end. Flow charts use basic symbols like ellipses, rectangles, diamonds, and arrows to map out actions, decisions, and the flow of a process. An advanced form is a PERT chart that also incorporates time resources. Flow charts can be used to analyze existing processes or plan new ones, and the process of drafting one can involve either step-by-step work or an initial brainstorming phase followed by structuring.

Recommended
More Related Content
What's hot
What's hot (20)
Similar to C05 Flowchart
Similar to C05 Flowchart (20)
More from TELECENTRE EUROPE
More from TELECENTRE EUROPE (20)
Recently uploaded
Recently uploaded (20)
C05 Flowchart
- 1. Tool C5Flow chart A flow chart (or flowchart) is a tool which graphi- cally represents the steps of a process from the beginning to the end. It can be used for analytical as well as for planning purposes. An advanced form of a flow chart including the planning of time resources, is a PERT, a Programme Evaluation and Review Technique. Three basic symbols (e.g. in PowerPoint or cards when represented on a moderation board) are needed for representing a whole process with its fundamental steps: • an ellipse with rounded corners for the begin- ning and the end of the process, • a rectangle for all actions in the course of the process, and • a diamond for all decisions to be taken, finally • arrows for indicating the flow of actions and decisions. The second graphic represents the process of decisions and actions when you turn your TV on. The collective process of drafting such a process can be organised • as a step by step process or • as a brainstorming proc- ess with a collection of all actions and decisions which then is followed by a structuring process. It is obvious that social or organisational processes unlike most technical proc- esses may have more than one possible procedural structure. 21.07.2008, 14:32:03