![Reliability:
Note: The contents used in this slide is being used for academic purposes only, and is intended only for students registered in B.Tech Mechanical Engineering at AKTU
Lucknow in VIII semester 2019-20, and is not intended for wider circulation.
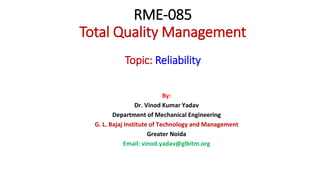
Definition of Reliability
- Quality over a long run.
• It is the ability of the product or
service to perform its intended
function over a period of time [1].
• Reliability is probability that
a product will perform its envisioned
function satisfactorily for a prescribed
life under predefined environment.
• Reliability attainment: (????)
(i) Consumer Protection Act (1986 & 2019)
(ii) Complicacy in product design
(iii) Automation
Intended
function
Environmental
conditions
Reliability
Numerical value
(0.6, 0.8, 0.9 etc.),
Life
Important Reliability factors](data:image/gif;base64,R0lGODlhAQABAIAAAAAAAP///yH5BAEAAAAALAAAAAABAAEAAAIBRAA7)
Recommended
More Related Content
What's hot
What's hot (20)
Similar to RME-085_TQM_Unit-4 (Part-2)
Similar to RME-085_TQM_Unit-4 (Part-2) (20)
Recently uploaded
Recently uploaded (20)
RME-085_TQM_Unit-4 (Part-2)
- 1. RME-085 Total Quality Management Topic: Reliability By: Dr. Vinod Kumar Yadav Department of Mechanical Engineering G. L. Bajaj Institute of Technology and Management Greater Noida Email: vinod.yadav@glbitm.org
- 2. Reliability: Note: The contents used in this slide is being used for academic purposes only, and is intended only for students registered in B.Tech Mechanical Engineering at AKTU Lucknow in VIII semester 2019-20, and is not intended for wider circulation. Definition of Reliability - Quality over a long run. • It is the ability of the product or service to perform its intended function over a period of time [1]. • Reliability is probability that a product will perform its envisioned function satisfactorily for a prescribed life under predefined environment. • Reliability attainment: (????) (i) Consumer Protection Act (1986 & 2019) (ii) Complicacy in product design (iii) Automation Intended function Environmental conditions Reliability Numerical value (0.6, 0.8, 0.9 etc.), Life Important Reliability factors
- 3. System Reliability • Complex product – more parts – chances of failure is more - The method of arranging the components affects the reliability of the entire system [1]. • Components may be arranged in – (a) Series (b) Parallel (c) Combination of series and parallel. Series arrangement: • R1, R2, and R3 are the probabilities (P1, P2 and P3 ) that components 1, 2, and 3 will work. • More components – Less reliability. System’s reliability – less than the lowest value of component’s reliability. Parallel arrangement: • (1 – R4) and (1 – R5) are the probabilities that components 4 and 5 will not function. • As the number of components in parallel increases, the reliability increases. • The reliability for a parallel arrangement of components is greater than the reliability of the individual components. RAvR1 R2 R3 Series arrangement Reliability = R1 * R2 * R3 R4 Parallel arrangement R5 R4 Combined arrangement R5 R1 R3 Reliability = 1- (1-R4) * (1-R5)
- 4. System Reliability • Series arrangement Vs Parallel arrangement: • Series: If one component fails, entire system fails. • Parallel. If one component fails, the product continues to function using another component. • Example: • Let R1 = 0.8 R2 = 0.85 R3 = 0.88 R4 = 0.89 R5 = 0.95 and R6 = 0.84 • Series system Reliability = 0.8*0.85*0.88 = 0.5984 • Parallel system reliability = 1-(1-0.89)*(1-0.95) = 0.9945 RAvR1 R2 R3 Series arrangement Reliability = R1 * R2 * R3 R4 Parallel arrangement R5 Reliability = 1- (1-R4) * (1-R5) Exercise: Find the reliability of this system Note: The contents used in this slide is being used for academic purposes only, and is intended only for students registered in B.Tech Mechanical Engineering at AKTU Lucknow in VIII semester 2019-20, and is not intended for wider circulation.
- 5. Important aspects of Reliability 1. Design: - Most important aspect. - Less component – more reliable. - Must have back up of components to tackle failure. - Overdesign (Large FOS) may be done. Production cost and reliability are strongly related. After a certain point, there is only a slight improvement in reliability for a large increase in product cost [1]. 2. Production: - Use quality management principles to improve the production and its quality - Best use of MMM must be ensured. 3. Transportation of product to customer. - Handling technique - Good packaging - Proper shipment 4. Maintenance: It adds cost but important for customer’s satisfaction. (Eg. Car maintenance). Reliability aspects Design Transportation Maintenance Production Note: The contents used in this slide is being used for academic purposes only, and is intended only for students registered in B.Tech Mechanical Engineering at AKTU Lucknow in VIII semester 2019-20, and is not intended for wider circulation.
- 6. Distributions applicable to Reliability: Note: The contents used in this slide is being used for academic purposes only, and is intended only for students registered in B.Tech Mechanical Engineering at AKTU Lucknow in VIII semester 2019-20, and is not intended for wider circulation. - Exponential distribution - Normal distribution - Weibull distribution Fig. 2 Reliability as time function [1] Exponential Normal Weibull Fig. 1 Frequency distribution as a function of time [1]
- 7. Note: The contents used in this slide is being used for academic purposes only, and is intended only for students registered in B.Tech Mechanical Engineering at UPTU Lucknow in VIII semester 2019-20, and is not intended for wider circulation. Table 1- Area under Normal curve (Adopted from Appendix a of Ref [1] Table 1 can be used to find the area under the curve, which is:
- 8. Failure Rate Curve: Note: The contents used in this slide is being used for academic purposes only, and is intended only for students registered in B.Tech Mechanical Engineering at AKTU Lucknow in VIII semester 2019-20, and is not intended for wider circulation. - Failure rate is important in describing the life history of a product. - Failure-rate curves and formulas for the exponential, normal, and Weibull distributions as a function of time are presented below. Fig. 3 Failure rate as a function of time [1] Failure rate can be estimated from test data by use of the formula The formula is applicable for the time terminated without a replacement situation. It is modified for the time- terminated with-replacement and failure-terminated situations. β= shape parameter
- 9. Failure Rate estimation: Note: The contents used in this slide is being used for academic purposes only, and is intended only for students registered in B.Tech Mechanical Engineering at AKTU Lucknow in VIII semester 2019-20, and is not intended for wider circulation. Problem 1: Determine the failure rate for an item that has the test of 9 items terminated at the end of 22 h. Four of the items failed after 4, 12, 15, and 21 h, respectively. Five items were still operating at the end of 22 h. (Time terminated without replacement) Ans: Time terminated with replacement: Problem 2: Determine the failure rate for 50 items that are tested for 15 h. When a failure occurs, the item is replaced with another unit. At the end of 15 h, 6 of the items had failed. Solution: Note that the formula was simplified because the total test time is equal to t. Problem 3 For the exponential distribution and for the Weibull distribution when β, the shape parameter, equals 1, there is a constant failure rate. When the failure rate is constant, the relationship between mean life and failure rate is as follows:
- 10. Failure Rate estimation: Note: The contents used in this slide is being used for academic purposes only, and is intended only for students registered in B.Tech Mechanical Engineering at AKTU Lucknow in VIII semester 2019-20, and is not intended for wider circulation. Problem 4: Determine the mean life for the three previous example (Problem-1, 2 and 3). Assume that there is a constant failure rate. Ans:
- 11. References: [1] Dale H. Besterfiled. A Text book on Quality Improvement. 9th Edition. Pearson (ISBN 10: 0-13-262441-9) pp: 169-184.
- 12. Thank you