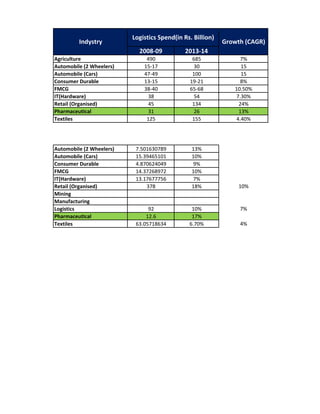
SlideShare a Scribd company logo
1 of 2
Download to read offline
Logistics Spend(in Rs. Billion)
         Indystry                                           Growth (CAGR)
                            2008‐09           2013‐14
Agriculture                    490              685               7%
Automobile (2 Wheelers)       15‐17              30               15
Automobile (Cars)             47‐49             100               15
Consumer Durable              13‐15            19‐21              8%
FMCG                          38‐40            65‐68           10.50%
IT(Hardware)                    38               54             7.30%
Retail (Organised)              45              134              24%
PharmaceutIcal                  31               26              13%
Textiles                       125              155             4.40%


Automobile (2 Wheelers)    7.501630789          13%
Automobile (Cars)          15.39465101          10%
Consumer Durable           4.870624049           9%
FMCG                       14.37268972          10%
IT(Hardware)               13.17677756           7%
Retail (Organised)             378              18%              10%
Mining
Manufacturing
Logistics                       92              10%              7%
PharmaceutIcal                 12.6             17%
Textiles                   63.05718634         6.70%             4%
Logistics        Industry Size(In 
Cost(%of             Rs.Billion)           Growth (CAGR)
Industry)      2008‐09       2013‐14
 15‐16%          6500                             2%
  5‐6%           345          636                13%
  4‐5%           708          1148               10%
  6‐7%           224          345                 9%
  6‐7%           661          1065               10%
    6%           606          890                 7%
  5‐6%           852          2024               18%
  3.60%           17           39                17%
  4.30%          2900         4000              6.70%


                           Logistics Industry
                  Year    Size in US $ bn       Growth
              2000‐01                23.8               3%
              2001‐02               24.61            3.40%
              2002‐03               26.46            7.52%
              2003‐04               30.84           16.55%
              2004‐05               35.09           13.78%
              2005‐06                38.5            9.72%
              2006‐07                41.2            7.01%
              2007‐08                49.8           20.87%
              2008‐09                  55           10.44%


              2000‐01                203                   3%
              2001‐02                213                4.93%
              2002‐03                221                3.76%
              2003‐04                240                8.60%
              2004‐05                260                8.33%
              2005‐06                323                9.00%
              2006‐07                354                9.60%
              2007‐08                387                9.32%
              2008‐09                424                9.56%

More Related Content

What's hot

2008-2011.. - Copy (2)
2008-2011.. - Copy (2)2008-2011.. - Copy (2)
2008-2011.. - Copy (2)
Anil Kapur
 

What's hot (20)

samsungbiologics 207940 Algorithm Investment Report
samsungbiologics 207940 Algorithm Investment Reportsamsungbiologics 207940 Algorithm Investment Report
samsungbiologics 207940 Algorithm Investment Report
 
tegoscience 191420 Algorithm Investment Report
tegoscience 191420 Algorithm Investment Reporttegoscience 191420 Algorithm Investment Report
tegoscience 191420 Algorithm Investment Report
 
2008-2011.. - Copy (2)
2008-2011.. - Copy (2)2008-2011.. - Copy (2)
2008-2011.. - Copy (2)
 
ecobio 038870 Algorithm Investment Report
ecobio 038870 Algorithm Investment Reportecobio 038870 Algorithm Investment Report
ecobio 038870 Algorithm Investment Report
 
ecoprobm 247540 Algorithm Investment Report
ecoprobm 247540 Algorithm Investment Reportecoprobm 247540 Algorithm Investment Report
ecoprobm 247540 Algorithm Investment Report
 
Opex
OpexOpex
Opex
 
nanoentek 039860 Algorithm Investment Report
nanoentek 039860 Algorithm Investment Reportnanoentek 039860 Algorithm Investment Report
nanoentek 039860 Algorithm Investment Report
 
sk bioland 052260 Algorithm Investment Report
sk bioland 052260 Algorithm Investment Reportsk bioland 052260 Algorithm Investment Report
sk bioland 052260 Algorithm Investment Report
 
2008-2011
2008-20112008-2011
2008-2011
 
pnctech 237750 Algorithm Investment Report
pnctech 237750 Algorithm Investment Reportpnctech 237750 Algorithm Investment Report
pnctech 237750 Algorithm Investment Report
 
An overview of the UK Hotels market #ATHotelDesign
An overview of the UK Hotels market #ATHotelDesignAn overview of the UK Hotels market #ATHotelDesign
An overview of the UK Hotels market #ATHotelDesign
 
Pinebridge 2020 Q4
Pinebridge 2020 Q4Pinebridge 2020 Q4
Pinebridge 2020 Q4
 
seegene 096530 Algorithm Investment Report
seegene 096530 Algorithm Investment Reportseegene 096530 Algorithm Investment Report
seegene 096530 Algorithm Investment Report
 
dosan heavy industries n construction 034020 Algorithm Investment Report
dosan heavy industries n construction 034020 Algorithm Investment Reportdosan heavy industries n construction 034020 Algorithm Investment Report
dosan heavy industries n construction 034020 Algorithm Investment Report
 
wonik ips 240810 Algorithm Investment Report
wonik ips 240810 Algorithm Investment Reportwonik ips 240810 Algorithm Investment Report
wonik ips 240810 Algorithm Investment Report
 
Lotte Chemical 011170 Algorithm Investment Report
Lotte Chemical 011170 Algorithm Investment ReportLotte Chemical 011170 Algorithm Investment Report
Lotte Chemical 011170 Algorithm Investment Report
 
hanall biopharma 009420 Algorithm Investment Report
hanall biopharma 009420 Algorithm Investment Reporthanall biopharma 009420 Algorithm Investment Report
hanall biopharma 009420 Algorithm Investment Report
 
boditech med 206640 Algorithm Investment Report
boditech med 206640 Algorithm Investment Reportboditech med 206640 Algorithm Investment Report
boditech med 206640 Algorithm Investment Report
 
Ind eco
Ind ecoInd eco
Ind eco
 
humasis 205470 Algorithm Investment Report
humasis 205470 Algorithm Investment Reporthumasis 205470 Algorithm Investment Report
humasis 205470 Algorithm Investment Report
 

Viewers also liked

HR_Recruitment_brochure_2014
HR_Recruitment_brochure_2014HR_Recruitment_brochure_2014
HR_Recruitment_brochure_2014
Winny Rotsidis
 
112316 이진웅
112316 이진웅112316 이진웅
112316 이진웅
LeeJinwoong
 
3. lampiran permen kur smk mak--(c)mpminat prasada.8-10 mei garuda
3. lampiran permen kur smk mak--(c)mpminat prasada.8-10 mei garuda3. lampiran permen kur smk mak--(c)mpminat prasada.8-10 mei garuda
3. lampiran permen kur smk mak--(c)mpminat prasada.8-10 mei garuda
EKO SUPRIYADI
 

Viewers also liked (18)

Ravinder Tulsiani | Human resource management
Ravinder Tulsiani | Human resource management Ravinder Tulsiani | Human resource management
Ravinder Tulsiani | Human resource management
 
Nuevo presentación de microsoft office power point
Nuevo presentación de microsoft office power pointNuevo presentación de microsoft office power point
Nuevo presentación de microsoft office power point
 
HR_Recruitment_brochure_2014
HR_Recruitment_brochure_2014HR_Recruitment_brochure_2014
HR_Recruitment_brochure_2014
 
Classifica
ClassificaClassifica
Classifica
 
arquitecura de computadoras
arquitecura de computadorasarquitecura de computadoras
arquitecura de computadoras
 
Create 3D object in ms word
Create 3D object in ms wordCreate 3D object in ms word
Create 3D object in ms word
 
Laughter is the best medicine!
Laughter is the best medicine!Laughter is the best medicine!
Laughter is the best medicine!
 
Presentacion nanotecnologia
Presentacion  nanotecnologiaPresentacion  nanotecnologia
Presentacion nanotecnologia
 
Financial crisis 2008
Financial crisis 2008Financial crisis 2008
Financial crisis 2008
 
Leadership ppt
Leadership pptLeadership ppt
Leadership ppt
 
112316 이진웅
112316 이진웅112316 이진웅
112316 이진웅
 
Placenta_Waldemar
Placenta_WaldemarPlacenta_Waldemar
Placenta_Waldemar
 
Tejidos protectores_CCarrero
Tejidos protectores_CCarreroTejidos protectores_CCarrero
Tejidos protectores_CCarrero
 
Estrategia aprendizaje
Estrategia aprendizajeEstrategia aprendizaje
Estrategia aprendizaje
 
Definiciones hoteleria y gastronomia - Turismo
Definiciones hoteleria y gastronomia - TurismoDefiniciones hoteleria y gastronomia - Turismo
Definiciones hoteleria y gastronomia - Turismo
 
3. lampiran permen kur smk mak--(c)mpminat prasada.8-10 mei garuda
3. lampiran permen kur smk mak--(c)mpminat prasada.8-10 mei garuda3. lampiran permen kur smk mak--(c)mpminat prasada.8-10 mei garuda
3. lampiran permen kur smk mak--(c)mpminat prasada.8-10 mei garuda
 
Estrategias de aprendizaje.pptx
Estrategias de aprendizaje.pptxEstrategias de aprendizaje.pptx
Estrategias de aprendizaje.pptx
 
Planificador Noviembre 13 del 2015 (Grupo 86 - subgrupo 2)
Planificador Noviembre 13 del 2015 (Grupo 86 - subgrupo 2)Planificador Noviembre 13 del 2015 (Grupo 86 - subgrupo 2)
Planificador Noviembre 13 del 2015 (Grupo 86 - subgrupo 2)
 

Similar to Industry analysis

national oilwell varco Fourth Quarter 2008 Segmented Financial Data
national oilwell varco Fourth Quarter 2008 Segmented Financial Datanational oilwell varco Fourth Quarter 2008 Segmented Financial Data
national oilwell varco Fourth Quarter 2008 Segmented Financial Data
finance40
 
Impacts of economic recession on cambodia garment industries
Impacts of economic recession on cambodia garment industriesImpacts of economic recession on cambodia garment industries
Impacts of economic recession on cambodia garment industries
Narith Por
 
csx D6E96BFD-BB9B-4786-BFED-206E571130AF_AAR2009WK08_csx
csx D6E96BFD-BB9B-4786-BFED-206E571130AF_AAR2009WK08_csxcsx D6E96BFD-BB9B-4786-BFED-206E571130AF_AAR2009WK08_csx
csx D6E96BFD-BB9B-4786-BFED-206E571130AF_AAR2009WK08_csx
finance27
 
csx D6E96BFD-BB9B-4786-BFED-206E571130AF_AAR2009WK08_csx
csx D6E96BFD-BB9B-4786-BFED-206E571130AF_AAR2009WK08_csxcsx D6E96BFD-BB9B-4786-BFED-206E571130AF_AAR2009WK08_csx
csx D6E96BFD-BB9B-4786-BFED-206E571130AF_AAR2009WK08_csx
finance27
 
Analisis Horta Guinardo 2008 03 10
Analisis Horta Guinardo 2008 03 10Analisis Horta Guinardo 2008 03 10
Analisis Horta Guinardo 2008 03 10
1977bcn
 
Erin Parker Atvidcf V1
Erin Parker Atvidcf V1Erin Parker Atvidcf V1
Erin Parker Atvidcf V1
Caneskid05
 

Similar to Industry analysis (20)

Automobile industry information
Automobile industry informationAutomobile industry information
Automobile industry information
 
Fdi & Fii Final
Fdi & Fii  FinalFdi & Fii  Final
Fdi & Fii Final
 
Presentation 4Q09
Presentation 4Q09Presentation 4Q09
Presentation 4Q09
 
3Q11 Earnings Results
3Q11 Earnings Results3Q11 Earnings Results
3Q11 Earnings Results
 
national oilwell varco Fourth Quarter 2008 Segmented Financial Data
national oilwell varco Fourth Quarter 2008 Segmented Financial Datanational oilwell varco Fourth Quarter 2008 Segmented Financial Data
national oilwell varco Fourth Quarter 2008 Segmented Financial Data
 
Impacts of economic recession on cambodia garment industries
Impacts of economic recession on cambodia garment industriesImpacts of economic recession on cambodia garment industries
Impacts of economic recession on cambodia garment industries
 
Greek International Trade
Greek International TradeGreek International Trade
Greek International Trade
 
financial_statement_analysis_Adva.pptx
financial_statement_analysis_Adva.pptxfinancial_statement_analysis_Adva.pptx
financial_statement_analysis_Adva.pptx
 
csx D6E96BFD-BB9B-4786-BFED-206E571130AF_AAR2009WK08_csx
csx D6E96BFD-BB9B-4786-BFED-206E571130AF_AAR2009WK08_csxcsx D6E96BFD-BB9B-4786-BFED-206E571130AF_AAR2009WK08_csx
csx D6E96BFD-BB9B-4786-BFED-206E571130AF_AAR2009WK08_csx
 
csx D6E96BFD-BB9B-4786-BFED-206E571130AF_AAR2009WK08_csx
csx D6E96BFD-BB9B-4786-BFED-206E571130AF_AAR2009WK08_csxcsx D6E96BFD-BB9B-4786-BFED-206E571130AF_AAR2009WK08_csx
csx D6E96BFD-BB9B-4786-BFED-206E571130AF_AAR2009WK08_csx
 
Presentation 1Q12
Presentation 1Q12Presentation 1Q12
Presentation 1Q12
 
Synex Oppday Q3/55
Synex Oppday Q3/55 Synex Oppday Q3/55
Synex Oppday Q3/55
 
Investors' Meeting - 1Q09 Results
Investors' Meeting - 1Q09 ResultsInvestors' Meeting - 1Q09 Results
Investors' Meeting - 1Q09 Results
 
Dr. gert vilhelm balling
Dr. gert vilhelm ballingDr. gert vilhelm balling
Dr. gert vilhelm balling
 
Presentation 2Q12
Presentation 2Q12Presentation 2Q12
Presentation 2Q12
 
Analisis Horta Guinardo 2008 03 10
Analisis Horta Guinardo 2008 03 10Analisis Horta Guinardo 2008 03 10
Analisis Horta Guinardo 2008 03 10
 
Reporte 09 2012[1]
Reporte 09 2012[1]Reporte 09 2012[1]
Reporte 09 2012[1]
 
Call 2 t13_eng
Call 2 t13_engCall 2 t13_eng
Call 2 t13_eng
 
2분기 영문 캐피탈ir자료
2분기 영문 캐피탈ir자료2분기 영문 캐피탈ir자료
2분기 영문 캐피탈ir자료
 
Erin Parker Atvidcf V1
Erin Parker Atvidcf V1Erin Parker Atvidcf V1
Erin Parker Atvidcf V1
 

Industry analysis

  • 1. Logistics Spend(in Rs. Billion) Indystry Growth (CAGR) 2008‐09 2013‐14 Agriculture 490 685 7% Automobile (2 Wheelers) 15‐17 30 15 Automobile (Cars) 47‐49 100 15 Consumer Durable 13‐15 19‐21 8% FMCG 38‐40 65‐68 10.50% IT(Hardware) 38 54 7.30% Retail (Organised) 45 134 24% PharmaceutIcal 31 26 13% Textiles 125 155 4.40% Automobile (2 Wheelers) 7.501630789 13% Automobile (Cars) 15.39465101 10% Consumer Durable 4.870624049 9% FMCG 14.37268972 10% IT(Hardware) 13.17677756 7% Retail (Organised) 378 18% 10% Mining Manufacturing Logistics 92 10% 7% PharmaceutIcal 12.6 17% Textiles 63.05718634 6.70% 4%
  • 2. Logistics  Industry Size(In  Cost(%of  Rs.Billion) Growth (CAGR) Industry) 2008‐09 2013‐14 15‐16% 6500 2% 5‐6% 345 636 13% 4‐5% 708 1148 10% 6‐7% 224 345 9% 6‐7% 661 1065 10% 6% 606 890 7% 5‐6% 852 2024 18% 3.60% 17 39 17% 4.30% 2900 4000 6.70% Logistics Industry Year Size in US $ bn Growth 2000‐01 23.8 3% 2001‐02 24.61 3.40% 2002‐03 26.46 7.52% 2003‐04 30.84 16.55% 2004‐05 35.09 13.78% 2005‐06 38.5 9.72% 2006‐07 41.2 7.01% 2007‐08 49.8 20.87% 2008‐09 55 10.44% 2000‐01 203 3% 2001‐02 213 4.93% 2002‐03 221 3.76% 2003‐04 240 8.60% 2004‐05 260 8.33% 2005‐06 323 9.00% 2006‐07 354 9.60% 2007‐08 387 9.32% 2008‐09 424 9.56%