
Recommended
Recommended
More Related Content
What's hot
What's hot (20)
Viewers also liked
Viewers also liked (19)
Similar to 2008-2011
Similar to 2008-2011 (20)
More from Anil Kapur
2008-2011
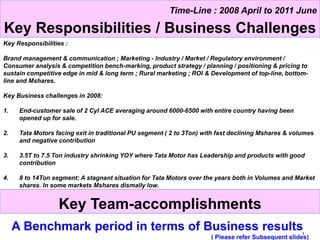
- 1. 1 A Benchmark period in terms of Business results ( Please refer Subsequent slides) Time-Line : 2008 April to 2011 June Key Responsibilities / Business Challenges Key Responsibilities : Brand management & communication ; Marketing - Industry / Market / Regulatory environment / Consumer analysis & competition bench-marking, product strategy / planning / positioning & pricing to sustain competitive edge in mid & long term ; Rural marketing ; ROI & Development of top-line, bottom- line and Mshares. Key Business challenges in 2008: 1. End-customer sale of 2 Cyl ACE averaging around 6000-6500 with entire country having been opened up for sale. 2. Tata Motors facing exit in traditional PU segment ( 2 to 3Ton) with fast declining Mshares & volumes and negative contribution 3. 3.5T to 7.5 Ton industry shrinking YOY where Tata Motor has Leadership and products with good contribution 4. 8 to 14Ton segment: A stagnant situation for Tata Motors over the years both in Volumes and Market shares. In some markets Mshares dismally low. Key Team-accomplishments
- 2. 2 Retail trend: Continuous growth Time-line : 2008-11 Market Development & Ramp-up of ACE Goods Carrier ( 2Cyl) 6000 to 14000 per month levels 31% 29% In addition, 1. Soft top Magic went up from 2750 to 4500 per month 2. Vans ( Venture & Winger) went up from 250 to 800 per month
- 3. 3 27 73 0 10 20 30 40 50 60 70 80 1.4.08 1.4.11 14.02 40.04 -24.19 -44.7 -78.88-100 -80 -60 -40 -20 0 20 40 60 06-07 07-08 08-09 09-10 10-11 39.4% 35.4% 33.5% 20.9% 13.7% 14.3% 17.1% 5.0% 35.0% 04-05 05-06 06-07 07-08 08-09 09-10 10-11 12990 7570 11068 20622 17891 20306 12171 04-05 05-06 06-07 07-08 08-09 09-10 10-11 Year of Financial Crisis. Ever increasing rate of degrowth reduced 17% Growth inspite of high 46% growth in the previous year 207 Volumes The V Curve 0.6 2.8 -13% -40% Top-line & Bottom-line Improvement Reducing the Leader-Follower Gap Additional Bottom-line Improvement Based on Q4 avg retail per month Dealer WC productivity -38% 46% 17% 207 NATIONAL MS The V Curve PU Contribution (crs) The V Curve 207 Dlr Stk : No of Days MS downslide arrested after steep decline on YOY basis for last 4 years. *Super Ace Nos not included in above charts Time-line : 2008-11 PU Turnaround ( 2 to 3Ton): A ground to look forward for Tata Motors
- 4. 4 68% 68% 64% 64% 69% 72% 72% 04-05 05-06 06-07 07-08 08-09 09-10 10-11 TML National MS Year of Financial Crisis. Ever increasing rate of degrowth reduced 17% Growth inspite of high 57% growth in the previous year Ever Highest TML Volumes: The V Curve 5 3 Increased in Year of financial crisis * 8% MS growth over last 2 yrs sustained -11% -15% -18% Top-line & Bottom-line Improvement Enhancing Leadership 16490 15590 11975 8200 07-08 08-09 09-10 10-11 Reduction in Trade Schemes (Rs/Veh)Reduced even in Year of financial crisis -32% -23% -5% -50% Net Reduction Additional Bottom-line Improvement 0 5 10 15 20 25 30 35 1.4.08 1.4.11 Dlr Stk : No. of days 33 23 Based on Q4 avg retail per month Dealer WC productivity Time-line : 2008-11 LCV Turnaround ( 3.5 to 7.5Ton) : Surprised the Industry
- 5. 5 32310 27730 24780 19000 10000 15000 20000 25000 30000 35000 07-08 08-09 09-10 10-11 19138 13249 20541 25798 0 5000 10000 15000 20000 25000 30000 07-08 08-09 09-10 10-11 23% 24% 26% 08-09 09-10 10-11 31% 36% 39% 08-09 09-10 10-11 Reduced even in Year of financial crisis - 14% - 11% - 23%- 41 % Year of financial crisis -31% 55% 26% 26% growth after 55% growth in the previous year Ever highest 5% 3% 1% 2% MS: Andhra Pradesh (AP40 initiative) Reduction in Trade SchemesVolumes MS: Tamil Nadu (TN53 initiative) Time-line : 2008-11 ICV ( 9 to 14T) gains in volumes & Mshare with reduction in marketing expense by 41%. Successful Market specific initiatives Exit MS: 2% up.
- 6. 6 Successful new product launches: Transformation from EII/ EIII to EIII/EIV of the complete range 21 new products & variants including – ACE Ex, SuperAce, Zip, Iris, Venture, RX pick-up, Xenon pick-up 1109HEX2, 1109 sleeper cab, LPK 909 27WB for kerala with HD rear axle, 407PU, CNG versions on 407,709 & 909 platforms Y1 (Ultra) Platforms at multiple tonnage points rolled out for engineering validation. Successful new initiatives institutionalized: Pioneered following innovative initiatives with short + long term impact, thereby adding to core- competencies of business ; Rural Marketing ( First time by a CV player). PCG ( Public, co-operative & Gramin) bank Financier spread RWA ( Race with ACE) 24 customized applications on ACE . Time-line: 2008 April to June 2011 New Products and Market Initiatives