More Related Content
More from videoaakash15 (20)
Ind eco
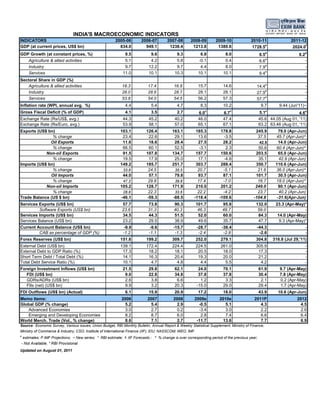
- 1. INDIA'S MACROECONOMIC INDICATORS
INDICATORS
GDP (at current prices, US$ bn)
2005-06
834.0
2006-07
949.1
2007-08
1238.4
2008-09
1213.8
2009-10
1380.6
2010-11
1728.5e
2011-12
2024.0f
GDP Growth (at constant prices, %)
Agriculture & allied activities
Industry
Services
9.5
5.1
9.7
11.0
9.6
4.2
12.2
10.1
9.3
5.8
9.7
10.3
6.8
-0.1
4.4
10.1
8.0
0.4
8.0
10.1
8.5e
6.6e
7.9e
9.4e
8.2p
-
Sectoral Share in GDP (%)
Agriculture & allied activities
Industry
Services
18.3
28.0
53.8
17.4
28.6
54.0
16.8
28.7
54.5
15.7
28.1
56.2
14.6
28.1
57.3
14.4e
e
27.9
57.7e
-
4.4
5.4
4.7
8.3
10.2
9.7
9.44 (Jun'11)~
e
6.0
46.0
65.1
e
6.7
47.4
67.1
e
178.8
-3.5
28.2
2.3
150.6
-4.6
288.4
-5.1
87.1
-7.0
201.2
-4.2
-109.6
50.6
203.5
35.1
350.7
21.6
101.7
16.7
249.0
23.7
-104.8
79.0 (Apr-Jun)
45.7 (Apr-Jun)^
14.0 (Apr-Jun)
60.4 (Apr-Jun)^
65.0 (Apr-Jun)
42.9 (Apr-Jun)
110.6 (Apr-Jun)
36.0 (Apr-Jun)^
30.5 (Apr-Jun)
18.0 (Apr-Jun)^
80.1 (Apr-Jun)
40.2 (Apr-Jun)
-31.6(Apr-Jun)
Inflation rate (WPI, annual avg. %)
Gross Fiscal Deficit (% of GDP)
e
5.1
4.6
45.6 44.05 (Aug 01, '11)
63.2 63.46 (Aug 01, '11)
4.1
3.5
2.7
Exchange Rate (Rs/US$, avg.)
Exchange Rate (Rs/Euro, avg.)
44.3
53.9
45.2
58.1
40.2
57.0
Exports (US$ bn)
% change
Oil Exports
% change
Non-oil Exports
% change
Imports (US$ bn)
% change
Oil Imports
% change
Non-oil Imports
% change
Trade Balance (US $ bn)
103.1
23.4
11.6
66.5
91.5
19.5
149.2
163.1
29.1
28.4
52.5
134.7
25.0
251.7
-46.1
126.4
22.6
18.6
60.1
107.8
17.9
185.7
24.5
57.1
29.8
128.7
22.3
-59.3
-88.5
185.3
13.6
27.5
-3.1
157.7
17.1
303.7
20.7
93.7
17.4
210.0
22.2
-118.4
Services Exports (US$ bn)
Software Exports (US$ bn)
Services Imports (US$ bn)
Services Balance (US$ bn)
57.7
23.6
34.5
23.2
73.8
31.3
44.3
29.5
90.3
40.3
51.5
38.9
101.7
46.3
52.0
49.6
95.8
49.7
60.0
35.7
132.0
59.0
84.3
47.7
23.3 (Apr-May)*
14.0 (Apr-May)
9.3 (Apr-May)*
Current Account Balance (US$ bn)
CAB as percentage of GDP (%)
-9.9
-1.2
-9.6
-1.1
-15.7
-1.3
-28.7
-2.4
-38.4
-2.8
-44.3
-2.6
-
Forex Reserves (US$ bn)
151.6
199.2
309.7
252.0
279.1
304.8
316.8 (Jul 29,'11)
External Debt (US$ bn)
External Debt to GDP Ratio (%)
Short Term Debt / Total Debt (%)
Total Debt Service Ratio (%)
139.1
17.3
14.1
10.1
172.4
18.2
16.3
4.7
224.4
18.1
20.4
4.8
224.5
20.5
19.3
4.4
261.0
18.0
20.0
5.5
305.9
17.3
21.2
4.2
-
21.5
9.0
2.6
9.9
29.8
22.8
3.8
3.2
62.1
34.8
6.6
20.3
24.0
37.8
1.2
-15.0
70.1
37.8
3.3
29.0
61.9
30.4
2.1
29.4
9.7 (Apr-May)
7.8 (Apr-May)
0.2 (Apr-May)
1.7 (Apr-May)
6.1
15.9
20.9
17.2
18.0
43.9
10.6 (Apr-Jun)
2006
5.2
3.0
8.2
8.6
2007
5.4
2.7
8.7
7.1
2008
2.9
0.2
6.0
2.7
2009e
-0.5
-3.4
2.8
-11.7
2010e
5.1
3.0
7.4
13.6
2011P
4.3
2.2
6.6
7.7
2012
4.5
2.6
6.4
6.9
Foreign Investment Inflows (US$ bn)
FDI (US$ bn)
GDRs/ADRs (US$ bn)
FIIs (net) (US$ bn)
FDI Outflows (US$ bn) (Actual)
Memo Items:
Global GDP (% change)
Advanced Economies
Emerging and Developing Economies
World Merch. Trade (Vol., % change)
33.8
44.0
47.3
105.2
28.8
35.5
79.8
39.8
171.9
33.6
245.9
37.5
42.5
Source : Economic Survey, Various issues; Union Budget, RBI Monthly Bulletin, Annual Report & Weekly Statistical Supplement; Ministry of Finance;
Ministry of Commerce & Industry; CSO; Institute of International Finance (IIF); EIU; NASSCOM; WEO, IMF.
e
estimates; P IMF Projections; ~ New series; * RBI estimate; f- IIF Forecasts ; ^ % change is over corresponding period of the previous year;
- Not Available, * RBI Provisional
Updated on August 01, 2011