SlideShare a Scribd company logo
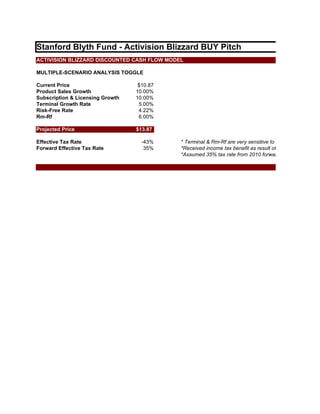
Stanford Blyth Fund - Activision Blizzard BUY Pitch
ACTIVISION BLIZZARD DISCOUNTED CASH FLOW MODEL

MULTIPLE-SCENARIO ANALYSIS TOGGLE

Current Price                      $10.87
Product Sales Growth              10.00%
Subscription & Licensing Growth   10.00%
Terminal Growth Rate               5.00%
Risk-Free Rate                     4.22%
Rm-Rf                              6.00%

Projected Price                   $13.87

Effective Tax Rate                  -43%     * Terminal & Rm-Rf are very sensitive to changes
Forward Effective Tax Rate           35%     *Received income tax benefit as result of net loss
                                             *Assumed 35% tax rate from 2010 forward
sensitive to changes
t as result of net loss
 2010 forward
Page 74
OPERATING ASSUMPTIONS
                                       Historical                                 Projected
                                   2006      2007      2008       2009     2010

REVENUE ITEMS
Product Sales                     $421      $457     $1,872    $2,059    $2,265
  Growth                                   8.55%    309.63%    10.00%    10.00%
Subscription & Licensing           597       892      1,154     1,269     1,396
  Growth                                  49.41%     29.37%    10.00%    10.00%
Total Revenue                     1,018    1,349      3,026     3,329     3,661

COGS ITEMS
Product Costs                       153      171     1,160        789       868
  % Sales                        15.03%   12.68%    38.33%     38.33%    38.33%
Software Royalties                   71       52       267        182       200
  % Sales                         6.97%    3.85%     8.82%      8.82%     8.82%
Intellectual Property Licenses       24        9       219        149       164
  % Sales                         2.36%    0.67%     7.24%      7.24%     7.24%
COGS MMORPG                         119      204       193        131       144
  % Sales                        11.69%   15.12%     6.38%      6.38%     6.38%
Total COGS                          367      436     1,839      1,251     1,377

Gross Profit                        651      913     1,187      2,077     2,285
  Margin                         63.95%   67.68%    39.23%     62.40%    62.40%

SG&A Items
Product Development                 246      397       592       $651      $716
  % Sales                        24.17%   29.43%    19.56%     19.56%    19.56%
Sales & Marketing                   147      172       464       $510      $561
  % Sales                        14.44%   12.75%    15.33%     15.33%    15.33%
Restructuring Costs                   4       (1)       93       $102      $113
  % Sales                         0.39%   -0.07%     3.07%      3.07%     3.07%
General & Administrative            133      166       271       $298      $328
  % Sales                        13.06%   12.31%     8.96%      8.96%     8.96%
Total SG&A                          530      734     1,420      1,562     1,718

Operating Profit (EBIT)             121      179       (233)      515       567
 Margin                          11.89%   13.27%     -7.70%    15.48%    15.48%

Depreciation & Amortization         39        63       385        424       466
 Margin                          3.83%     4.67%    12.72%     12.72%    12.72%

EBITDA                              160      242        152        939    1,033
 Margin                          15.72%   17.94%      5.02%     28.20%   28.20%
 Growth                                   51.25%    -37.19%    517.54%   10.00%

Capital Expenditures               (96)      (68)      (46)       (31)     (34)
 % Sales                         9.43%     5.04%     1.52%      1.52%    1.52%
Projected                     Note: Links to Cover Page in Purple
     2011     2012     2013


  $2,492    $2,741   $3,015
  10.00%    10.00%   10.00%
   1,536     1,690    1,859
  10.00%    10.00%   10.00%
   4,028     4,430    4,873


     955     1,051    1,156
  38.33%    38.33%   38.33%
     220       242      266
   8.82%     8.82%    8.82%
     180       198      218
   7.24%     7.24%    7.24%
     159       175      192
   6.38%     6.38%    6.38%
   1,514     1,666    1,832

   2,513     2,765    3,041
  62.40%    62.40%   62.40%


    $788      $867     $953
  19.56%    19.56%   19.56%
    $618      $679     $747
  15.33%    15.33%   15.33%
    $124      $136     $150
   3.07%     3.07%    3.07%
    $361      $397     $436
   8.96%     8.96%    8.96%
   1,890     2,079    2,287

     623       686      754
  15.48%    15.48%   15.48%

     512       564      620
  12.72%    12.72%   12.72%

   1,136     1,249    1,374
  28.20%    28.20%   28.20%
  10.00%    10.00%   10.00%

     (38)     (42)     (46)
   1.52%    1.52%    1.52%
Page 72
WORKING CAPITAL ASSUMPTIONS
Cash Impact of Working Capital

                                                     Historical
                                                     2007       2008
Working Capital Assets
Accounts Receivable                                    112    1,210
Inventories                                             21      262
Software Development & Intellectual Prop Licenses       25      235
  % Sales                                               2%       8%
Other Working Capital Assets                            23      201
  % Sales                                            1.70%    6.64%

Working Capital Liabilities
Deferred Revenues                                      197      923
  % COGS                                            45.18%   50.19%
Accounts Payable                                        49      555
  % COGS                                            11.24%   30.18%
Accrued Expenses & Other Liabilities                   282      842
  % COGS                                            64.68%   45.79%

Ratios
Days Receivable (AR / (Total Sales/365) )            30.30   145.95
Inventory Turns (Total COGS / Inventory)             20.76     7.02

Working Capital
Working Capital                                      (347)     (412)
Change in Working Capital                                       (65)
"Less" Change in Working Capital                                 65
Projected
  2009     2010    2011      2012     2013

  804      884      972    1,070    1,177
  127      139      153      169      185
  259      284      313      344      378
   8%       8%       8%       8%       8%
  221      243      267      294      324
6.64%    6.64%    6.64%    6.64%    6.64%


   628      691      760      836      920
50.19%   50.19%   50.19%   50.19%   50.19%
   378      415      457      503      553
30.18%   30.18%   30.18%   30.18%   30.18%
   573      630      693      763      839
45.79%   45.79%   45.79%   45.79%   45.79%


 88.13    88.13    88.13    88.13    88.13
 13.89    13.89    13.89    13.89    13.89


 (169)    (186)    (204)    (225)    (247)
  243      (17)     (19)     (20)     (22)
 (243)      17       19       20       22
VALUATION - DISCOUNTED CASH FLOW METHOD

                                                      Historical
                                               2006        2007       2008

Free Cash Flow Calculation

EBITDA                                         160          242        152
Less: Taxes on EBITDA                           69          104         65
Less: Capex                                    (96)         (68)       (46)
Add: Working Capital Impact                       -          65       (243)

Unlevered Free Cash Flow                                   $343       $(72)

Discounted Cash Flow

DCF Enterprise Value Calculation

Terminal Value Calculation
Terminal Growth Rate                   5.00%
Terminal Enterprise Value          20,431.07
Discounted Terminal Value          14,917.75

Enterprise Value                   18,128.93
Enterprise Value Net Debt          18,128.93
Share Price                           $13.87

Discount Rate (WACC)                  8.18%           *Company has not utilized debt financing p
  Current Price                        10.87
  Shares Outstanding                  1,307
  Equity (Market Cap)                14,207
  Debt + Equity                      14,207
  Cost of Equity                      8.18%
  Equity/Value                      100.00%
  Cost of Debt                        7.08%
  Debt                                     0
  Debt/Value                          0.00%
  Tax Rate                             -43%

Cost of Equity (CAPM)                 8.18%
 Risk-Free Rate                       4.22%
 Beta                                   0.66
 Rm-Rf                                6.00%
Projected                      Terminal
                   2009        2010          2011     2012     2013
                      0           1              2       3        4               5


                    939      1,033          1,136    1,249    1,374
                    404        444           (398)    (437)    (481)
                    (31)       (34)           (38)     (42)     (46)
                     17         19             20       22         -

                $1,328      $1,461          $721     $793     $847

                $1,328      $1,350          $616     $626     $619         $650


y has not utilized debt financing p58

More Related Content

What's hot

AZN/ALXN
AZN/ALXNAZN/ALXN
AZN/ALXN
Franklin Monzon
 
Williams sonoma model
Williams sonoma model Williams sonoma model
Williams sonoma model
Trishala Rasya
 
dover 4Q_2005_Trend_Analysis
dover 4Q_2005_Trend_Analysisdover 4Q_2005_Trend_Analysis
dover 4Q_2005_Trend_Analysisfinance30
 
Financial Statement Analysis
Financial Statement AnalysisFinancial Statement Analysis
Financial Statement Analysismmclean487
 
Tata Motors – Ratio Analysis
Tata Motors – Ratio AnalysisTata Motors – Ratio Analysis
Tata Motors – Ratio Analysis
Jitendra
 
Venture Capitalist competition Analysis Team Lollapalooza
Venture Capitalist competition Analysis Team LollapaloozaVenture Capitalist competition Analysis Team Lollapalooza
Venture Capitalist competition Analysis Team Lollapalooza
doshihardik
 
Fluxo de Caixa caminhao 1634
Fluxo de Caixa caminhao 1634Fluxo de Caixa caminhao 1634
Fluxo de Caixa caminhao 1634
conexaologistica
 
national oilwell varco Fourth Quarter 2008 Segmented Financial Data
national oilwell varco Fourth Quarter 2008 Segmented Financial Datanational oilwell varco Fourth Quarter 2008 Segmented Financial Data
national oilwell varco Fourth Quarter 2008 Segmented Financial Datafinance40
 
Water Sense 3 2010 Income
Water Sense 3 2010 IncomeWater Sense 3 2010 Income
Water Sense 3 2010 Incomebillgraham777
 
Fluxo de Caixa Nl10
Fluxo de Caixa Nl10Fluxo de Caixa Nl10
Fluxo de Caixa Nl10
conexaologistica
 
Small Business Dec.2
Small Business Dec.2Small Business Dec.2
Small Business Dec.2
JMcaninch
 
Excel Model for Valuation of Natural Gas Firm
Excel Model for Valuation of Natural Gas FirmExcel Model for Valuation of Natural Gas Firm
Excel Model for Valuation of Natural Gas Firm
Flevy.com Best Practices
 
Strategic Valuation of Pizza Market leaders
Strategic Valuation of Pizza Market leadersStrategic Valuation of Pizza Market leaders
Strategic Valuation of Pizza Market leaders
axvacho
 
OdontoPrev ODPV3.BZ - 1Q12
OdontoPrev ODPV3.BZ - 1Q12OdontoPrev ODPV3.BZ - 1Q12
OdontoPrev ODPV3.BZ - 1Q12Rafael Marzocchi
 
Rahul Mehrotra Presentation on Reliance Financial Ratio
Rahul Mehrotra Presentation on Reliance Financial RatioRahul Mehrotra Presentation on Reliance Financial Ratio
Rahul Mehrotra Presentation on Reliance Financial Ratio
INSTITUTE of TECHNOLOGY and SCIENCE(ITS) Mohan Nagar, Ghaziabad
 
Westheimer mobil station
Westheimer mobil stationWestheimer mobil station
Westheimer mobil stationnateshow
 
Ppp slideshow 8-12-12
Ppp   slideshow 8-12-12Ppp   slideshow 8-12-12
Ppp slideshow 8-12-12lizjen
 
Tata Motors Ratio Analysis
Tata Motors Ratio AnalysisTata Motors Ratio Analysis
Tata Motors Ratio Analysispurval
 

What's hot (20)

AZN/ALXN
AZN/ALXNAZN/ALXN
AZN/ALXN
 
Williams sonoma model
Williams sonoma model Williams sonoma model
Williams sonoma model
 
dover 4Q_2005_Trend_Analysis
dover 4Q_2005_Trend_Analysisdover 4Q_2005_Trend_Analysis
dover 4Q_2005_Trend_Analysis
 
Financial Statement Analysis
Financial Statement AnalysisFinancial Statement Analysis
Financial Statement Analysis
 
Tata Motors – Ratio Analysis
Tata Motors – Ratio AnalysisTata Motors – Ratio Analysis
Tata Motors – Ratio Analysis
 
Venture Capitalist competition Analysis Team Lollapalooza
Venture Capitalist competition Analysis Team LollapaloozaVenture Capitalist competition Analysis Team Lollapalooza
Venture Capitalist competition Analysis Team Lollapalooza
 
Sinteza bgc dec2009
Sinteza bgc dec2009Sinteza bgc dec2009
Sinteza bgc dec2009
 
Fluxo de Caixa caminhao 1634
Fluxo de Caixa caminhao 1634Fluxo de Caixa caminhao 1634
Fluxo de Caixa caminhao 1634
 
national oilwell varco Fourth Quarter 2008 Segmented Financial Data
national oilwell varco Fourth Quarter 2008 Segmented Financial Datanational oilwell varco Fourth Quarter 2008 Segmented Financial Data
national oilwell varco Fourth Quarter 2008 Segmented Financial Data
 
Water Sense 3 2010 Income
Water Sense 3 2010 IncomeWater Sense 3 2010 Income
Water Sense 3 2010 Income
 
Fluxo de Caixa Nl10
Fluxo de Caixa Nl10Fluxo de Caixa Nl10
Fluxo de Caixa Nl10
 
Small Business Dec.2
Small Business Dec.2Small Business Dec.2
Small Business Dec.2
 
Excel Model for Valuation of Natural Gas Firm
Excel Model for Valuation of Natural Gas FirmExcel Model for Valuation of Natural Gas Firm
Excel Model for Valuation of Natural Gas Firm
 
Strategic Valuation of Pizza Market leaders
Strategic Valuation of Pizza Market leadersStrategic Valuation of Pizza Market leaders
Strategic Valuation of Pizza Market leaders
 
Results tracker 16.11.11
Results tracker 16.11.11Results tracker 16.11.11
Results tracker 16.11.11
 
OdontoPrev ODPV3.BZ - 1Q12
OdontoPrev ODPV3.BZ - 1Q12OdontoPrev ODPV3.BZ - 1Q12
OdontoPrev ODPV3.BZ - 1Q12
 
Rahul Mehrotra Presentation on Reliance Financial Ratio
Rahul Mehrotra Presentation on Reliance Financial RatioRahul Mehrotra Presentation on Reliance Financial Ratio
Rahul Mehrotra Presentation on Reliance Financial Ratio
 
Westheimer mobil station
Westheimer mobil stationWestheimer mobil station
Westheimer mobil station
 
Ppp slideshow 8-12-12
Ppp   slideshow 8-12-12Ppp   slideshow 8-12-12
Ppp slideshow 8-12-12
 
Tata Motors Ratio Analysis
Tata Motors Ratio AnalysisTata Motors Ratio Analysis
Tata Motors Ratio Analysis
 

Viewers also liked

Blyth Fund Background
Blyth Fund BackgroundBlyth Fund Background
Blyth Fund BackgroundCaneskid05
 
Atvi Comps V5 2003version
Atvi Comps V5 2003versionAtvi Comps V5 2003version
Atvi Comps V5 2003versionCaneskid05
 
Atvi Comps V5 2003version
Atvi Comps V5 2003versionAtvi Comps V5 2003version
Atvi Comps V5 2003versionCaneskid05
 
Branding Looks Good Rev B
Branding Looks Good Rev BBranding Looks Good Rev B
Branding Looks Good Rev B
brikpard
 

Viewers also liked (6)

My Carssssss
My CarssssssMy Carssssss
My Carssssss
 
Blyth Fund Background
Blyth Fund BackgroundBlyth Fund Background
Blyth Fund Background
 
U1 Lesson 03
U1 Lesson 03U1 Lesson 03
U1 Lesson 03
 
Atvi Comps V5 2003version
Atvi Comps V5 2003versionAtvi Comps V5 2003version
Atvi Comps V5 2003version
 
Atvi Comps V5 2003version
Atvi Comps V5 2003versionAtvi Comps V5 2003version
Atvi Comps V5 2003version
 
Branding Looks Good Rev B
Branding Looks Good Rev BBranding Looks Good Rev B
Branding Looks Good Rev B
 

Similar to Erin Parker Atvidcf V1

Financials1 P
Financials1 PFinancials1 P
Financials1 Pemronly
 
2Q11 Presentation
2Q11 Presentation2Q11 Presentation
2Q11 PresentationGafisa RI !
 
Zappos Financials
Zappos FinancialsZappos Financials
Zappos Financials
John Mecke
 
WEG Q4 2012 Conference Call
WEG Q4 2012 Conference CallWEG Q4 2012 Conference Call
WEG Q4 2012 Conference Call
WEG
 
Abch group results booklet 2010
Abch group results booklet 2010Abch group results booklet 2010
Abch group results booklet 2010wgjlubbe
 
Gsk financial analysis
Gsk financial analysisGsk financial analysis
Gsk financial analysisMubashir Ahmed
 
Hansson
HanssonHansson
$ANF Valuation Model
$ANF Valuation Model$ANF Valuation Model
$ANF Valuation Model
Lindsay Meyer
 
Swifton CFOs LLC - Boston BizSpark presentation - Financial Projections for I...
Swifton CFOs LLC - Boston BizSpark presentation - Financial Projections for I...Swifton CFOs LLC - Boston BizSpark presentation - Financial Projections for I...
Swifton CFOs LLC - Boston BizSpark presentation - Financial Projections for I...David Fogel
 
Cfa research presentation university at buffalo
Cfa research presentation university at buffalo Cfa research presentation university at buffalo
Cfa research presentation university at buffalo
Ke Guo
 
alltel 2Q06_Supplement
alltel  2Q06_Supplementalltel  2Q06_Supplement
alltel 2Q06_Supplementfinance27
 
BBBY_AR2007_proxy_v3
BBBY_AR2007_proxy_v3BBBY_AR2007_proxy_v3
BBBY_AR2007_proxy_v3finance44
 
bed bath&beyond BBBY_AR2007_proxy_v3
bed bath&beyond BBBY_AR2007_proxy_v3bed bath&beyond BBBY_AR2007_proxy_v3
bed bath&beyond BBBY_AR2007_proxy_v3finance44
 
Swifton CFOs - McCarter English - Fin Proj 100511
Swifton CFOs - McCarter English - Fin Proj 100511Swifton CFOs - McCarter English - Fin Proj 100511
Swifton CFOs - McCarter English - Fin Proj 100511David Fogel
 
Swifton - The Capital Network - Financial Projections
Swifton - The Capital Network - Financial ProjectionsSwifton - The Capital Network - Financial Projections
Swifton - The Capital Network - Financial Projections
David Fogel
 
Valuation Of Maruti Suzuki
Valuation Of Maruti SuzukiValuation Of Maruti Suzuki
Valuation Of Maruti SuzukiAakash Singh
 
Valuation Of Maruti Suzuki
Valuation Of Maruti SuzukiValuation Of Maruti Suzuki
Valuation Of Maruti SuzukiAakash Singh
 
alltel 2Q06_Supplement
alltel  2Q06_Supplementalltel  2Q06_Supplement
alltel 2Q06_Supplementfinance27
 

Similar to Erin Parker Atvidcf V1 (20)

Financials1 P
Financials1 PFinancials1 P
Financials1 P
 
2Q11 Presentation
2Q11 Presentation2Q11 Presentation
2Q11 Presentation
 
Zappos Financials
Zappos FinancialsZappos Financials
Zappos Financials
 
WEG Q4 2012 Conference Call
WEG Q4 2012 Conference CallWEG Q4 2012 Conference Call
WEG Q4 2012 Conference Call
 
Abch group results booklet 2010
Abch group results booklet 2010Abch group results booklet 2010
Abch group results booklet 2010
 
Gsk financial analysis
Gsk financial analysisGsk financial analysis
Gsk financial analysis
 
Hansson
HanssonHansson
Hansson
 
Ppt ideko spx_team
Ppt ideko spx_teamPpt ideko spx_team
Ppt ideko spx_team
 
$ANF Valuation Model
$ANF Valuation Model$ANF Valuation Model
$ANF Valuation Model
 
Swifton CFOs LLC - Boston BizSpark presentation - Financial Projections for I...
Swifton CFOs LLC - Boston BizSpark presentation - Financial Projections for I...Swifton CFOs LLC - Boston BizSpark presentation - Financial Projections for I...
Swifton CFOs LLC - Boston BizSpark presentation - Financial Projections for I...
 
Cfa research presentation university at buffalo
Cfa research presentation university at buffalo Cfa research presentation university at buffalo
Cfa research presentation university at buffalo
 
alltel 2Q06_Supplement
alltel  2Q06_Supplementalltel  2Q06_Supplement
alltel 2Q06_Supplement
 
BBBY_AR2007_proxy_v3
BBBY_AR2007_proxy_v3BBBY_AR2007_proxy_v3
BBBY_AR2007_proxy_v3
 
bed bath&beyond BBBY_AR2007_proxy_v3
bed bath&beyond BBBY_AR2007_proxy_v3bed bath&beyond BBBY_AR2007_proxy_v3
bed bath&beyond BBBY_AR2007_proxy_v3
 
APIMEC - 4Q08 Results
APIMEC - 4Q08 ResultsAPIMEC - 4Q08 Results
APIMEC - 4Q08 Results
 
Swifton CFOs - McCarter English - Fin Proj 100511
Swifton CFOs - McCarter English - Fin Proj 100511Swifton CFOs - McCarter English - Fin Proj 100511
Swifton CFOs - McCarter English - Fin Proj 100511
 
Swifton - The Capital Network - Financial Projections
Swifton - The Capital Network - Financial ProjectionsSwifton - The Capital Network - Financial Projections
Swifton - The Capital Network - Financial Projections
 
Valuation Of Maruti Suzuki
Valuation Of Maruti SuzukiValuation Of Maruti Suzuki
Valuation Of Maruti Suzuki
 
Valuation Of Maruti Suzuki
Valuation Of Maruti SuzukiValuation Of Maruti Suzuki
Valuation Of Maruti Suzuki
 
alltel 2Q06_Supplement
alltel  2Q06_Supplementalltel  2Q06_Supplement
alltel 2Q06_Supplement
 

Recently uploaded

The Evolution of Non-Banking Financial Companies (NBFCs) in India: Challenges...
The Evolution of Non-Banking Financial Companies (NBFCs) in India: Challenges...The Evolution of Non-Banking Financial Companies (NBFCs) in India: Challenges...
The Evolution of Non-Banking Financial Companies (NBFCs) in India: Challenges...
beulahfernandes8
 
when will pi network coin be available on crypto exchange.
when will pi network coin be available on crypto exchange.when will pi network coin be available on crypto exchange.
when will pi network coin be available on crypto exchange.
DOT TECH
 
what is the future of Pi Network currency.
what is the future of Pi Network currency.what is the future of Pi Network currency.
what is the future of Pi Network currency.
DOT TECH
 
managementaccountingunitiv-230422140105-dd17d80b.ppt
managementaccountingunitiv-230422140105-dd17d80b.pptmanagementaccountingunitiv-230422140105-dd17d80b.ppt
managementaccountingunitiv-230422140105-dd17d80b.ppt
SuseelaPalanimuthu
 
Scope Of Macroeconomics introduction and basic theories
Scope Of Macroeconomics introduction and basic theoriesScope Of Macroeconomics introduction and basic theories
Scope Of Macroeconomics introduction and basic theories
nomankalyar153
 
how to sell pi coins on Bitmart crypto exchange
how to sell pi coins on Bitmart crypto exchangehow to sell pi coins on Bitmart crypto exchange
how to sell pi coins on Bitmart crypto exchange
DOT TECH
 
Poonawalla Fincorp and IndusInd Bank Introduce New Co-Branded Credit Card
Poonawalla Fincorp and IndusInd Bank Introduce New Co-Branded Credit CardPoonawalla Fincorp and IndusInd Bank Introduce New Co-Branded Credit Card
Poonawalla Fincorp and IndusInd Bank Introduce New Co-Branded Credit Card
nickysharmasucks
 
how to sell pi coins in South Korea profitably.
how to sell pi coins in South Korea profitably.how to sell pi coins in South Korea profitably.
how to sell pi coins in South Korea profitably.
DOT TECH
 
GeM ppt in railway for presentation on gem
GeM ppt in railway  for presentation on gemGeM ppt in railway  for presentation on gem
GeM ppt in railway for presentation on gem
CwierAsn
 
Webinar Exploring DORA for Fintechs - Simont Braun
Webinar Exploring DORA for Fintechs - Simont BraunWebinar Exploring DORA for Fintechs - Simont Braun
Webinar Exploring DORA for Fintechs - Simont Braun
FinTech Belgium
 
Empowering the Unbanked: The Vital Role of NBFCs in Promoting Financial Inclu...
Empowering the Unbanked: The Vital Role of NBFCs in Promoting Financial Inclu...Empowering the Unbanked: The Vital Role of NBFCs in Promoting Financial Inclu...
Empowering the Unbanked: The Vital Role of NBFCs in Promoting Financial Inclu...
Vighnesh Shashtri
 
Introduction to Indian Financial System ()
Introduction to Indian Financial System ()Introduction to Indian Financial System ()
Introduction to Indian Financial System ()
Avanish Goel
 
Isios-2024-Professional-Independent-Trustee-Survey.pdf
Isios-2024-Professional-Independent-Trustee-Survey.pdfIsios-2024-Professional-Independent-Trustee-Survey.pdf
Isios-2024-Professional-Independent-Trustee-Survey.pdf
Henry Tapper
 
USDA Loans in California: A Comprehensive Overview.pptx
USDA Loans in California: A Comprehensive Overview.pptxUSDA Loans in California: A Comprehensive Overview.pptx
USDA Loans in California: A Comprehensive Overview.pptx
marketing367770
 
The new type of smart, sustainable entrepreneurship and the next day | Europe...
The new type of smart, sustainable entrepreneurship and the next day | Europe...The new type of smart, sustainable entrepreneurship and the next day | Europe...
The new type of smart, sustainable entrepreneurship and the next day | Europe...
Antonis Zairis
 
Turin Startup Ecosystem 2024 - Ricerca sulle Startup e il Sistema dell'Innov...
Turin Startup Ecosystem 2024  - Ricerca sulle Startup e il Sistema dell'Innov...Turin Startup Ecosystem 2024  - Ricerca sulle Startup e il Sistema dell'Innov...
Turin Startup Ecosystem 2024 - Ricerca sulle Startup e il Sistema dell'Innov...
Quotidiano Piemontese
 
US Economic Outlook - Being Decided - M Capital Group August 2021.pdf
US Economic Outlook - Being Decided - M Capital Group August 2021.pdfUS Economic Outlook - Being Decided - M Capital Group August 2021.pdf
US Economic Outlook - Being Decided - M Capital Group August 2021.pdf
pchutichetpong
 
what is a pi whale and how to access one.
what is a pi whale and how to access one.what is a pi whale and how to access one.
what is a pi whale and how to access one.
DOT TECH
 
Intro_Economics_ GPresentation Week 4.pptx
Intro_Economics_ GPresentation Week 4.pptxIntro_Economics_ GPresentation Week 4.pptx
Intro_Economics_ GPresentation Week 4.pptx
shetivia
 
Chương 6. Ancol - phenol - ether (1).pdf
Chương 6. Ancol - phenol - ether (1).pdfChương 6. Ancol - phenol - ether (1).pdf
Chương 6. Ancol - phenol - ether (1).pdf
va2132004
 

Recently uploaded (20)

The Evolution of Non-Banking Financial Companies (NBFCs) in India: Challenges...
The Evolution of Non-Banking Financial Companies (NBFCs) in India: Challenges...The Evolution of Non-Banking Financial Companies (NBFCs) in India: Challenges...
The Evolution of Non-Banking Financial Companies (NBFCs) in India: Challenges...
 
when will pi network coin be available on crypto exchange.
when will pi network coin be available on crypto exchange.when will pi network coin be available on crypto exchange.
when will pi network coin be available on crypto exchange.
 
what is the future of Pi Network currency.
what is the future of Pi Network currency.what is the future of Pi Network currency.
what is the future of Pi Network currency.
 
managementaccountingunitiv-230422140105-dd17d80b.ppt
managementaccountingunitiv-230422140105-dd17d80b.pptmanagementaccountingunitiv-230422140105-dd17d80b.ppt
managementaccountingunitiv-230422140105-dd17d80b.ppt
 
Scope Of Macroeconomics introduction and basic theories
Scope Of Macroeconomics introduction and basic theoriesScope Of Macroeconomics introduction and basic theories
Scope Of Macroeconomics introduction and basic theories
 
how to sell pi coins on Bitmart crypto exchange
how to sell pi coins on Bitmart crypto exchangehow to sell pi coins on Bitmart crypto exchange
how to sell pi coins on Bitmart crypto exchange
 
Poonawalla Fincorp and IndusInd Bank Introduce New Co-Branded Credit Card
Poonawalla Fincorp and IndusInd Bank Introduce New Co-Branded Credit CardPoonawalla Fincorp and IndusInd Bank Introduce New Co-Branded Credit Card
Poonawalla Fincorp and IndusInd Bank Introduce New Co-Branded Credit Card
 
how to sell pi coins in South Korea profitably.
how to sell pi coins in South Korea profitably.how to sell pi coins in South Korea profitably.
how to sell pi coins in South Korea profitably.
 
GeM ppt in railway for presentation on gem
GeM ppt in railway  for presentation on gemGeM ppt in railway  for presentation on gem
GeM ppt in railway for presentation on gem
 
Webinar Exploring DORA for Fintechs - Simont Braun
Webinar Exploring DORA for Fintechs - Simont BraunWebinar Exploring DORA for Fintechs - Simont Braun
Webinar Exploring DORA for Fintechs - Simont Braun
 
Empowering the Unbanked: The Vital Role of NBFCs in Promoting Financial Inclu...
Empowering the Unbanked: The Vital Role of NBFCs in Promoting Financial Inclu...Empowering the Unbanked: The Vital Role of NBFCs in Promoting Financial Inclu...
Empowering the Unbanked: The Vital Role of NBFCs in Promoting Financial Inclu...
 
Introduction to Indian Financial System ()
Introduction to Indian Financial System ()Introduction to Indian Financial System ()
Introduction to Indian Financial System ()
 
Isios-2024-Professional-Independent-Trustee-Survey.pdf
Isios-2024-Professional-Independent-Trustee-Survey.pdfIsios-2024-Professional-Independent-Trustee-Survey.pdf
Isios-2024-Professional-Independent-Trustee-Survey.pdf
 
USDA Loans in California: A Comprehensive Overview.pptx
USDA Loans in California: A Comprehensive Overview.pptxUSDA Loans in California: A Comprehensive Overview.pptx
USDA Loans in California: A Comprehensive Overview.pptx
 
The new type of smart, sustainable entrepreneurship and the next day | Europe...
The new type of smart, sustainable entrepreneurship and the next day | Europe...The new type of smart, sustainable entrepreneurship and the next day | Europe...
The new type of smart, sustainable entrepreneurship and the next day | Europe...
 
Turin Startup Ecosystem 2024 - Ricerca sulle Startup e il Sistema dell'Innov...
Turin Startup Ecosystem 2024  - Ricerca sulle Startup e il Sistema dell'Innov...Turin Startup Ecosystem 2024  - Ricerca sulle Startup e il Sistema dell'Innov...
Turin Startup Ecosystem 2024 - Ricerca sulle Startup e il Sistema dell'Innov...
 
US Economic Outlook - Being Decided - M Capital Group August 2021.pdf
US Economic Outlook - Being Decided - M Capital Group August 2021.pdfUS Economic Outlook - Being Decided - M Capital Group August 2021.pdf
US Economic Outlook - Being Decided - M Capital Group August 2021.pdf
 
what is a pi whale and how to access one.
what is a pi whale and how to access one.what is a pi whale and how to access one.
what is a pi whale and how to access one.
 
Intro_Economics_ GPresentation Week 4.pptx
Intro_Economics_ GPresentation Week 4.pptxIntro_Economics_ GPresentation Week 4.pptx
Intro_Economics_ GPresentation Week 4.pptx
 
Chương 6. Ancol - phenol - ether (1).pdf
Chương 6. Ancol - phenol - ether (1).pdfChương 6. Ancol - phenol - ether (1).pdf
Chương 6. Ancol - phenol - ether (1).pdf
 

Erin Parker Atvidcf V1

  • 1. Stanford Blyth Fund - Activision Blizzard BUY Pitch ACTIVISION BLIZZARD DISCOUNTED CASH FLOW MODEL MULTIPLE-SCENARIO ANALYSIS TOGGLE Current Price $10.87 Product Sales Growth 10.00% Subscription & Licensing Growth 10.00% Terminal Growth Rate 5.00% Risk-Free Rate 4.22% Rm-Rf 6.00% Projected Price $13.87 Effective Tax Rate -43% * Terminal & Rm-Rf are very sensitive to changes Forward Effective Tax Rate 35% *Received income tax benefit as result of net loss *Assumed 35% tax rate from 2010 forward
  • 2. sensitive to changes t as result of net loss 2010 forward
  • 3. Page 74 OPERATING ASSUMPTIONS Historical Projected 2006 2007 2008 2009 2010 REVENUE ITEMS Product Sales $421 $457 $1,872 $2,059 $2,265 Growth 8.55% 309.63% 10.00% 10.00% Subscription & Licensing 597 892 1,154 1,269 1,396 Growth 49.41% 29.37% 10.00% 10.00% Total Revenue 1,018 1,349 3,026 3,329 3,661 COGS ITEMS Product Costs 153 171 1,160 789 868 % Sales 15.03% 12.68% 38.33% 38.33% 38.33% Software Royalties 71 52 267 182 200 % Sales 6.97% 3.85% 8.82% 8.82% 8.82% Intellectual Property Licenses 24 9 219 149 164 % Sales 2.36% 0.67% 7.24% 7.24% 7.24% COGS MMORPG 119 204 193 131 144 % Sales 11.69% 15.12% 6.38% 6.38% 6.38% Total COGS 367 436 1,839 1,251 1,377 Gross Profit 651 913 1,187 2,077 2,285 Margin 63.95% 67.68% 39.23% 62.40% 62.40% SG&A Items Product Development 246 397 592 $651 $716 % Sales 24.17% 29.43% 19.56% 19.56% 19.56% Sales & Marketing 147 172 464 $510 $561 % Sales 14.44% 12.75% 15.33% 15.33% 15.33% Restructuring Costs 4 (1) 93 $102 $113 % Sales 0.39% -0.07% 3.07% 3.07% 3.07% General & Administrative 133 166 271 $298 $328 % Sales 13.06% 12.31% 8.96% 8.96% 8.96% Total SG&A 530 734 1,420 1,562 1,718 Operating Profit (EBIT) 121 179 (233) 515 567 Margin 11.89% 13.27% -7.70% 15.48% 15.48% Depreciation & Amortization 39 63 385 424 466 Margin 3.83% 4.67% 12.72% 12.72% 12.72% EBITDA 160 242 152 939 1,033 Margin 15.72% 17.94% 5.02% 28.20% 28.20% Growth 51.25% -37.19% 517.54% 10.00% Capital Expenditures (96) (68) (46) (31) (34) % Sales 9.43% 5.04% 1.52% 1.52% 1.52%
  • 4. Projected Note: Links to Cover Page in Purple 2011 2012 2013 $2,492 $2,741 $3,015 10.00% 10.00% 10.00% 1,536 1,690 1,859 10.00% 10.00% 10.00% 4,028 4,430 4,873 955 1,051 1,156 38.33% 38.33% 38.33% 220 242 266 8.82% 8.82% 8.82% 180 198 218 7.24% 7.24% 7.24% 159 175 192 6.38% 6.38% 6.38% 1,514 1,666 1,832 2,513 2,765 3,041 62.40% 62.40% 62.40% $788 $867 $953 19.56% 19.56% 19.56% $618 $679 $747 15.33% 15.33% 15.33% $124 $136 $150 3.07% 3.07% 3.07% $361 $397 $436 8.96% 8.96% 8.96% 1,890 2,079 2,287 623 686 754 15.48% 15.48% 15.48% 512 564 620 12.72% 12.72% 12.72% 1,136 1,249 1,374 28.20% 28.20% 28.20% 10.00% 10.00% 10.00% (38) (42) (46) 1.52% 1.52% 1.52%
  • 5. Page 72 WORKING CAPITAL ASSUMPTIONS Cash Impact of Working Capital Historical 2007 2008 Working Capital Assets Accounts Receivable 112 1,210 Inventories 21 262 Software Development & Intellectual Prop Licenses 25 235 % Sales 2% 8% Other Working Capital Assets 23 201 % Sales 1.70% 6.64% Working Capital Liabilities Deferred Revenues 197 923 % COGS 45.18% 50.19% Accounts Payable 49 555 % COGS 11.24% 30.18% Accrued Expenses & Other Liabilities 282 842 % COGS 64.68% 45.79% Ratios Days Receivable (AR / (Total Sales/365) ) 30.30 145.95 Inventory Turns (Total COGS / Inventory) 20.76 7.02 Working Capital Working Capital (347) (412) Change in Working Capital (65) "Less" Change in Working Capital 65
  • 6. Projected 2009 2010 2011 2012 2013 804 884 972 1,070 1,177 127 139 153 169 185 259 284 313 344 378 8% 8% 8% 8% 8% 221 243 267 294 324 6.64% 6.64% 6.64% 6.64% 6.64% 628 691 760 836 920 50.19% 50.19% 50.19% 50.19% 50.19% 378 415 457 503 553 30.18% 30.18% 30.18% 30.18% 30.18% 573 630 693 763 839 45.79% 45.79% 45.79% 45.79% 45.79% 88.13 88.13 88.13 88.13 88.13 13.89 13.89 13.89 13.89 13.89 (169) (186) (204) (225) (247) 243 (17) (19) (20) (22) (243) 17 19 20 22
  • 7. VALUATION - DISCOUNTED CASH FLOW METHOD Historical 2006 2007 2008 Free Cash Flow Calculation EBITDA 160 242 152 Less: Taxes on EBITDA 69 104 65 Less: Capex (96) (68) (46) Add: Working Capital Impact - 65 (243) Unlevered Free Cash Flow $343 $(72) Discounted Cash Flow DCF Enterprise Value Calculation Terminal Value Calculation Terminal Growth Rate 5.00% Terminal Enterprise Value 20,431.07 Discounted Terminal Value 14,917.75 Enterprise Value 18,128.93 Enterprise Value Net Debt 18,128.93 Share Price $13.87 Discount Rate (WACC) 8.18% *Company has not utilized debt financing p Current Price 10.87 Shares Outstanding 1,307 Equity (Market Cap) 14,207 Debt + Equity 14,207 Cost of Equity 8.18% Equity/Value 100.00% Cost of Debt 7.08% Debt 0 Debt/Value 0.00% Tax Rate -43% Cost of Equity (CAPM) 8.18% Risk-Free Rate 4.22% Beta 0.66 Rm-Rf 6.00%
  • 8. Projected Terminal 2009 2010 2011 2012 2013 0 1 2 3 4 5 939 1,033 1,136 1,249 1,374 404 444 (398) (437) (481) (31) (34) (38) (42) (46) 17 19 20 22 - $1,328 $1,461 $721 $793 $847 $1,328 $1,350 $616 $626 $619 $650 y has not utilized debt financing p58