Ee w05.1 m_ 2. electricity generation _ part 4 (generation technologies)
•Download as PPT, PDF•
0 likes•581 views


Recommended
Recommended
More Related Content
What's hot
What's hot (15)
Viewers also liked
Viewers also liked (7)
Similar to Ee w05.1 m_ 2. electricity generation _ part 4 (generation technologies)
Similar to Ee w05.1 m_ 2. electricity generation _ part 4 (generation technologies) (20)
More from Silvester Van Koten
More from Silvester Van Koten (16)
Ee w05.1 m_ 2. electricity generation _ part 4 (generation technologies)
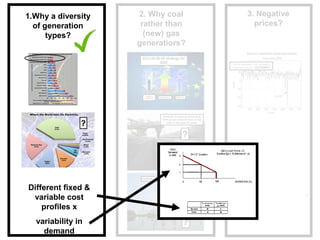
- 1. 1 2. Why coal rather than (new) gas generatiors? 1.Why a diversity of generation types? 3. Negative prices? Different fixed & variable cost profiles x variability in demand
- 3. 9 12 15 170 24 1 2 3 TIME Daily Demand in MW Load Curve
- 5. DURATION (%)100500 1 2 3 9 12 15 170 24 1 2 3 TIME Daily Demand in MW Daily Demand in MW Daily Load-Duration Curve: Duration[y] = Pr[Demand > y] Load Curve
- 6. DURATION (%)100500 9 12 15 170 24 TIME 1 2 3 1 2 3 Daily Demand in MW Daily Demand in MW Daily Load-Duration Curve: Duration[y] = Pr[Demand > y] Load Curve FIND THE MISTAKE!!!
- 7. DURATION (%)100500 9 12 15 170 24 TIME 1 2 3 1 2 3 Daily Demand in MW Daily Demand in MW Daily Load-Duration Curve: Duration[y] = Pr[Demand > y] Load Curve 33.3
- 8. DURATION (%)100500 9 12 15 170 24 TIME 1 2 3 1 2 3 Daily Demand in MW Daily Demand in MW Daily Load-Duration Curve: Duration[y] = Pr[Demand > y] Load Curve 33.3 A bit a difficult load- duration curve (and also quite a-typical)
- 9. DURATION (%)100500 9 12 15 170 24 TIME 1 2 3 1 2 3 Daily Demand in MW Daily Demand in MW Daily Load-Duration Curve: Duration[y] = Pr[Demand > y] Load Curve How to get this more typical, nicer LD curve?
- 10. DURATION (%)100500 1 2 3 9 12 15 170 24 1 2 3 TIME Daily Demand in MW Daily Demand in MW Daily Load-Duration Curve: Duration[y] = Pr[Demand > y] Load Curve
- 11. DURATION (%)100500 9 12 15 170 24 TIME 1 2 3 1 2 3 Daily Demand in MW Daily Demand in MW Daily Load-Duration Curve: Duration[y] = Pr[Demand > y] Load Curve
- 12. DURATION (%)100500 1 2 3 Fixed cost per MWh Variable cost per MWh Baseload 40 0 Peaker 10 50 Daily Demand in MW D=3-2* Duration Daily Load-Duration Curve: Duration[y] = Pr[Demand > y] Technology Costs Table
- 13. 0 60 40 Capacity factor Baseload Peaker 100%60% 10 (=8760 hours/year) Fixed cost per MWh Variable cost per MWh Baseload 40 0 Peaker 10 50 0% Cost/MWh Screening curve (Capacity-cost based) Technology Costs Table
- 14. Screening curve (Capacity-cost based) Screening curve (Energy-cost based)
- 15. 0 60 40 Capacity factor Baseload Peaker 100%60% 10 (=8760 hours/year) Fixed cost per MWh Variable cost per MWh Baseload 40 0 Peaker 10 50 0% Cost/MWh Use baseload when capacity factor > 60% Use peakers when capacity factor < 60% Screening curve (Capacity-cost based) Technology Costs Table
- 16. Install baseload when capacity factor > 60% Install peakers when capacity factor < 60% 0 60 40 Capacity factor Baseload Peaker 100%60% 10 DURATION (%)100500 1 2 3 BASELOAD D=3-2* Duration 1.8 PEAKER Daily Demand in MW 60 Daily Load-Duration Curve: Duration[y] = Pr[Demand > y] Screening curve (Capacity-cost based)
- 17. Nuclear Oil Old, inefficient plants (old Coal & OCGT) Gas (CCGT) Coal Daily Load-Duration Curve: Duration[y] = Pr[Demand > y]
- 18. 18 Fixed cost per MWh Variable cost per MWh Baseload 40 0 Peaker 10 50 DURATION (%) 100500 1 2 3 Daily Demand in MW D=3-2* Duration Load-Duration Curve Technology Costs Table Overview newly introduced curves & table 9 12 15 170 24 Daily Demand in MW 1 2 3 TIME Load Curve 0 60 40 Capacity factor Baseload Peaker 100%60% 10 0% Cost/MWh Screening curve (Capacity-cost based)
- 19. 19 This lecture
- 20. 20 DURATION (%)100500 1 2 3 BASELOAD D=3-2* Duration 1.8 PEAKER Daily Demand in MW S 50 0 0 1.81 32 DMAX P DMIN Q Supply & demand curve Daily Load-Duration Curve: Duration[y] = Pr[Demand > y] MC=0 MC=50 Uniformly distributed
- 21. 21 Nuclear Coal Gas Oil Shortage Exceptionally highVery high ModerateLow Load curve 00 05 07 10 13 15 18 24 Very Low Low Moderate Very high Exceptionally high Very LowP 0 20 30 50 P=0 P=20 P=30 P=50 P=CAP Hours 21 Price is set by the variable costs of the most expensive generator needed to meet demand Supply & demand curve
- 22. 22 Optimal Dispatch of Peakers & Missing Money
- 23. 23 DURATION (%)100500 1 2 3 BASELOAD D=3-2* Duration 1.8 PEAKER S 50 0 0 1.81 32 D P=0 P=50 Fixed cost per MWh Variable cost per MWh Baseload 40 0 Peaker 10 50 40% 60% 60 Daily Demand in MW πPEAKER=…πPEAKER=0 πPEAKER=…πPEAKER=0 P Q Daily Load-Duration Curve: Duration[y] = Pr[Demand > y] Supply & demand curve Technology Costs Table
- 24. 24 D S $/MWH 50 0 PCap Baseload plants (P=MC=0) 40% Peaker plants (P=MC=50) 60-x% 0 1.81 32 Shortage!! (P=PCap) x% PCap =?PCap =VOLL (Value Of Lost Load) the “missing money” problemzero-profit condition Supply & demand curve
- 25. 25 S 50 0 0 1.81 32 DP P=0 P=50 Fixed cost per MWh Variable cost per MWh Baseload 40 0 Peaker 10 50 40% 59.9% PCAP=10.050 0.1% πPEAKER= 0 πPEAKER= 0 πPEAKER= ≈9hrs/year zero-profit condition πPEAKER= 0.1% * 10.000= 10 Very high! Total πPEAKER=0+0+10=10 Zero-profit condition Supply & demand curve Technology Costs Table
- 26. 26 S 50 0 0 1.81 32 DP P=0 P=50 Fixed cost per MWh Variable cost per MWh Baseload 40 0 Peaker 10 50 40% 59.9% PCAP=550 0.1% πPEAKER= 0 πPEAKER= 0 πPEAKER=0.001 * 500 = 0.5 Total πPEAKER=0+0+.5 = . 5 Zero-profit condition Supply & demand curve Technology Costs Table
- 27. 27 S 50 0 0 1.81 32 DP P=0 P=50 Fixed cost per MWh Variable cost per MWh Baseload 40 0 Peaker 10 50 40% 58% PCAP=550 2% πPEAKER= 0 πPEAKER= 0 πPEAKER=0.02 * 500= 10 Total πPEAKER=0+0+10=10 Zero-profit condition Supply & demand curve Technology Costs Table
- 28. 28 S 50 0 0 1.81 32 DP P=0 P=50 Fixed cost per MWh Variable cost per MWh Baseload 40 0 Peaker 10 50 40% 58% PCAP=550 2% πPEAKER= 0 πPEAKER= 0 πPEAKER=0.02 * 500= 10 πBASE= 0 πBASE=0.58* 50 = 29 πBASE=0.02 * 550 = 11 Total πBASE=29+11 = 40 Zero-profit condition Total πPEAKER=0+0+10=10 Zero-profit condition Supply & demand curve Technology Costs Table
- 29. 29 S 50 0 0 1.81 32 DP P=0 P=50 Fixed cost per MWh Variable cost per MWh Baseload 40 0 Peaker 10 50 40% 58% PCAP=550 2% πPEAKER= 0 πPEAKER= 0 πPEAKER=0.02 * 500= 10 πBASE= 0 πBASE=0.58* 50= 29 πBASE=0.02 * 550= 11 P¯=P¯=0.4* 0 + 0.58* 50 + 0.02 + 550= ≈180 hrs/year P¯=0.4* 0 + 0.58* 50 + 0.02 + 550= 0 + 29 + 11 = 40 Total πPEAKER=0+0+10=10 Zero-profit condition Total πBASE=29+11=40 Zero-profit condition Supply & demand curve Technology Costs Table
- 30. 30 S 50 0 0 1.81 32 DP P=0 P=50 Fixed cost per MWh Variable cost per MWh Baseload 40 0 Peaker 10 50 40% 60%-x PCAP Total πPEAKER=0+0+10=10πPEAKER= 0 πPEAKER= 0 πPEAKER= x * (PCAP – MCPeaker) = 10 Peaker 10 CAP x P MC = − Peaker PeakerCAP FC x P MC = − Zero-profit condition Supply & demand curve Technology Costs Table
- 31. 31 S 50 0 0 1.81 32 DP P=0 P=50 Fixed cost per MWh Variable cost per MWh Baseload 40 0 Peaker 10 50 40% 58% P=550 2% DURATION (%)100500 1 2 3 BASELOAD D=3-2* Duration 1.8 PEAKER 60 Daily Demand in MW 2 Shortage ≈180 hrs/year Daily Load-Duration Curve: Duration[y] = Pr[Demand > y] Supply & demand curve Technology Costs Table
- 33. 33 Price spike Can be distinguished from market abuse?
- 34. 34 What can we do about price-spikes? - Lower the price-cap - Then we have lower but more frequent spikes - Capacity payments
- 35. 35
- 36. 36 0 .2 0 .4 0 .6 0 .8 1 .0 p r o b a b i l l i t y 2 4 6 d e m a n d 0 .2 0 .4 0 .6 0 .8 1 .0 p r o b a b i l l i t y 2 4 6 d e m a n d x~N(1,0.05) x~N(1,0.1) x=1 Each level * x 0 . 2 0 . 4 0 . 6 0 . 8 1 . 0 p r o b a b i l l it y 2 4 6 d e m a n d Daily Load-Duration Curve: Duration[y] = Pr[Demand > y] Daily Load-Duration Curve: Duration[y] = Pr[Demand > y] Daily Load-Duration Curve: Duration[y] = Pr[Demand > y]
- 37. 37 0 . 2 0 . 4 0 . 6 0 . 8 1 . 0 p r o b a b illit y 2 4 6 d e m a n d N: 1 unit C: 1.8 unit G: 0.2 unit O: 2.2 unit Total installed: 5.2 unit Pr[D>5.2] = = Pr[5x>5.2] = Pr[x>(5.2/5)] = Pr[x>(1.04] ≈ 21% Daily Load-Duration Curve: Duration[y] = Pr[Demand > y]
- 38. Is the “energy-only” model valid?
- 39. 39 Source: ERU Jiří Krejsa Yearly Load-Duration Curve: Duration[y] = Pr[Demand > y]
- 40. Installed power capacity 2011 (MW) Steam 10787,5 53,27% Nuclear 3970 19,60% PV 1971 9,73% Pumped-storage 1146,5 5,66% Hydro 1054,6 5,21% Gas 1101,7 5,44% Wind 218,9 1,08% Total 20250,2 100,00% Source: ERU Jiří Krejsa About 2x more capacity than peak demand!!!
- 41. • Remains of the good old times of electricity being run as state-owned Vertically Integrated Utilities (VIUs) (up to 2000) – Civil engineers “gold-plate” the system: excess generation reserves for “just-in-case” disregarding the costs – Prices calculated as average costs + an uplift for capital expenses • 1990-2000: Onset of liberalization, privatization and competition – Prices are marginal prices – Due to the excess capacity they are relatively low – Thus: no investment in new capacity • Now: “sweating” the assets Source: Helm, D. 2005. The assessment: the new energy paradigm. Oxford review of economic policy, vol. 21, no. 1
Editor's Notes
- For example, for a 1-hour outage, MISO has estimated VOLL at $730-$2510/MWh for residential, $15,000-$50,000/MWh for small commercial and industrial (“C&I”), and $16,000-$78,000/MWh for large C&I customers. The range in estimates shows the range across industries, where, for example the mining sector has a much larger VOLL than the services sector. (See MISO (2006).) Nordpool’s scarcity pricing mechanism is quite simple: if the level of available capacity is so low that TSOs must provide additional supply out of their capacity reserves, then the day-ahead price is increased to the price cap, and prices inthe intra-day and balancing markets must be as high or higher. 94 Joskow (2006a) recommends this method of setting prices equal to the price cap as a “rough and ready” mechanism for scarcity pricing. 95 Nordpool sees its reliance on TSOs’ non-market-based reserves as a transitional market failure, which justifies setting market prices equal to the price cap in an attempt to attract market-based investment.
- Capacity market Pay power plants for being prepared to generate, even if they are not called upon
- About 2x more capacity than peak demand!!!