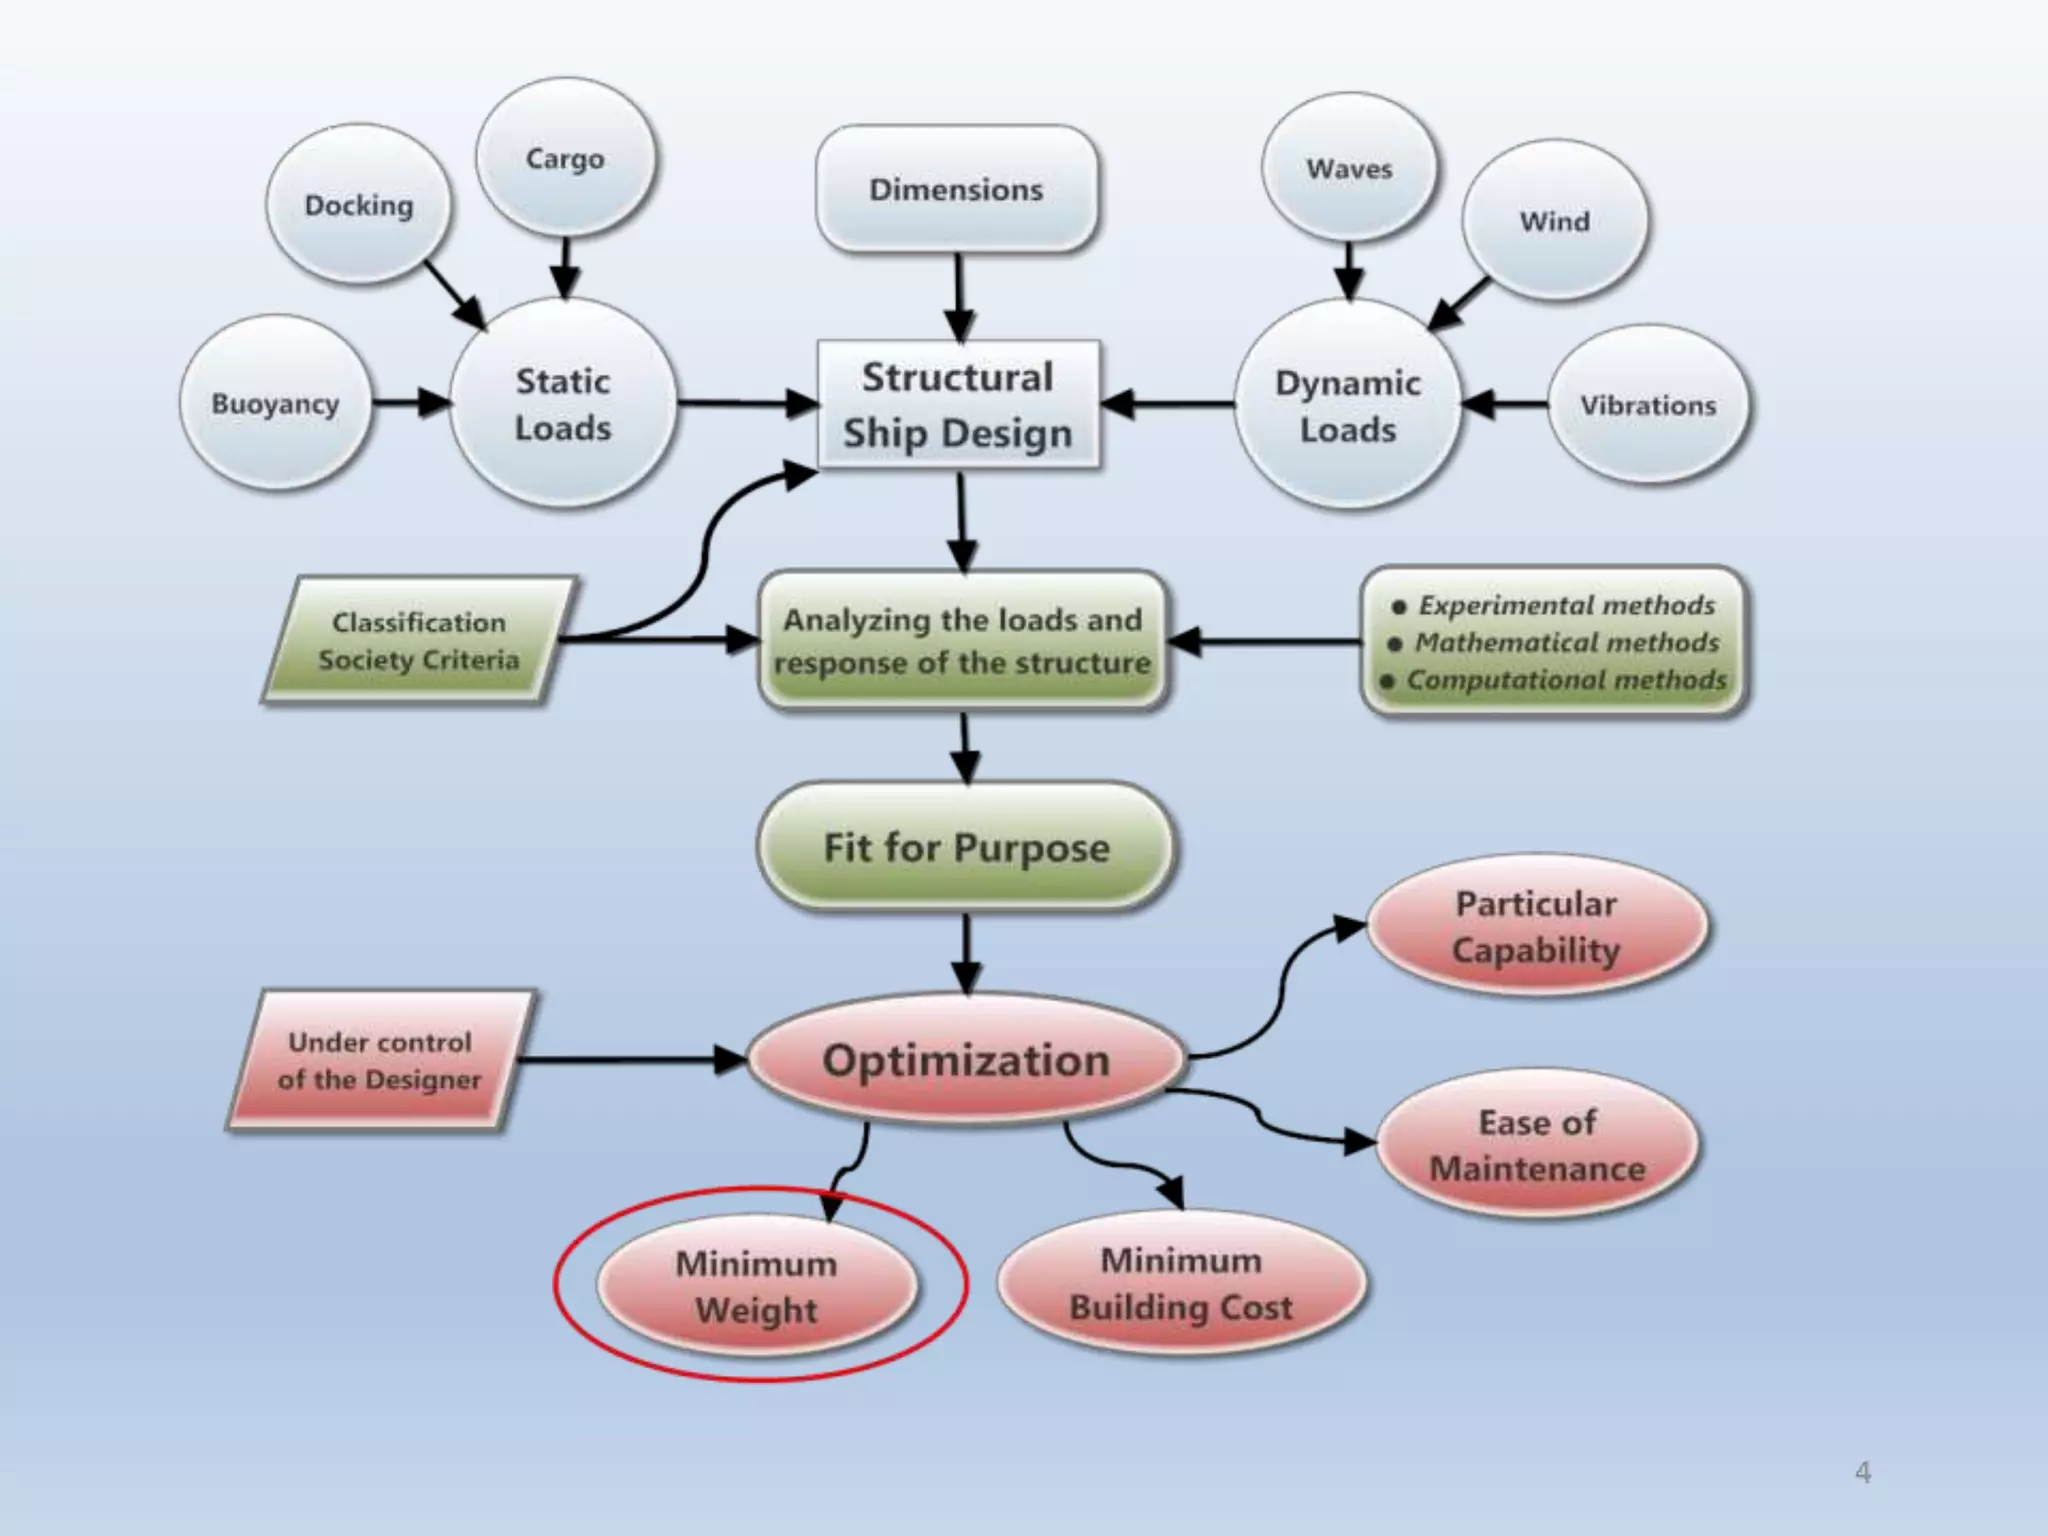
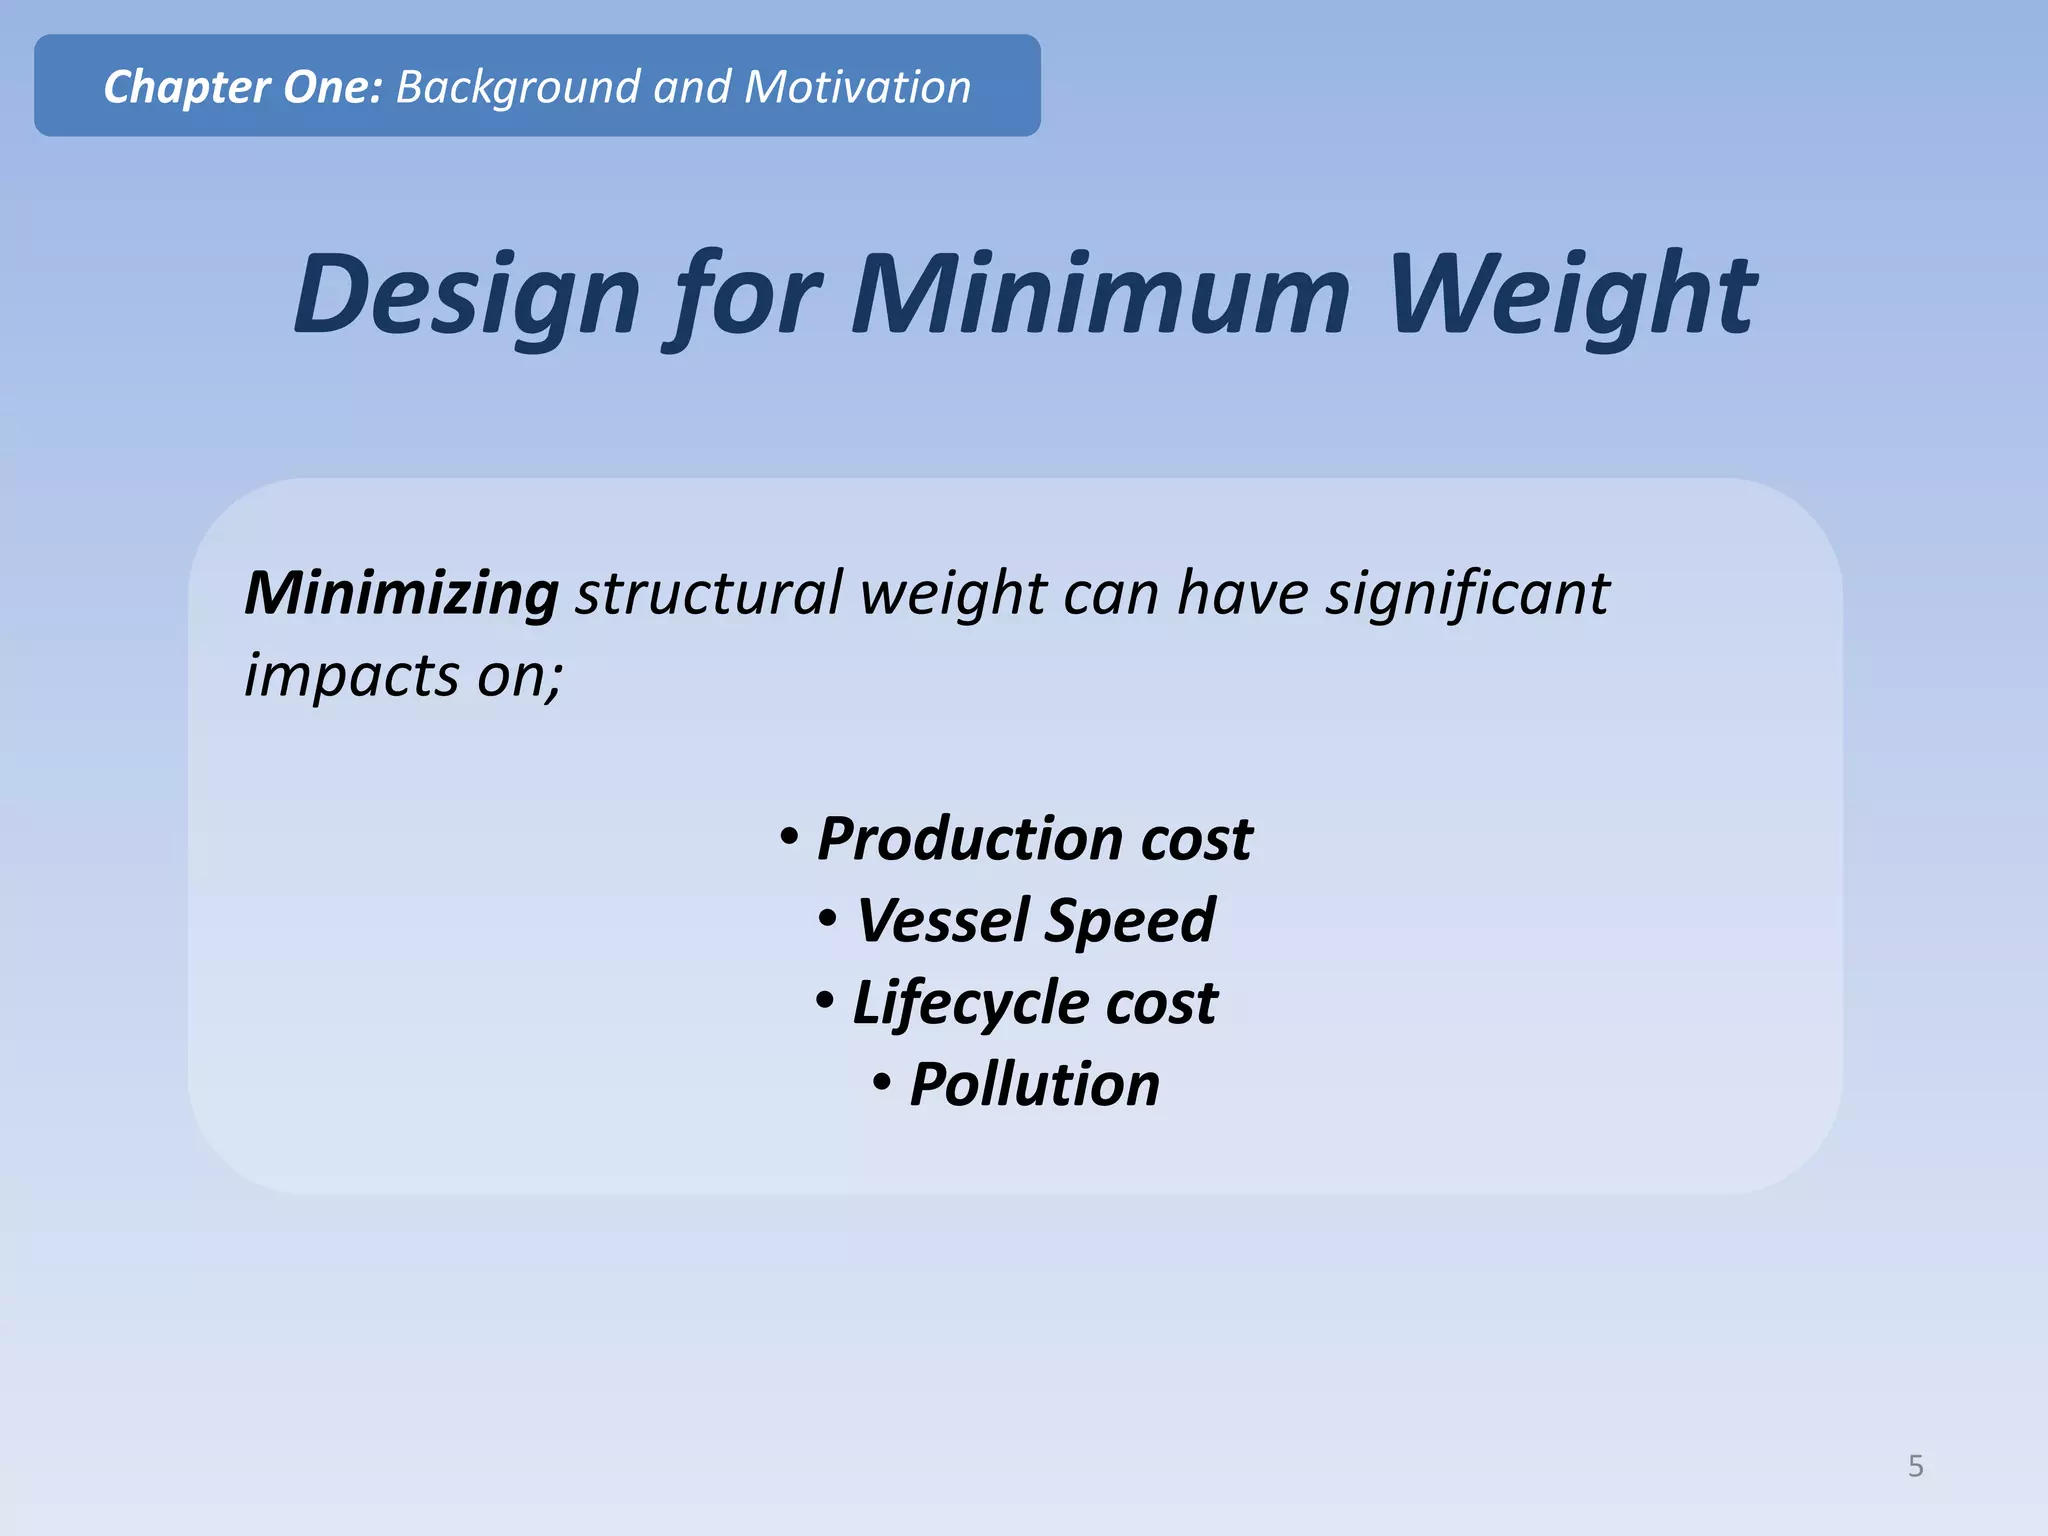
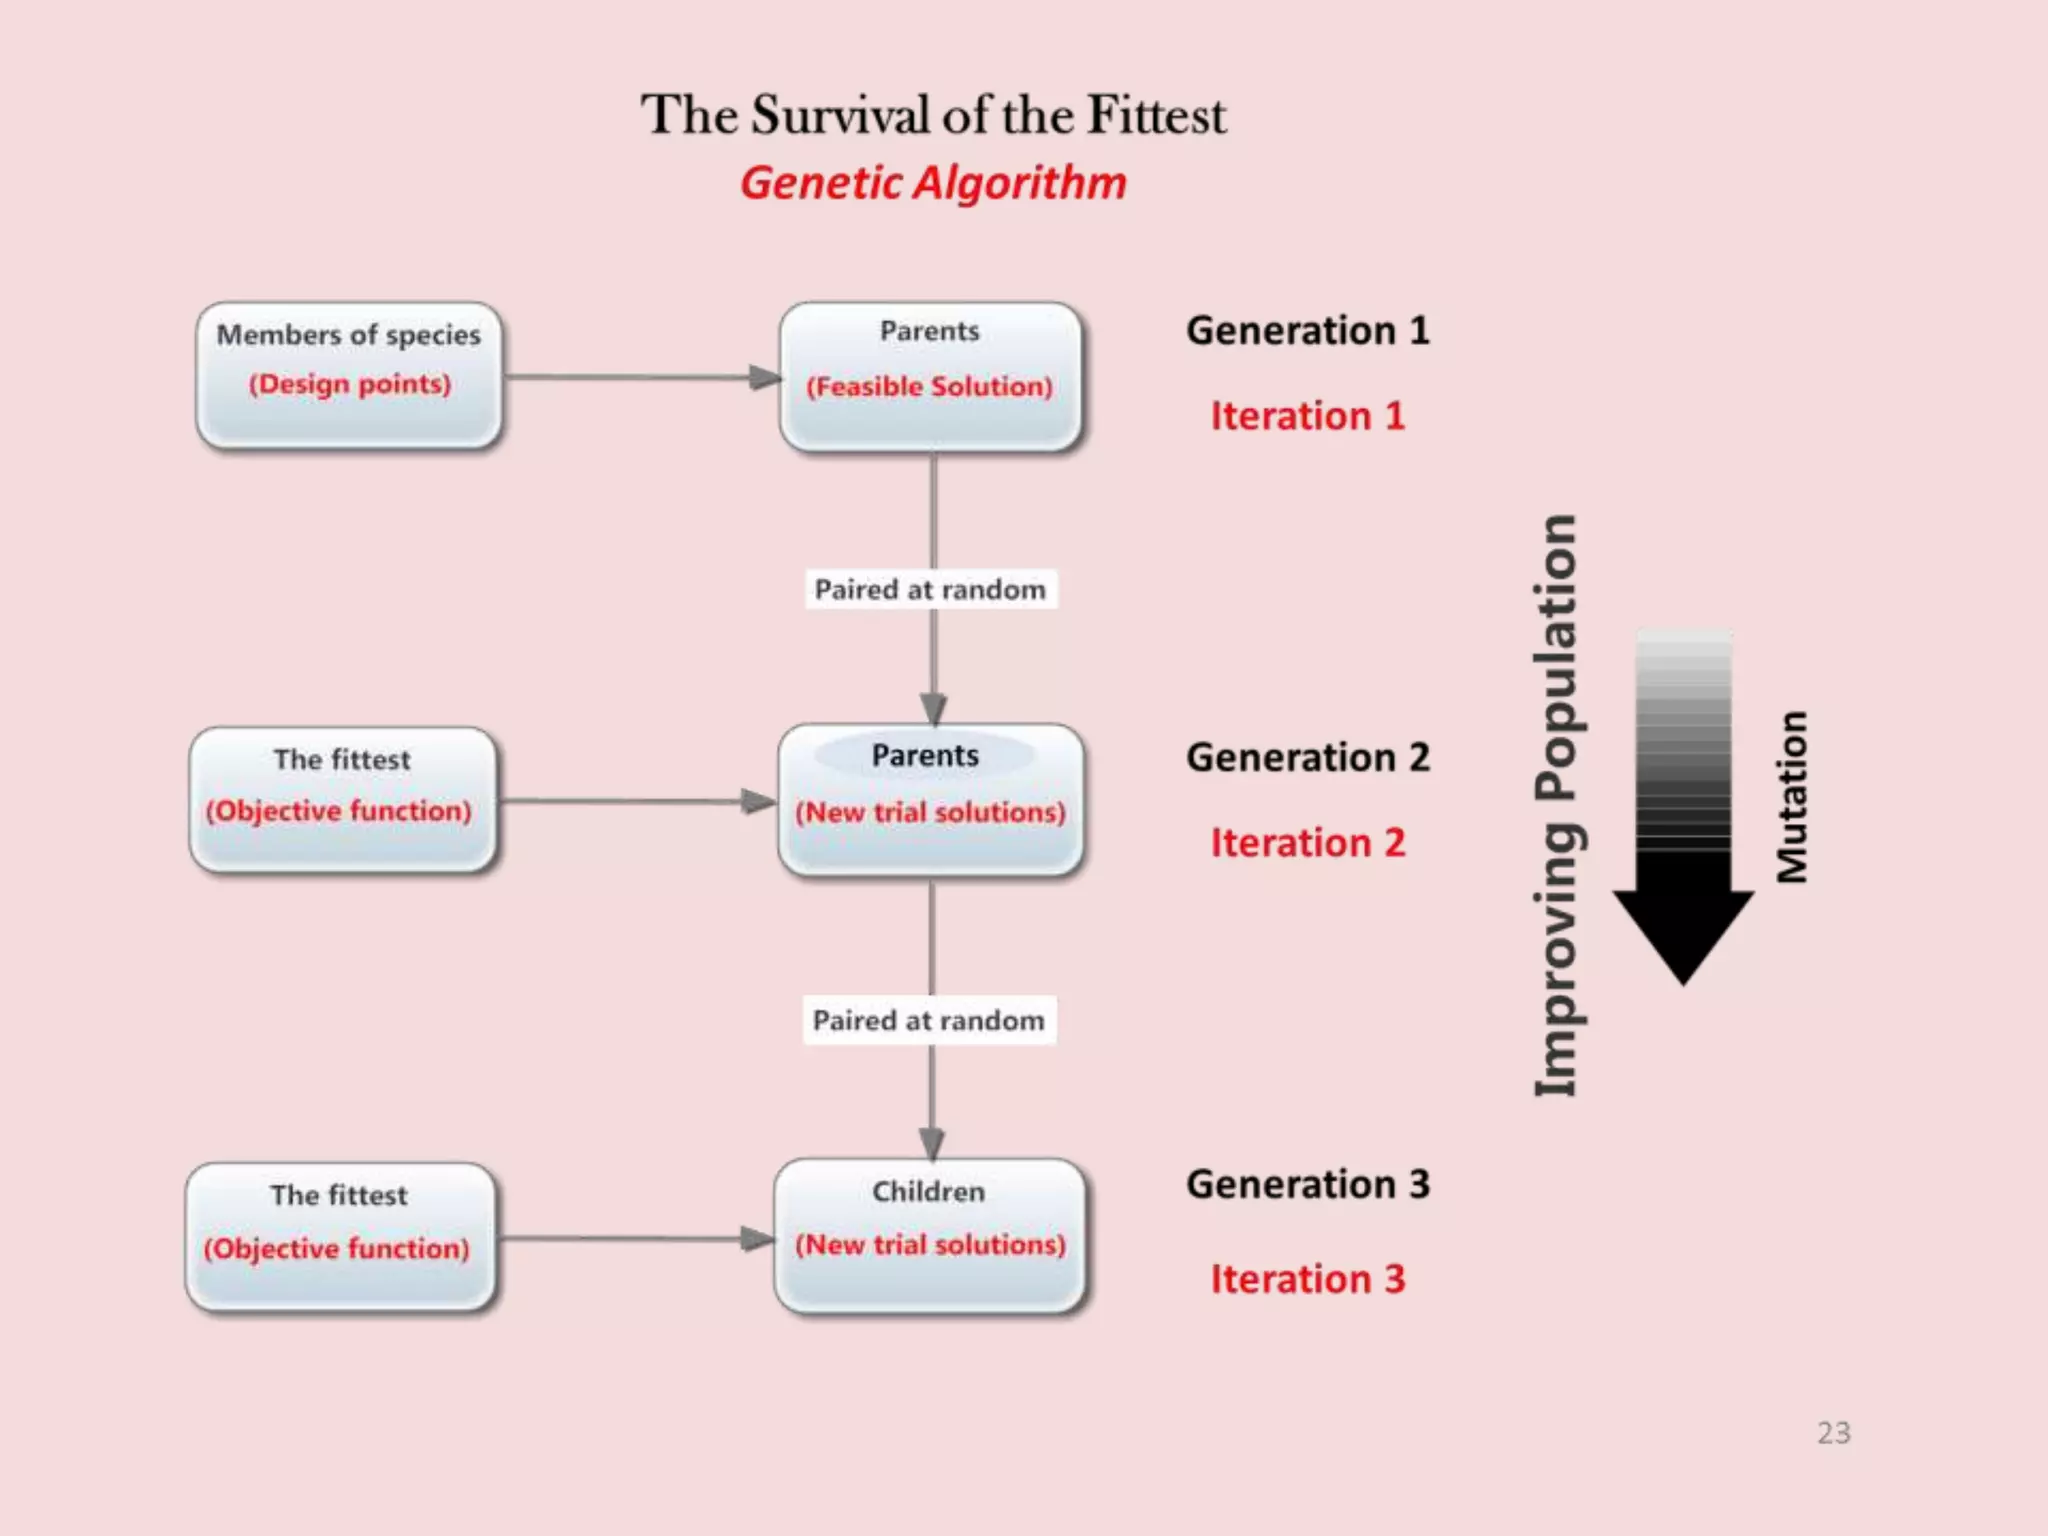
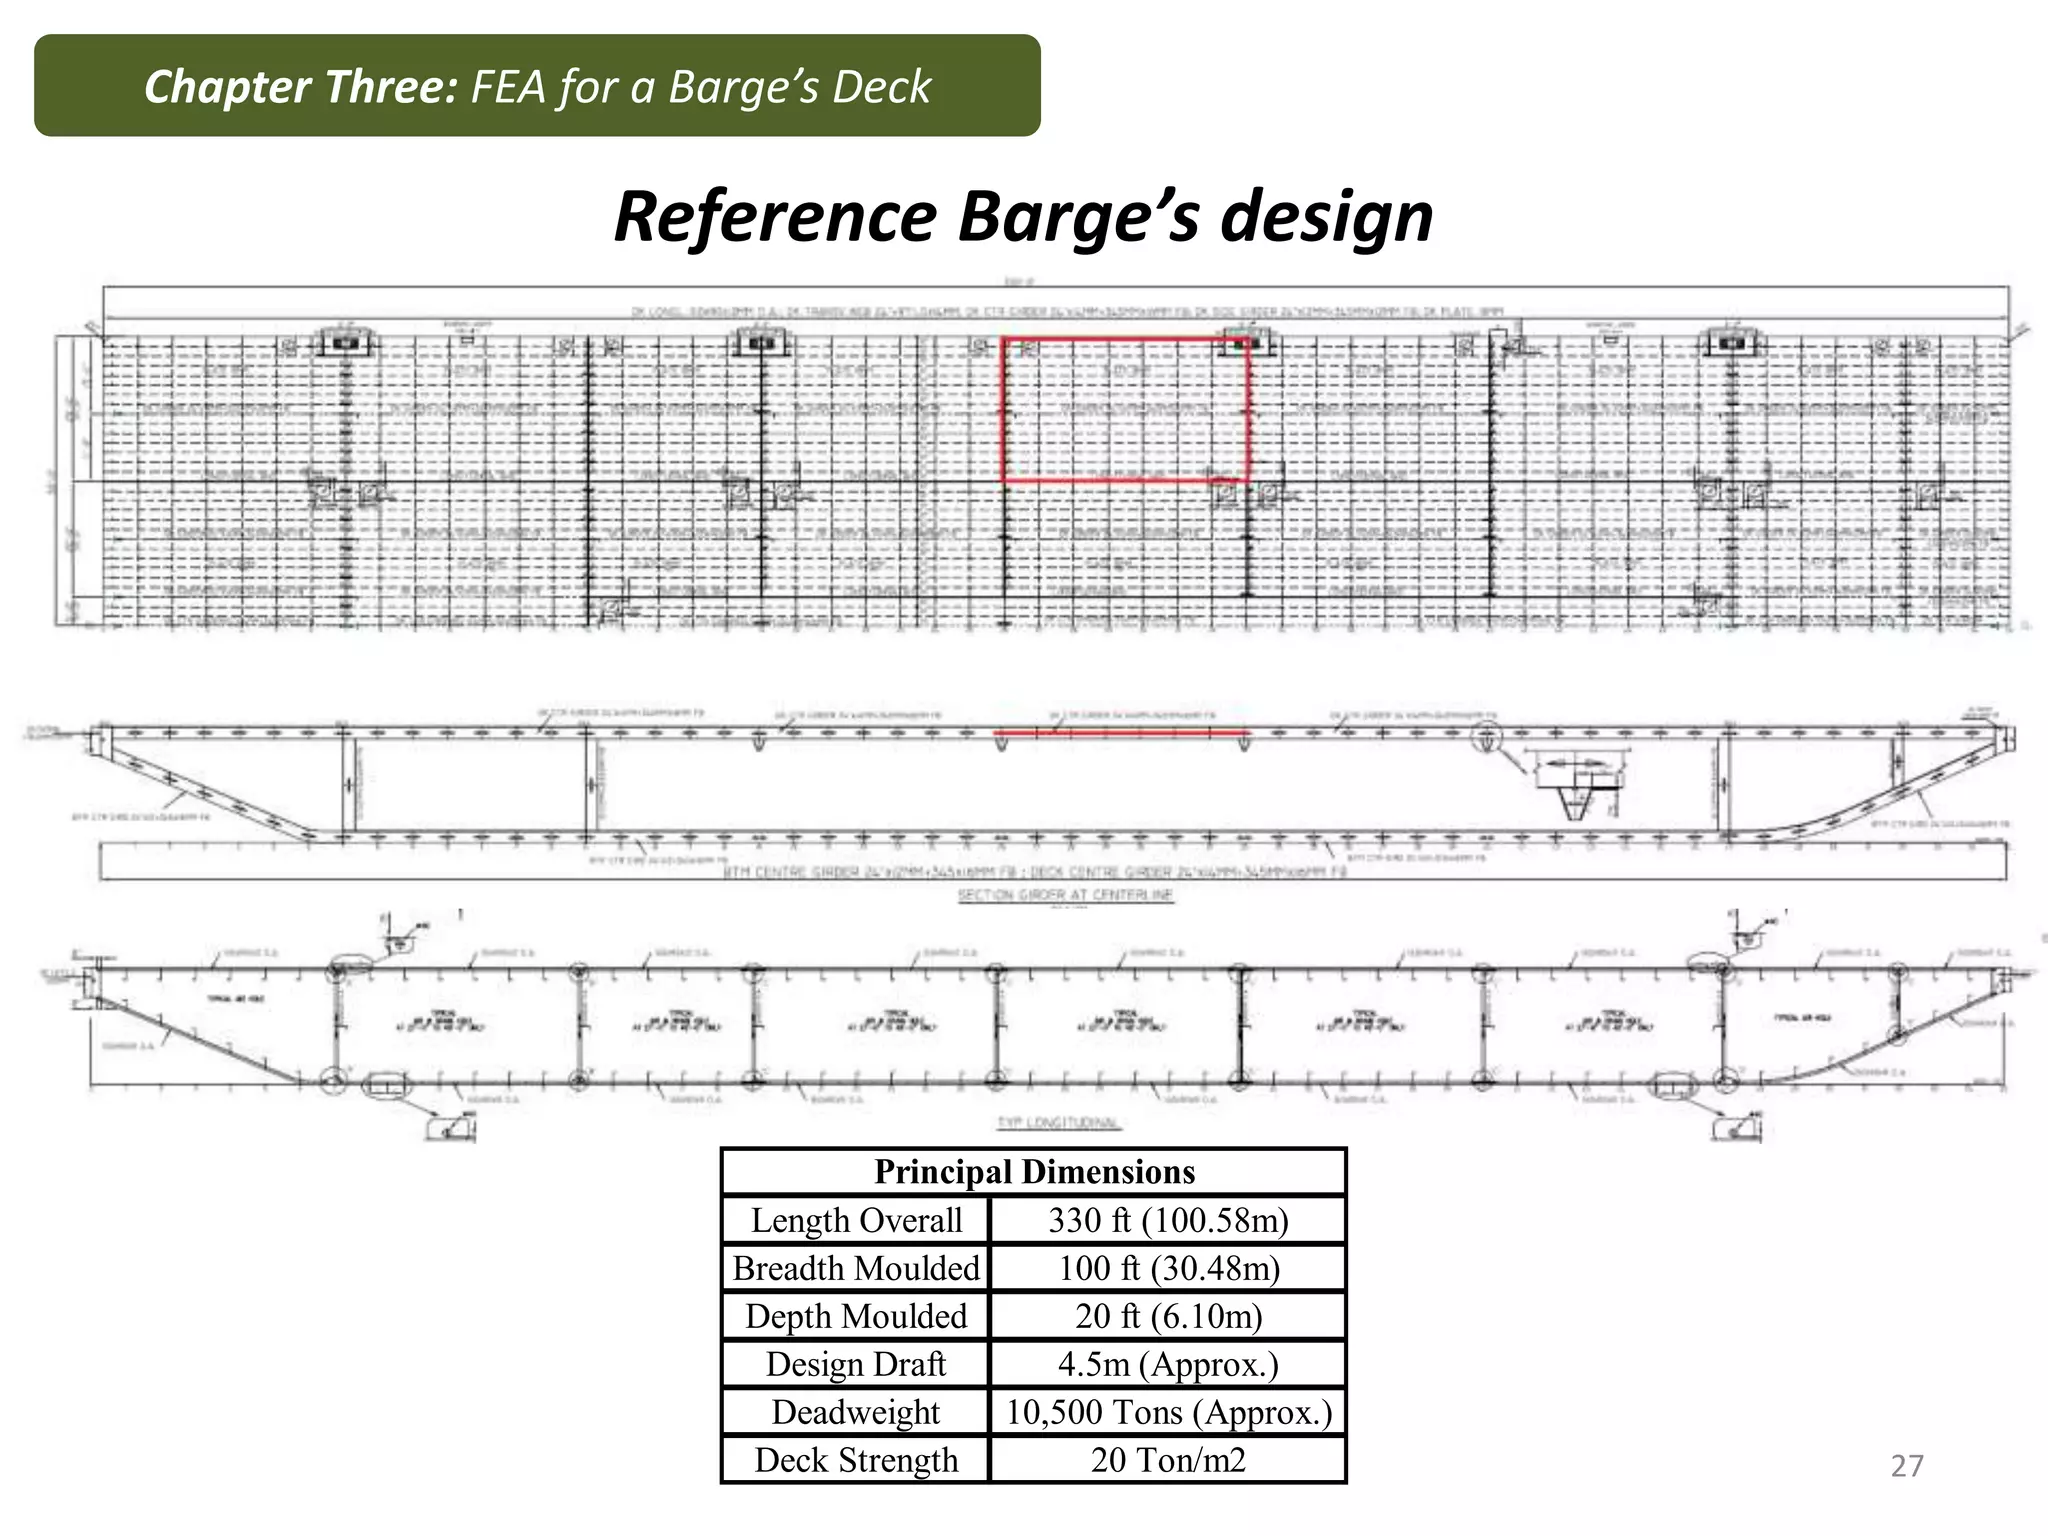
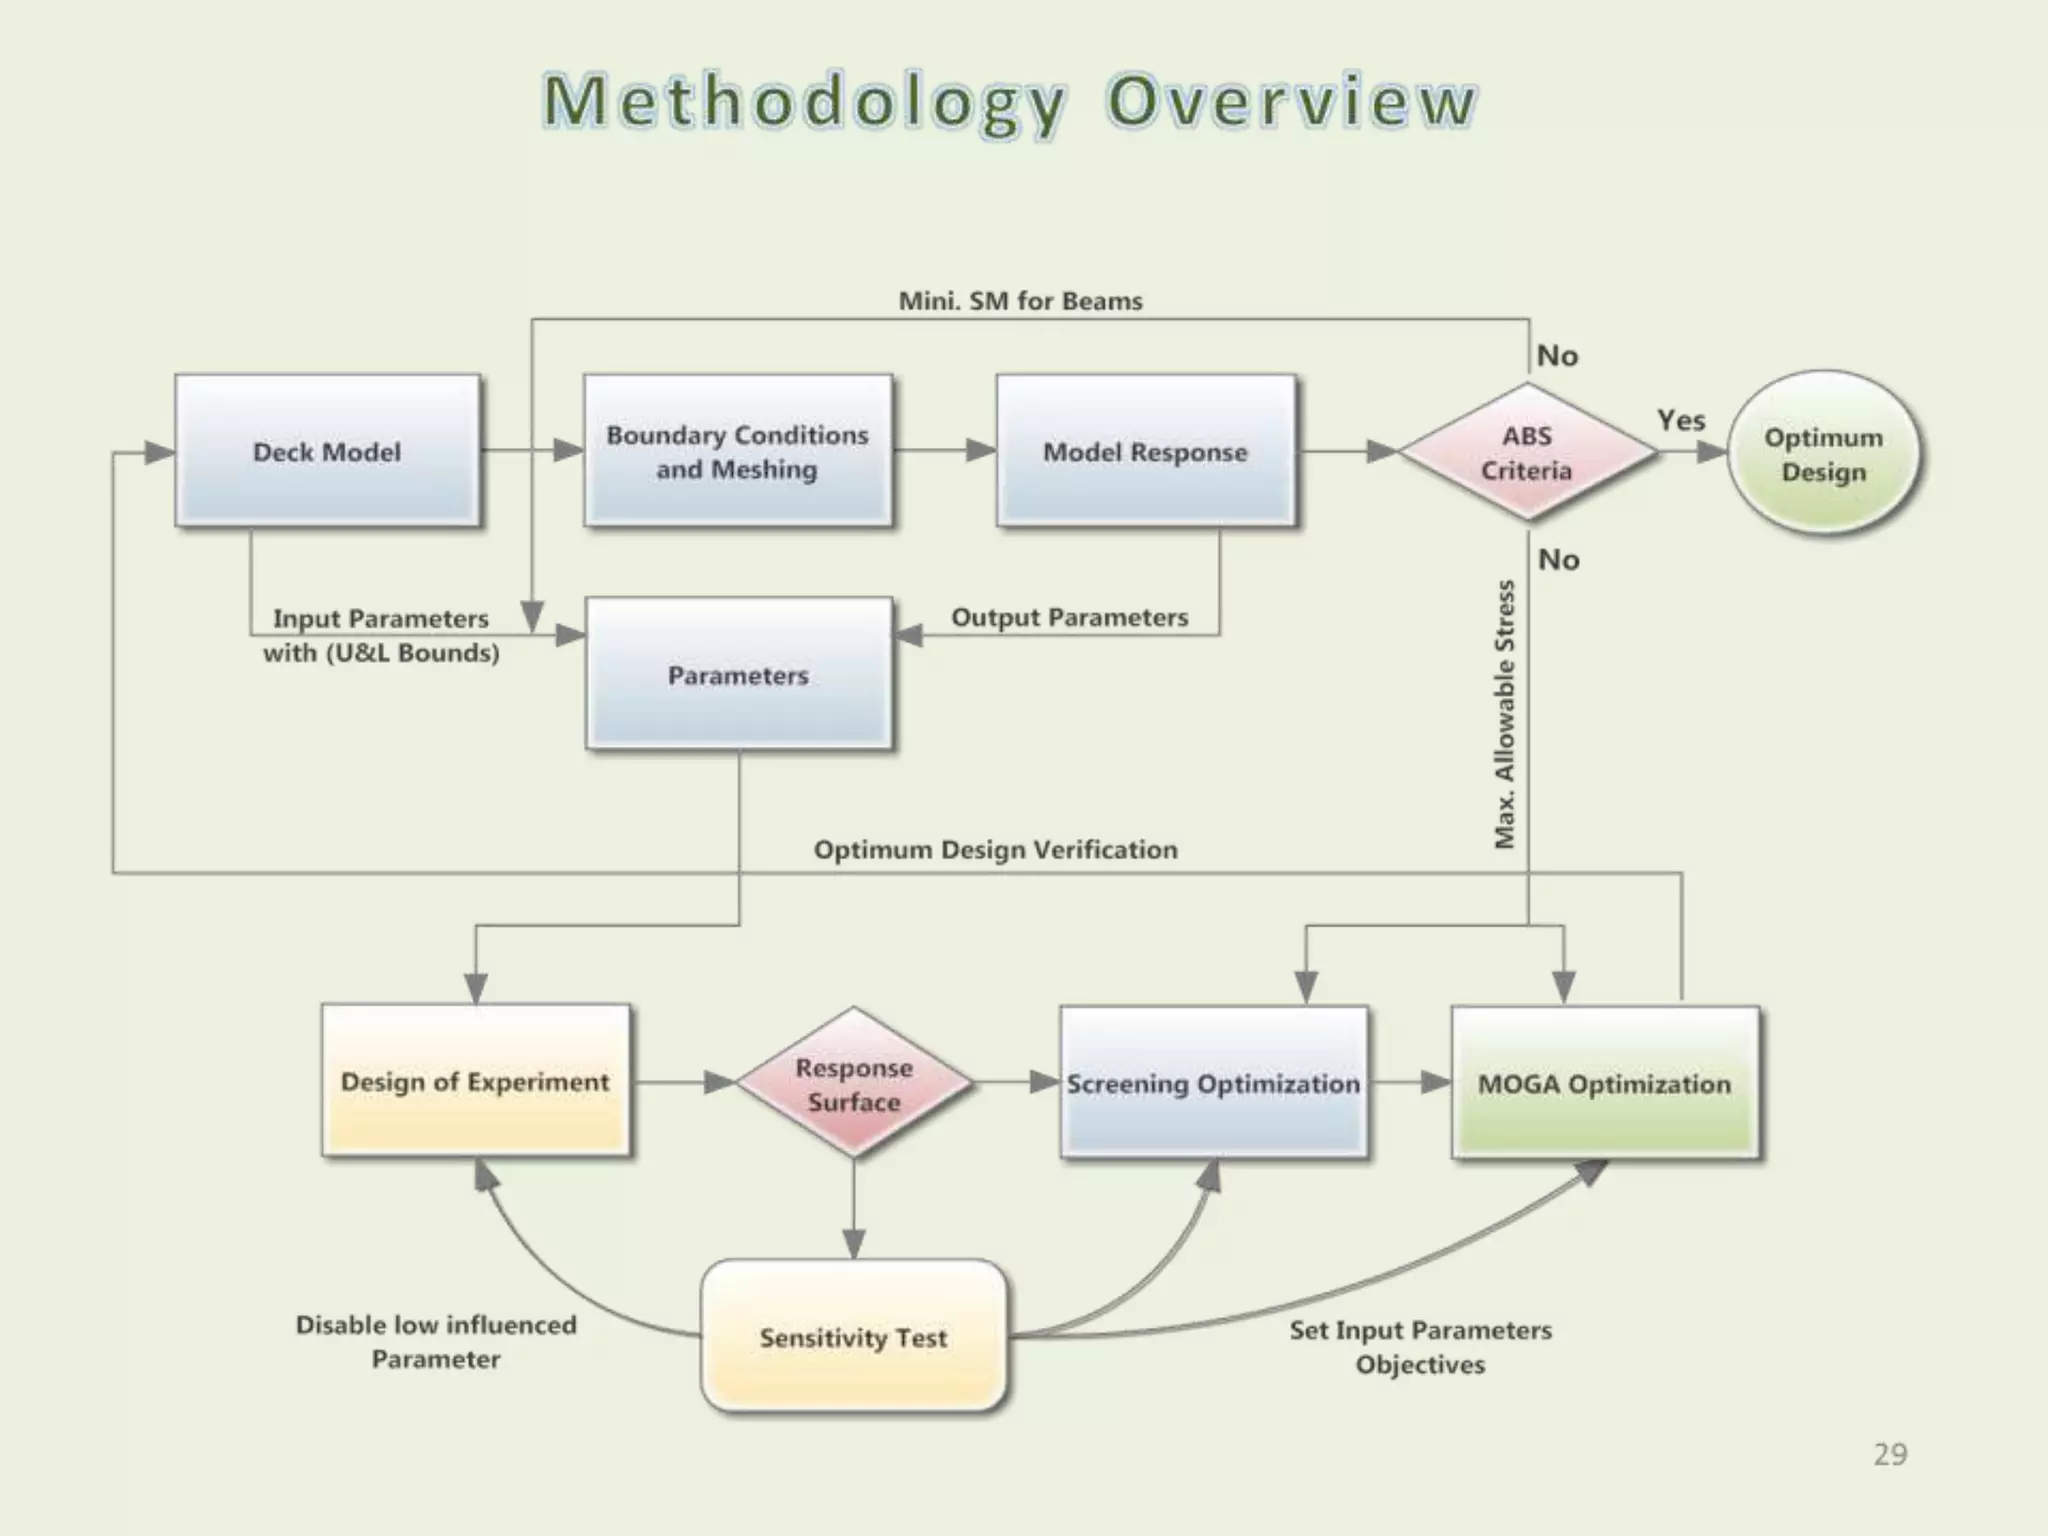
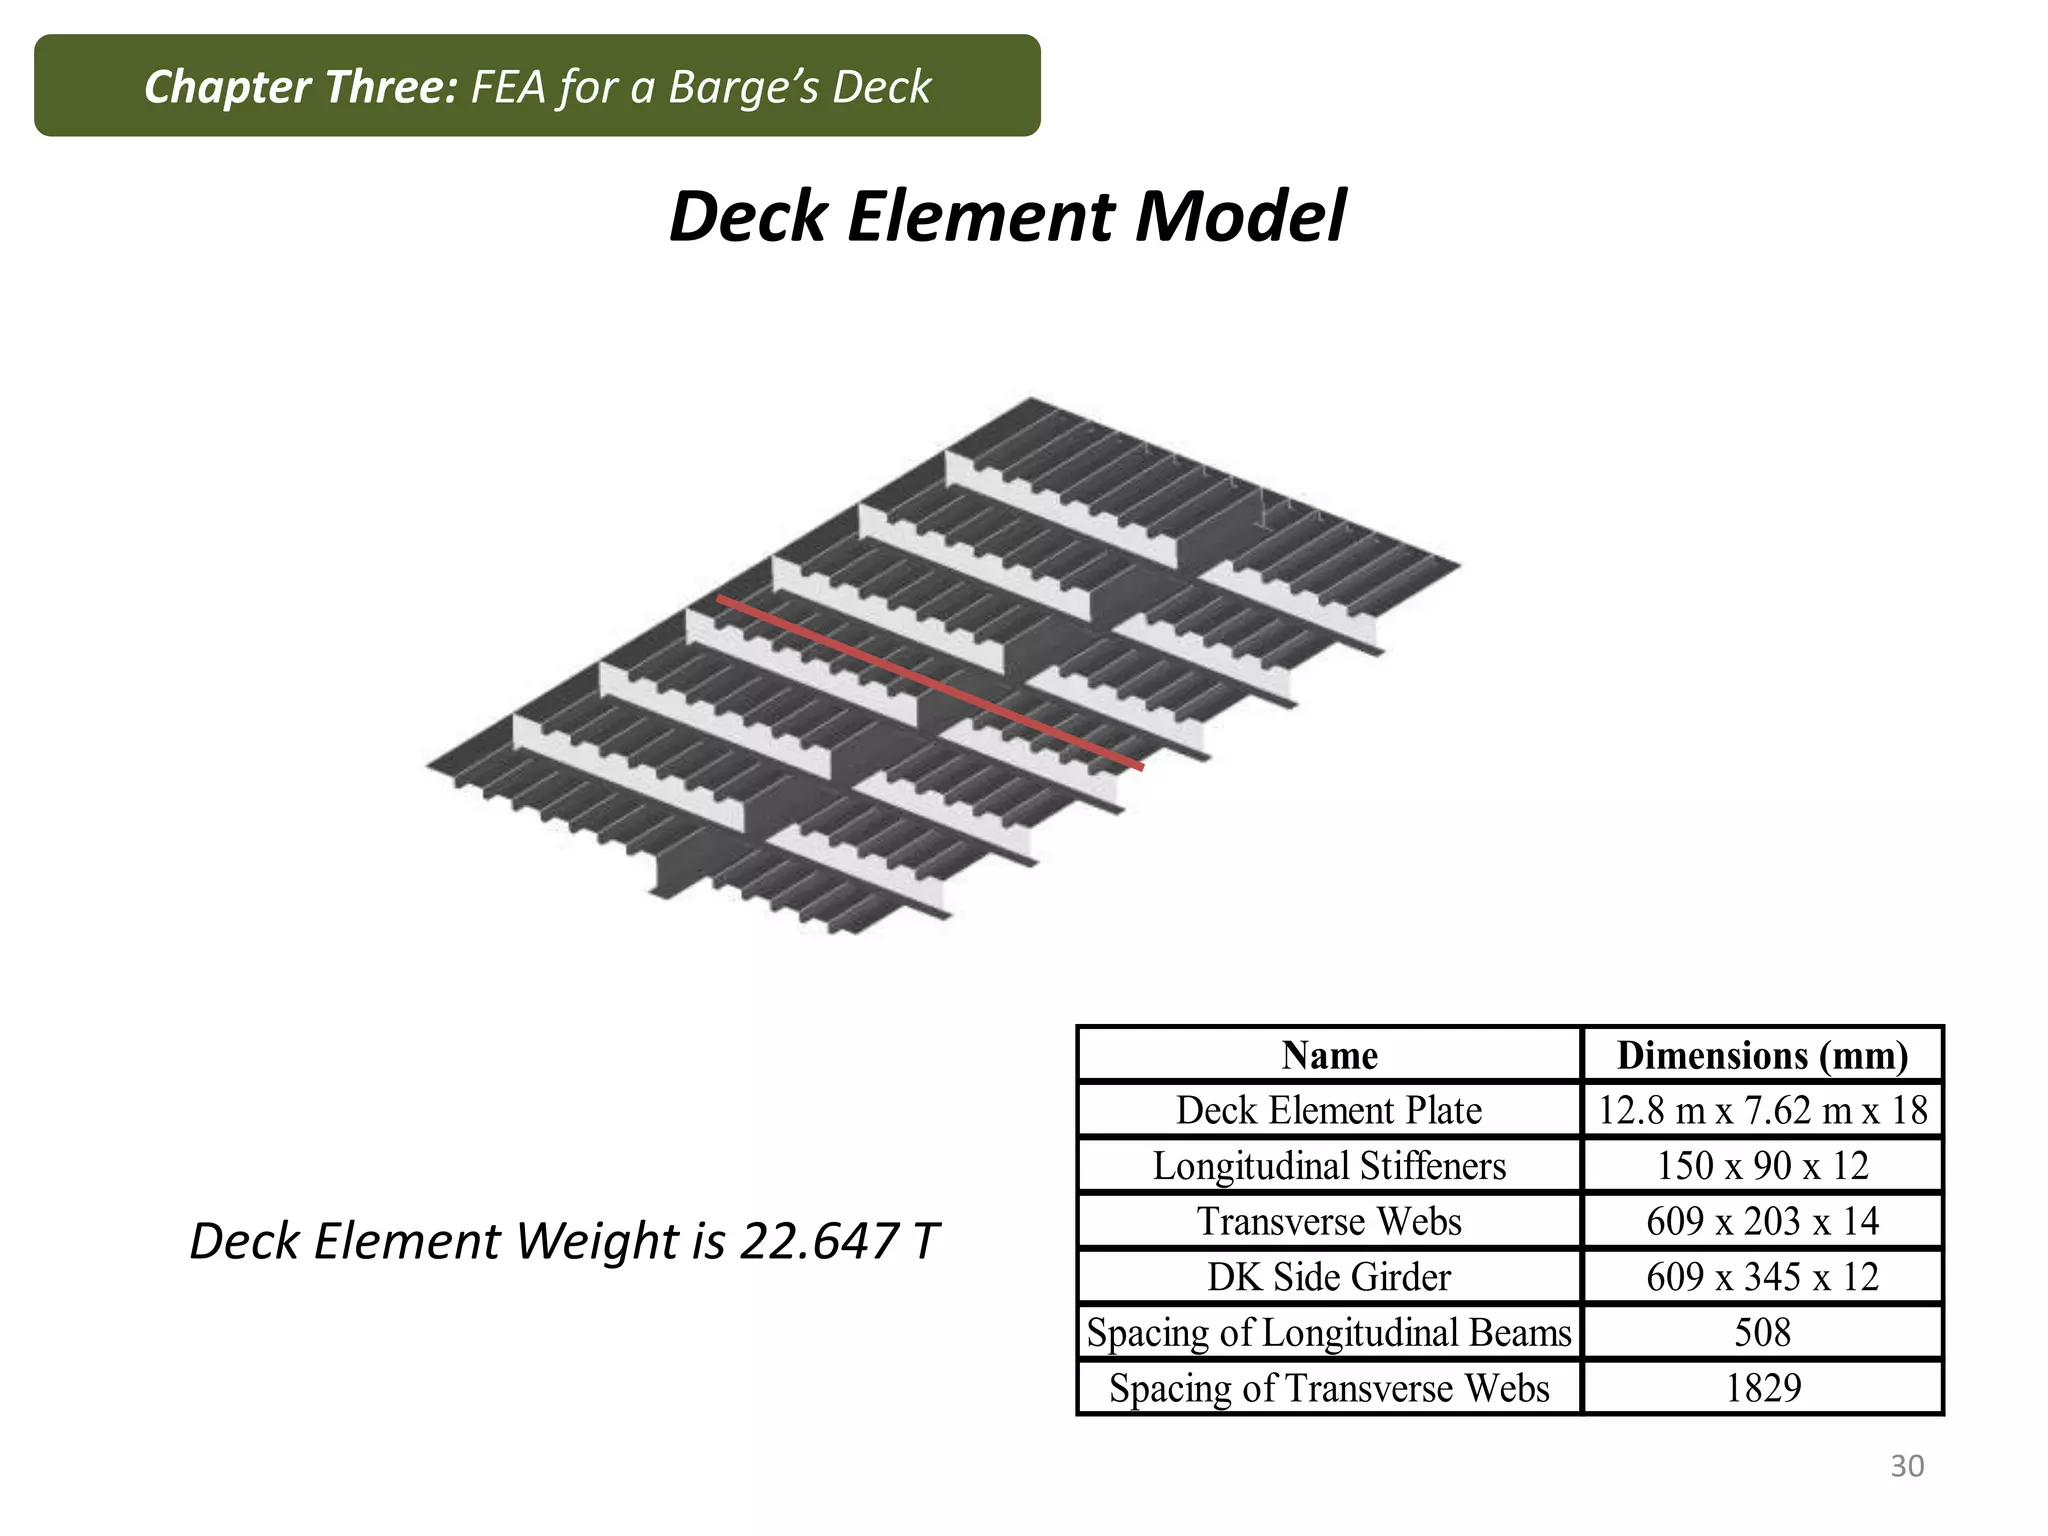
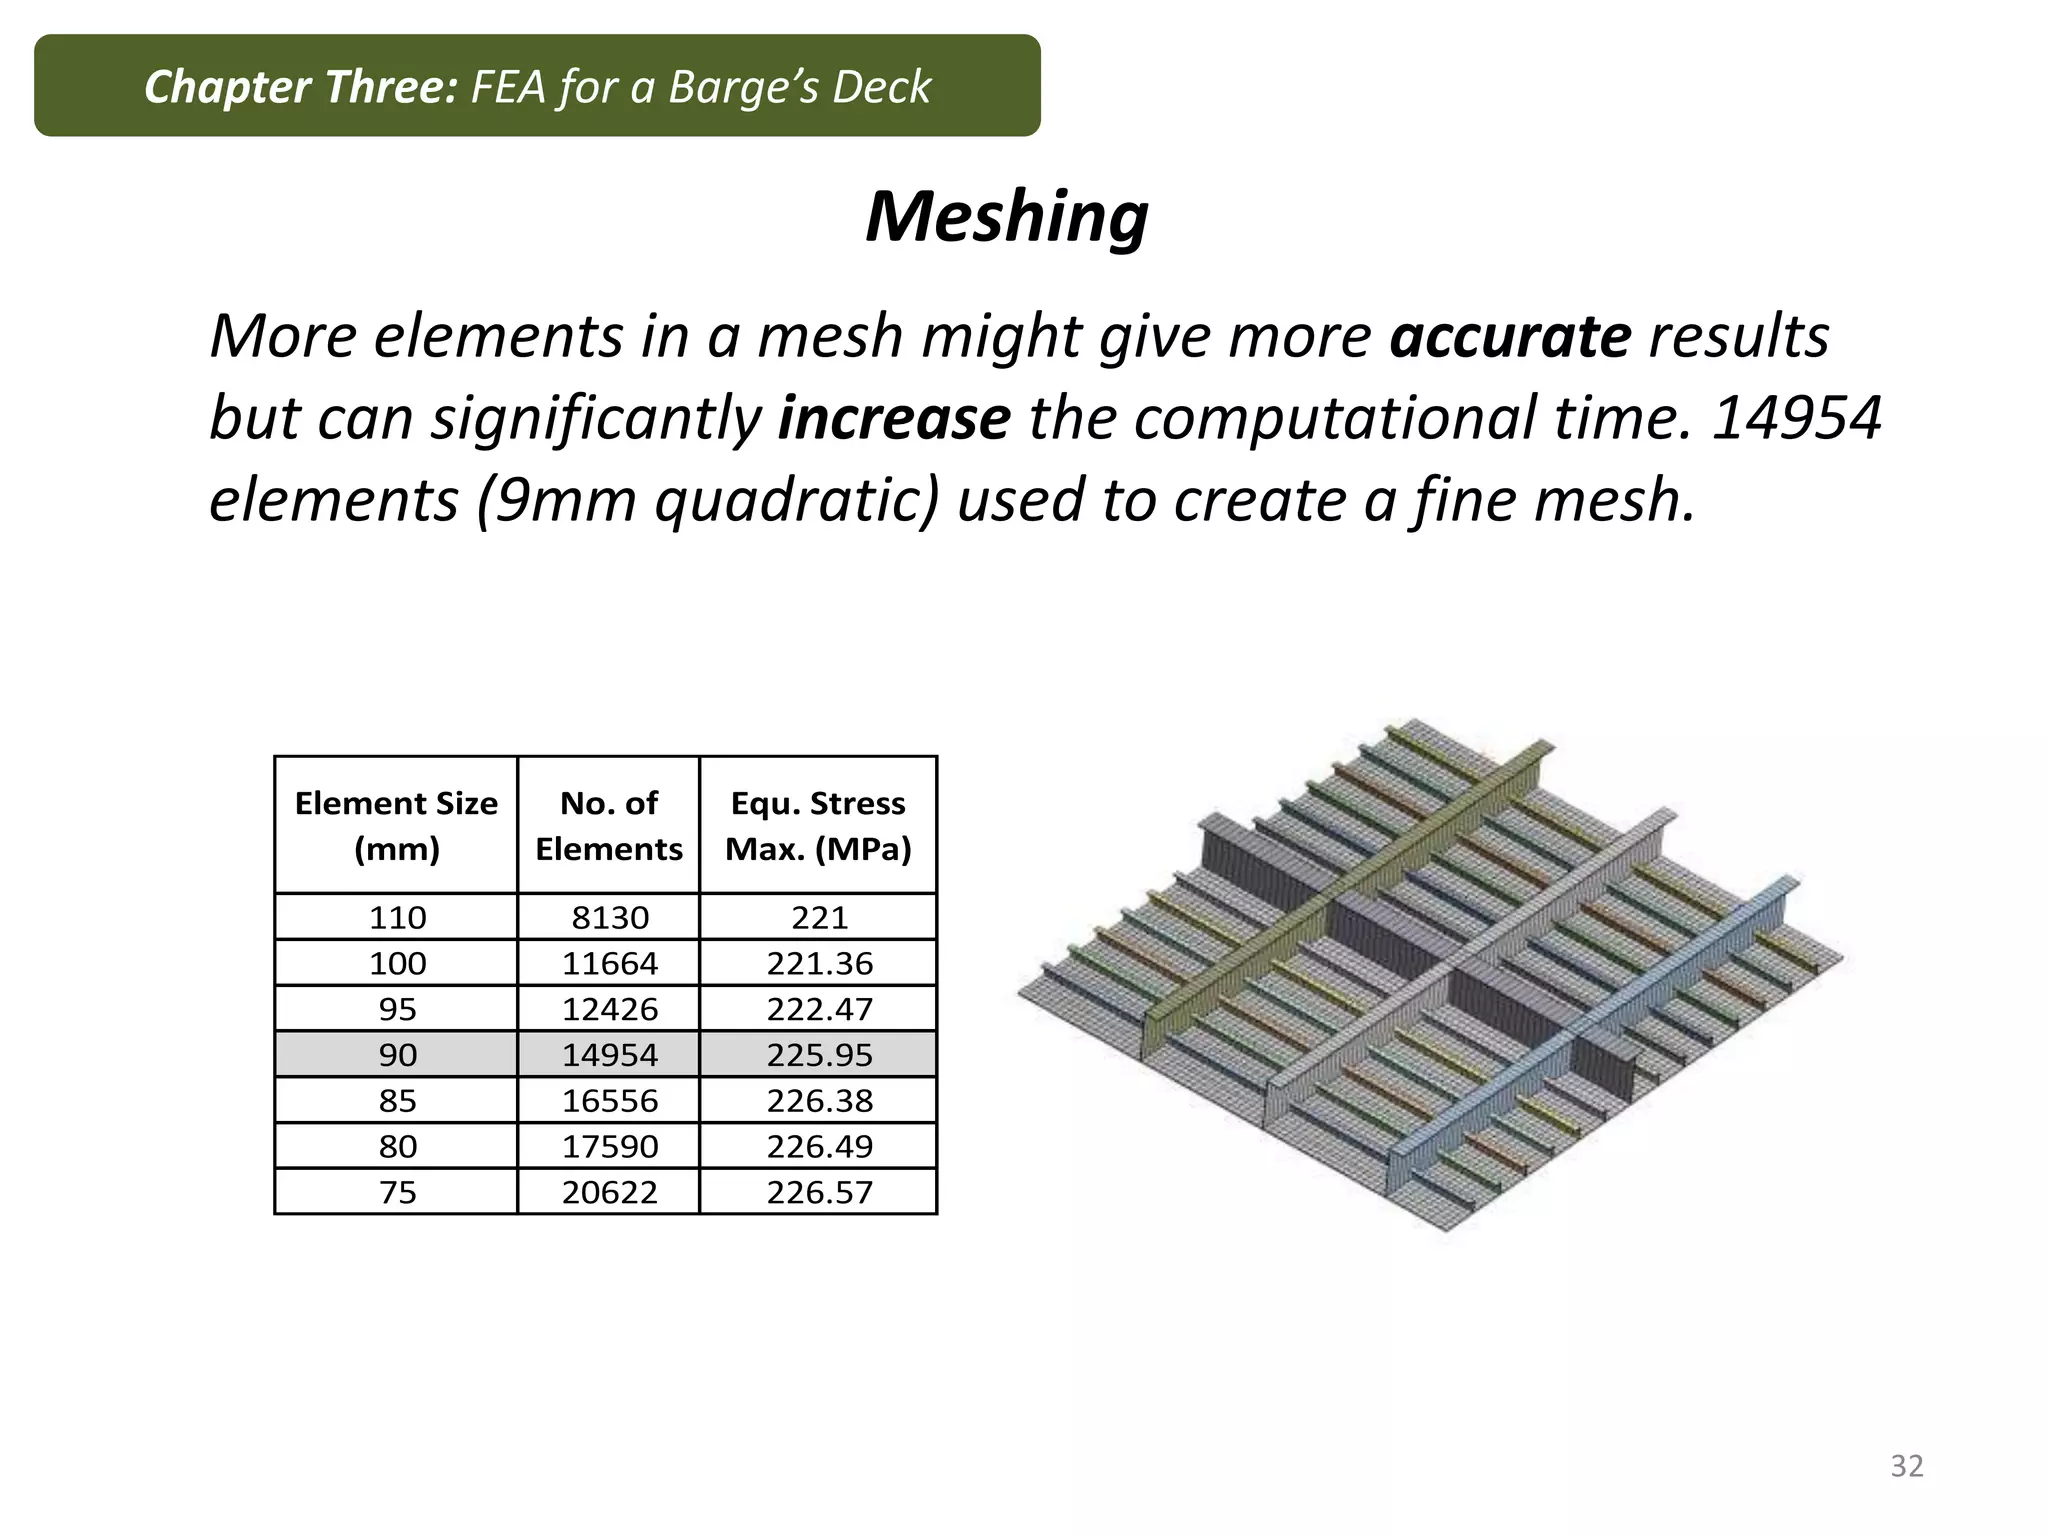
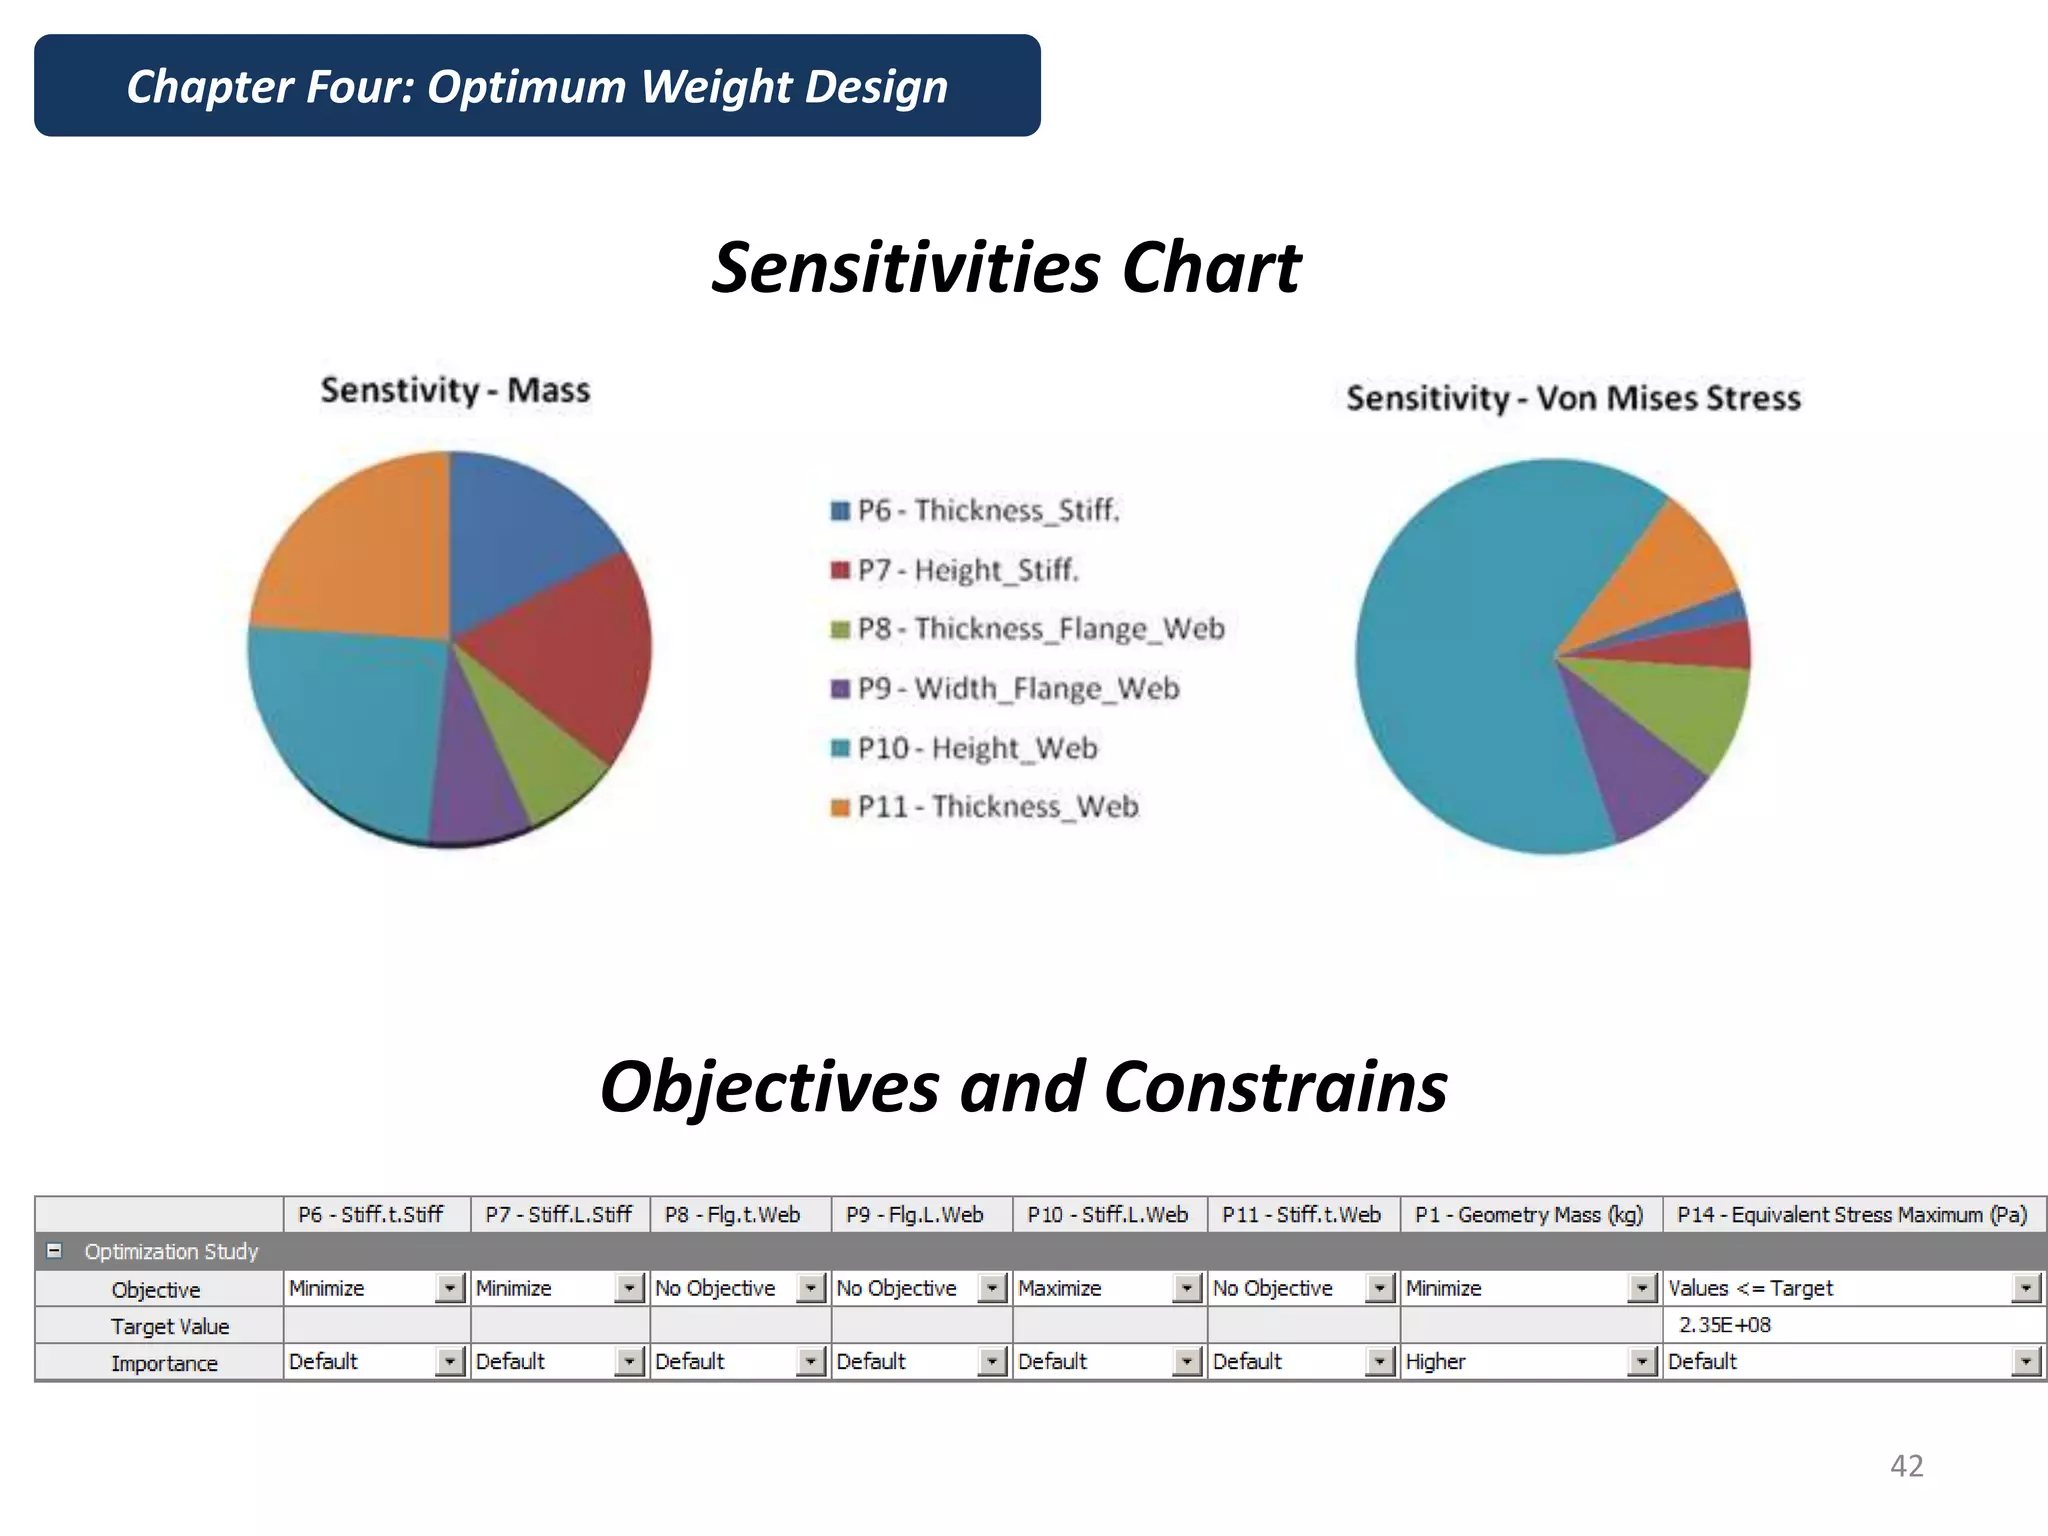
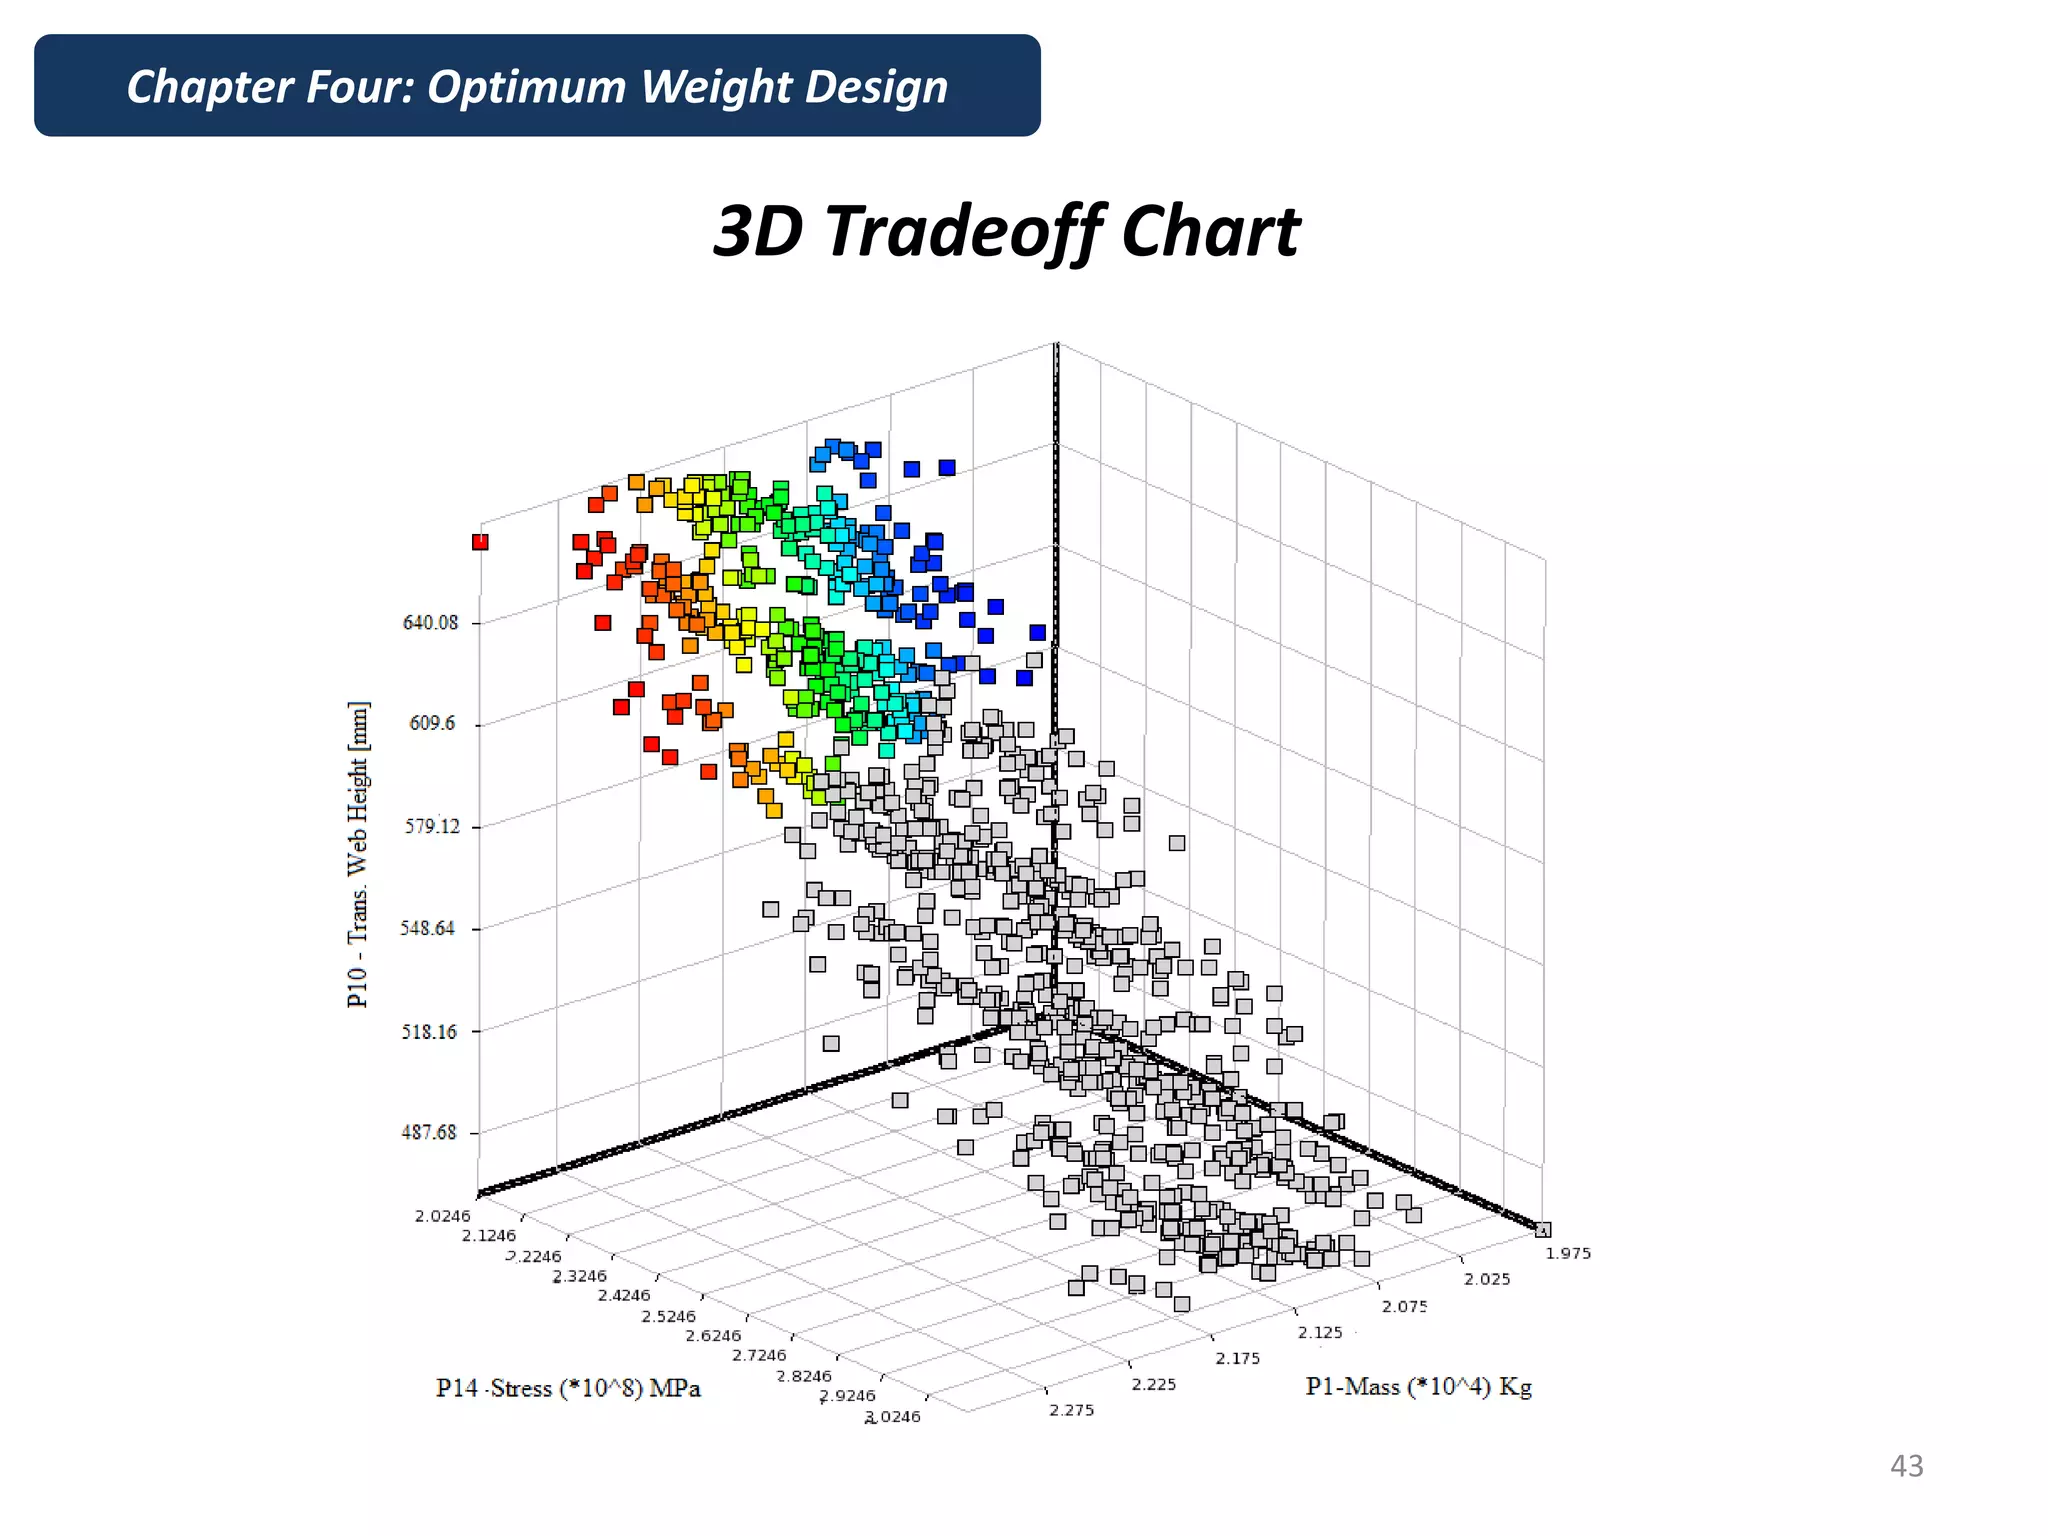
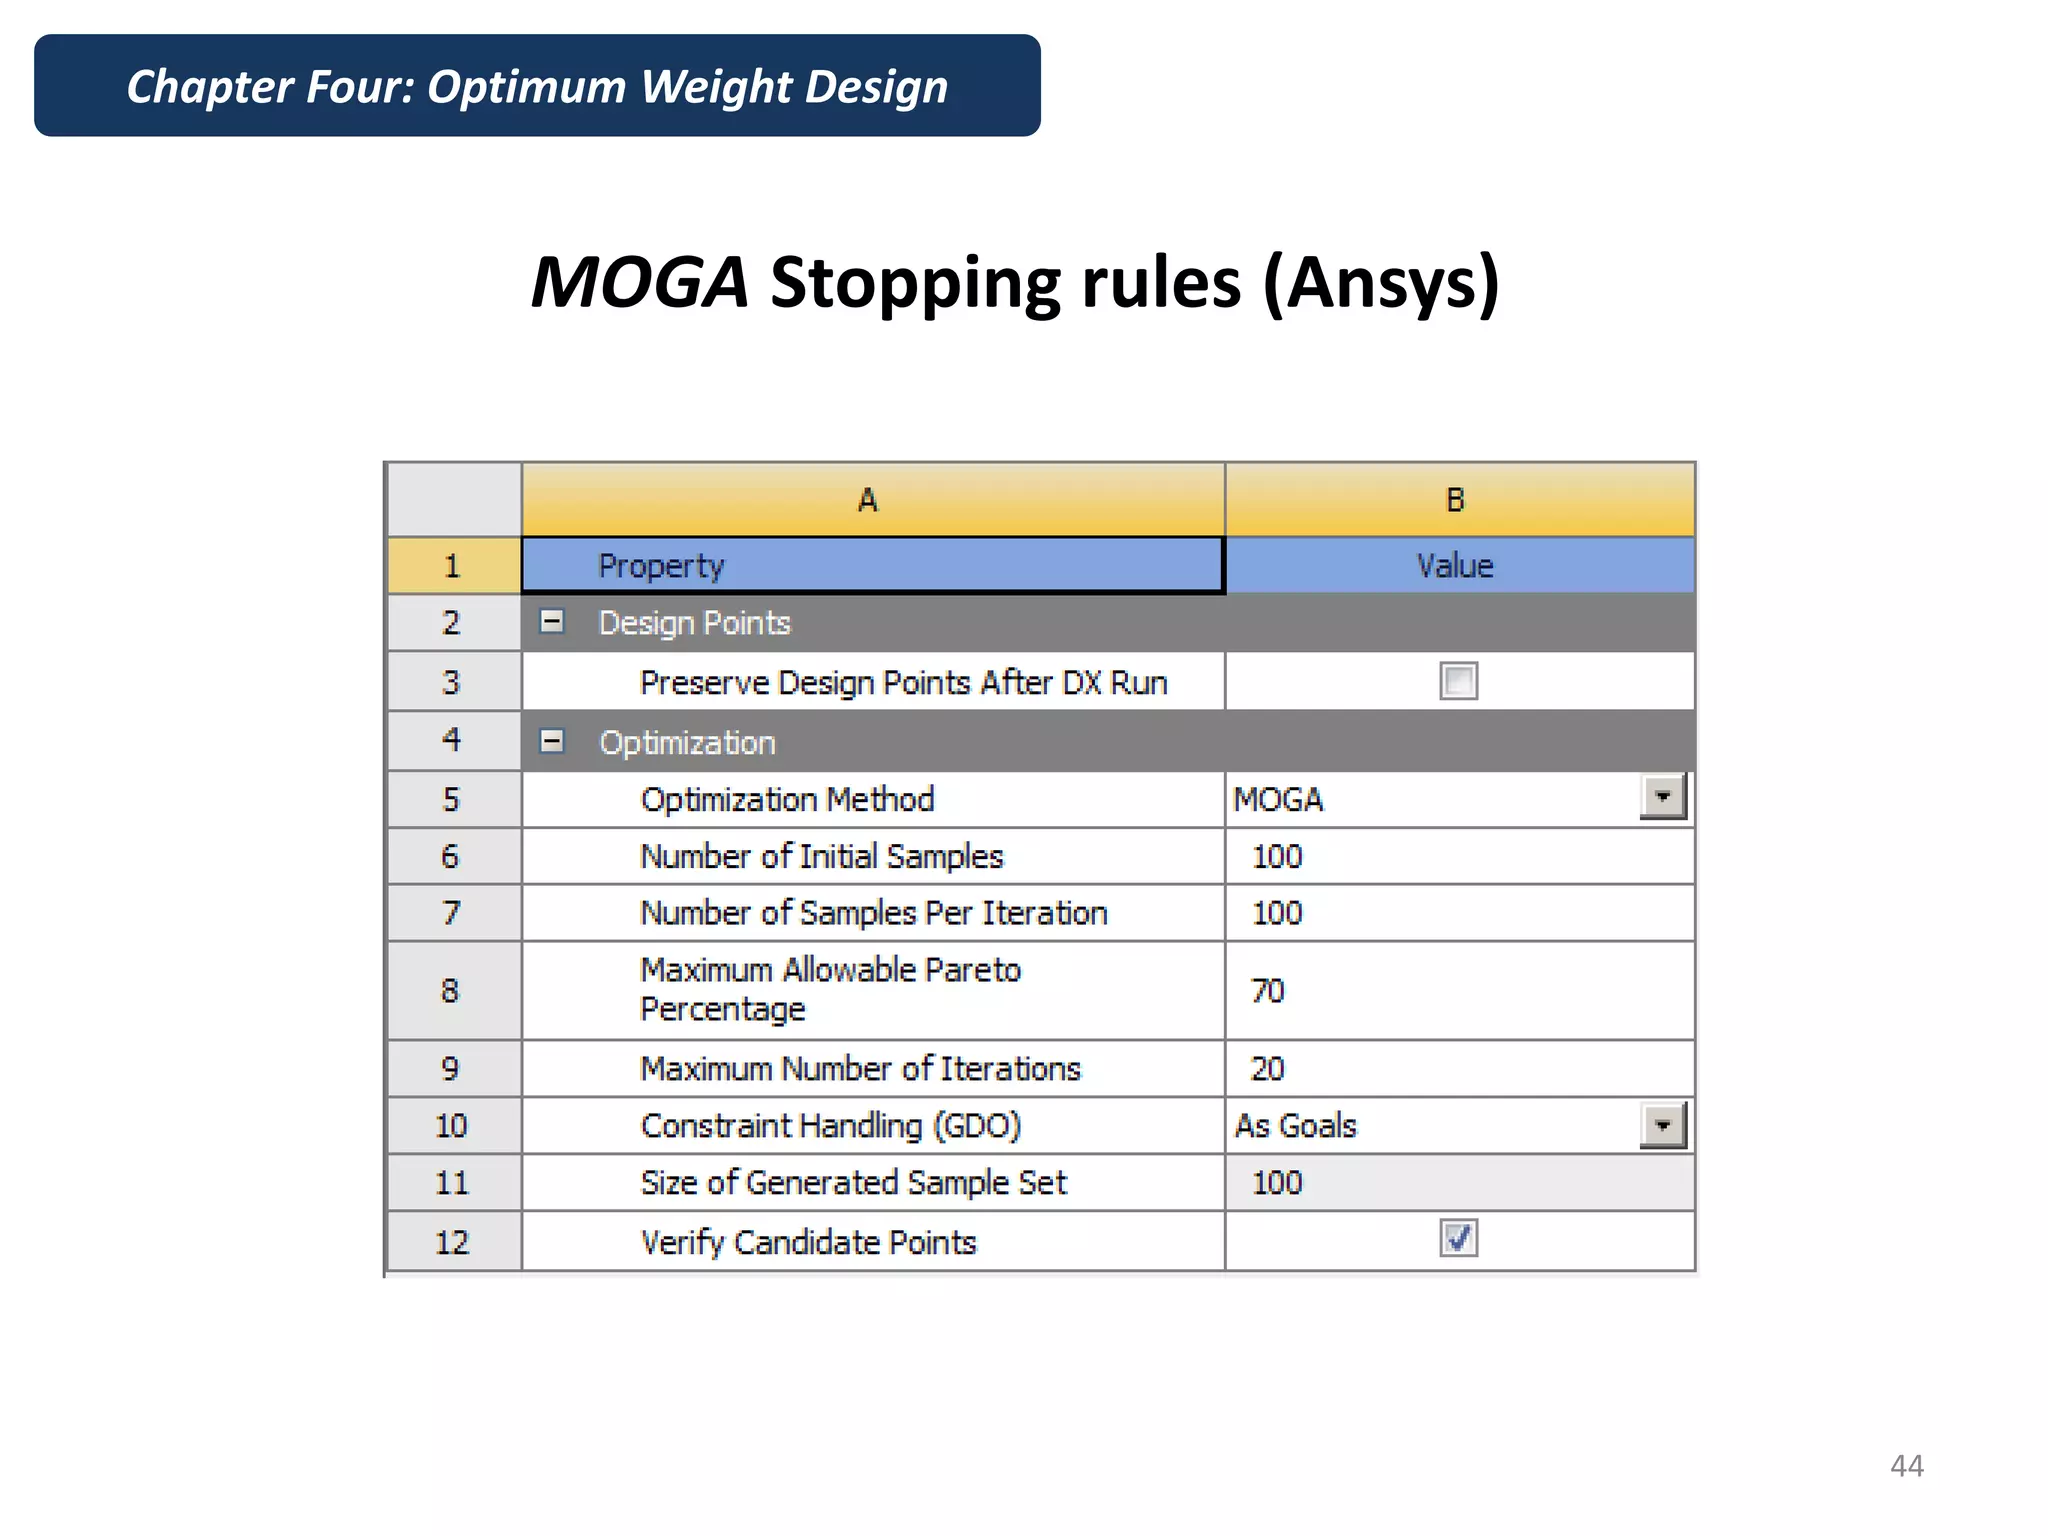
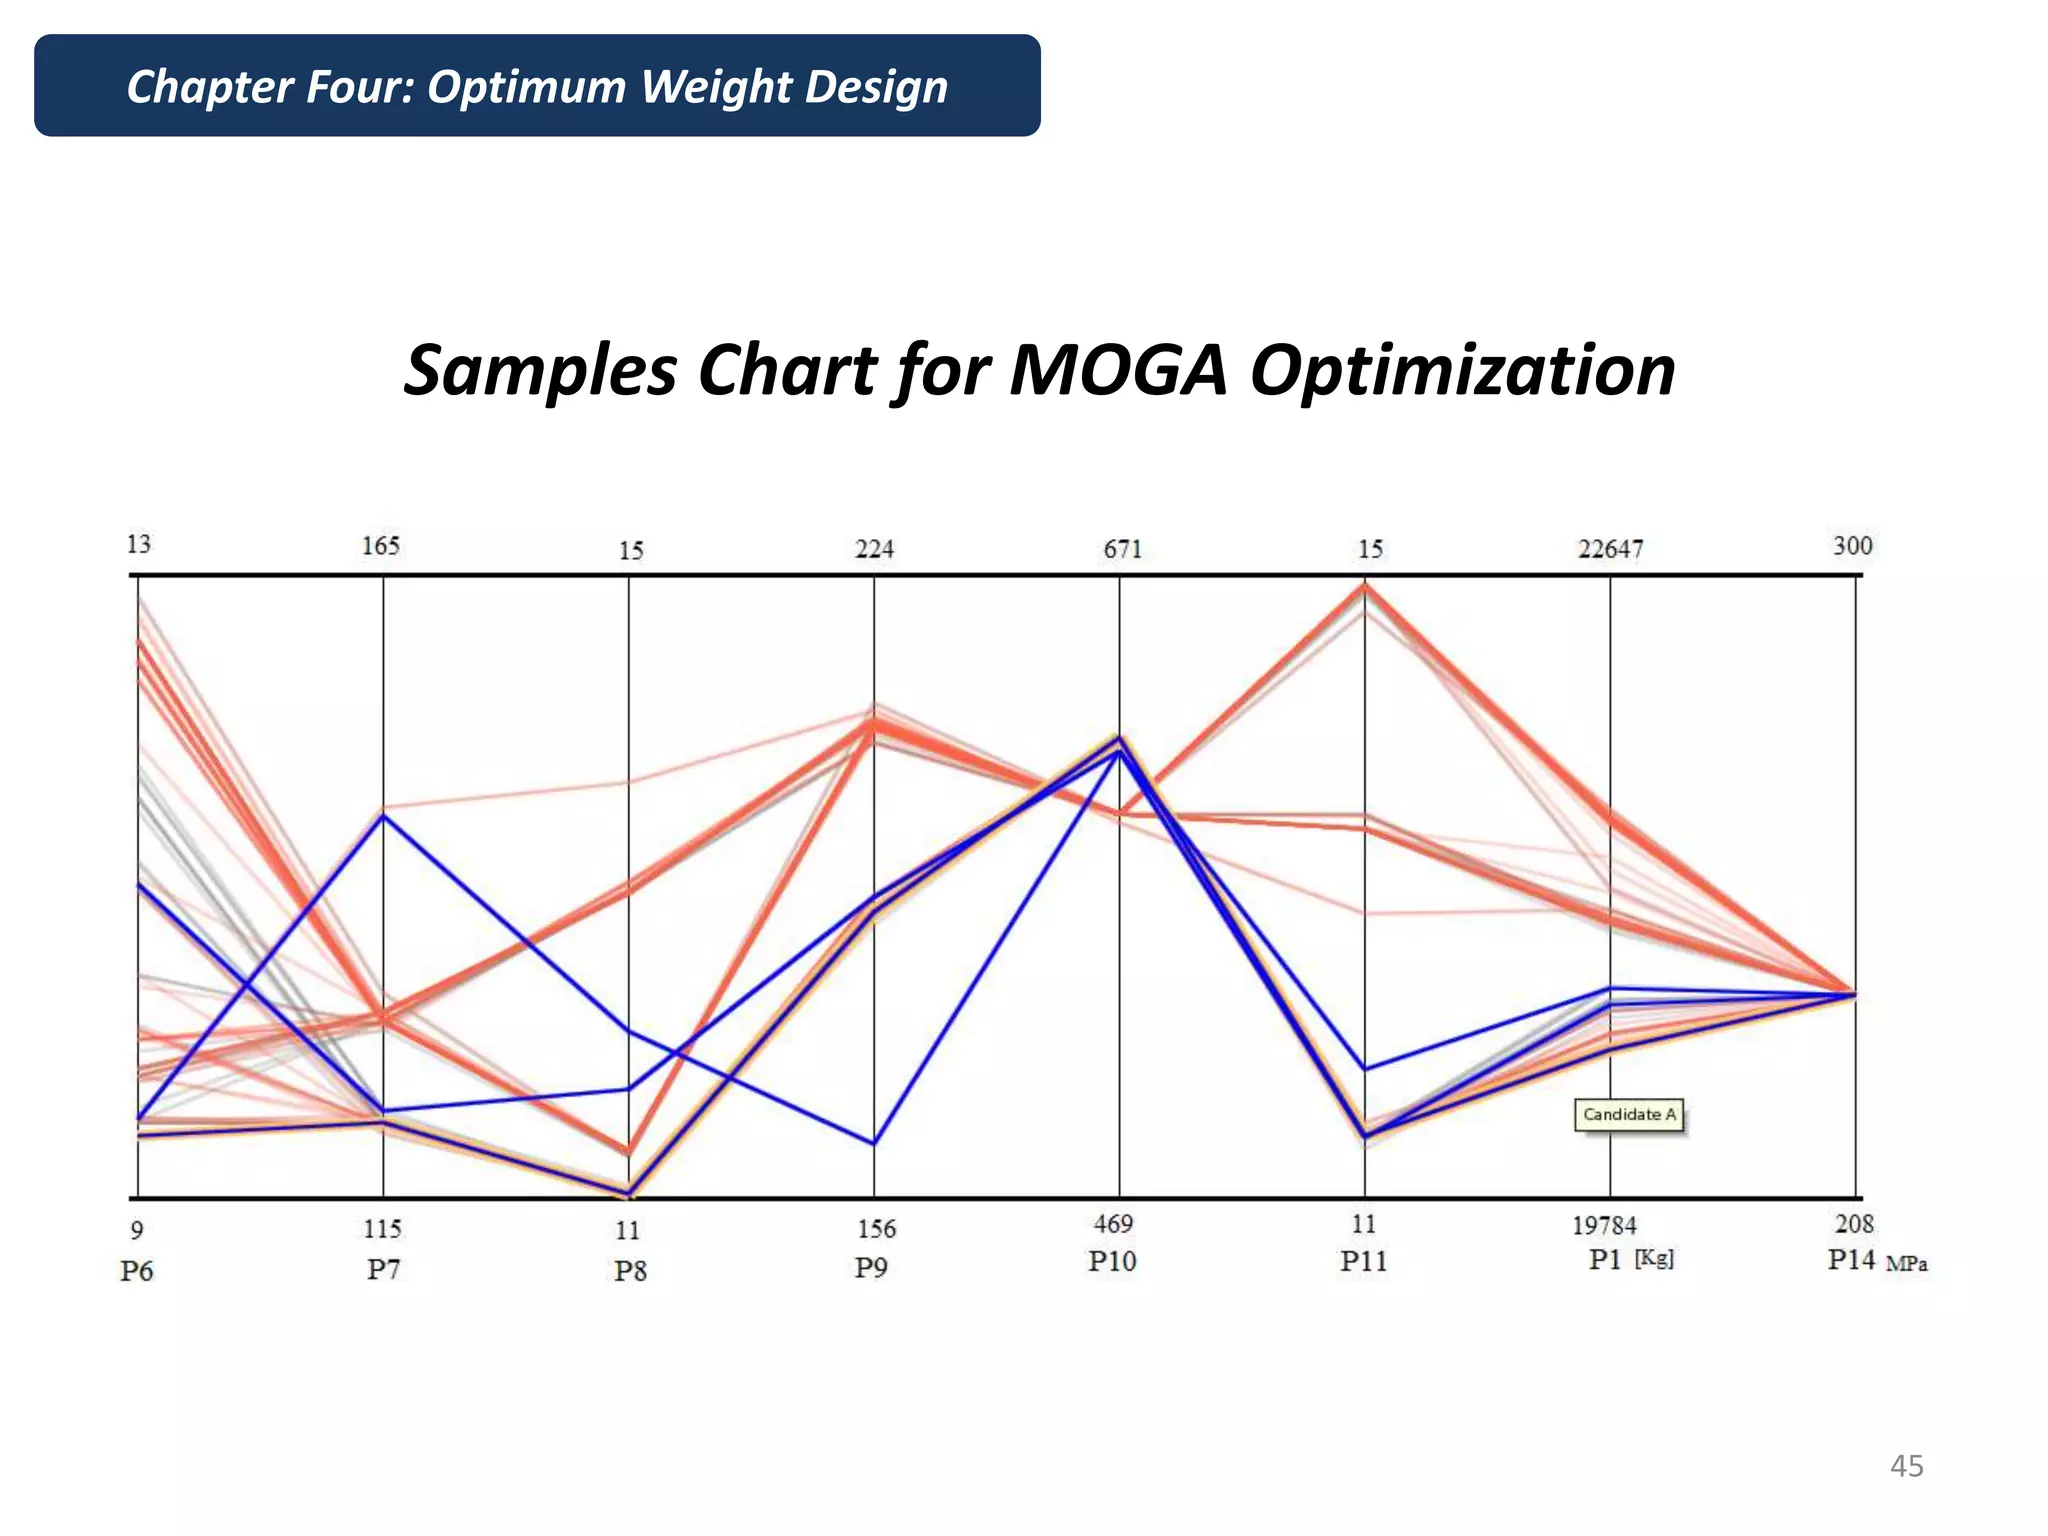
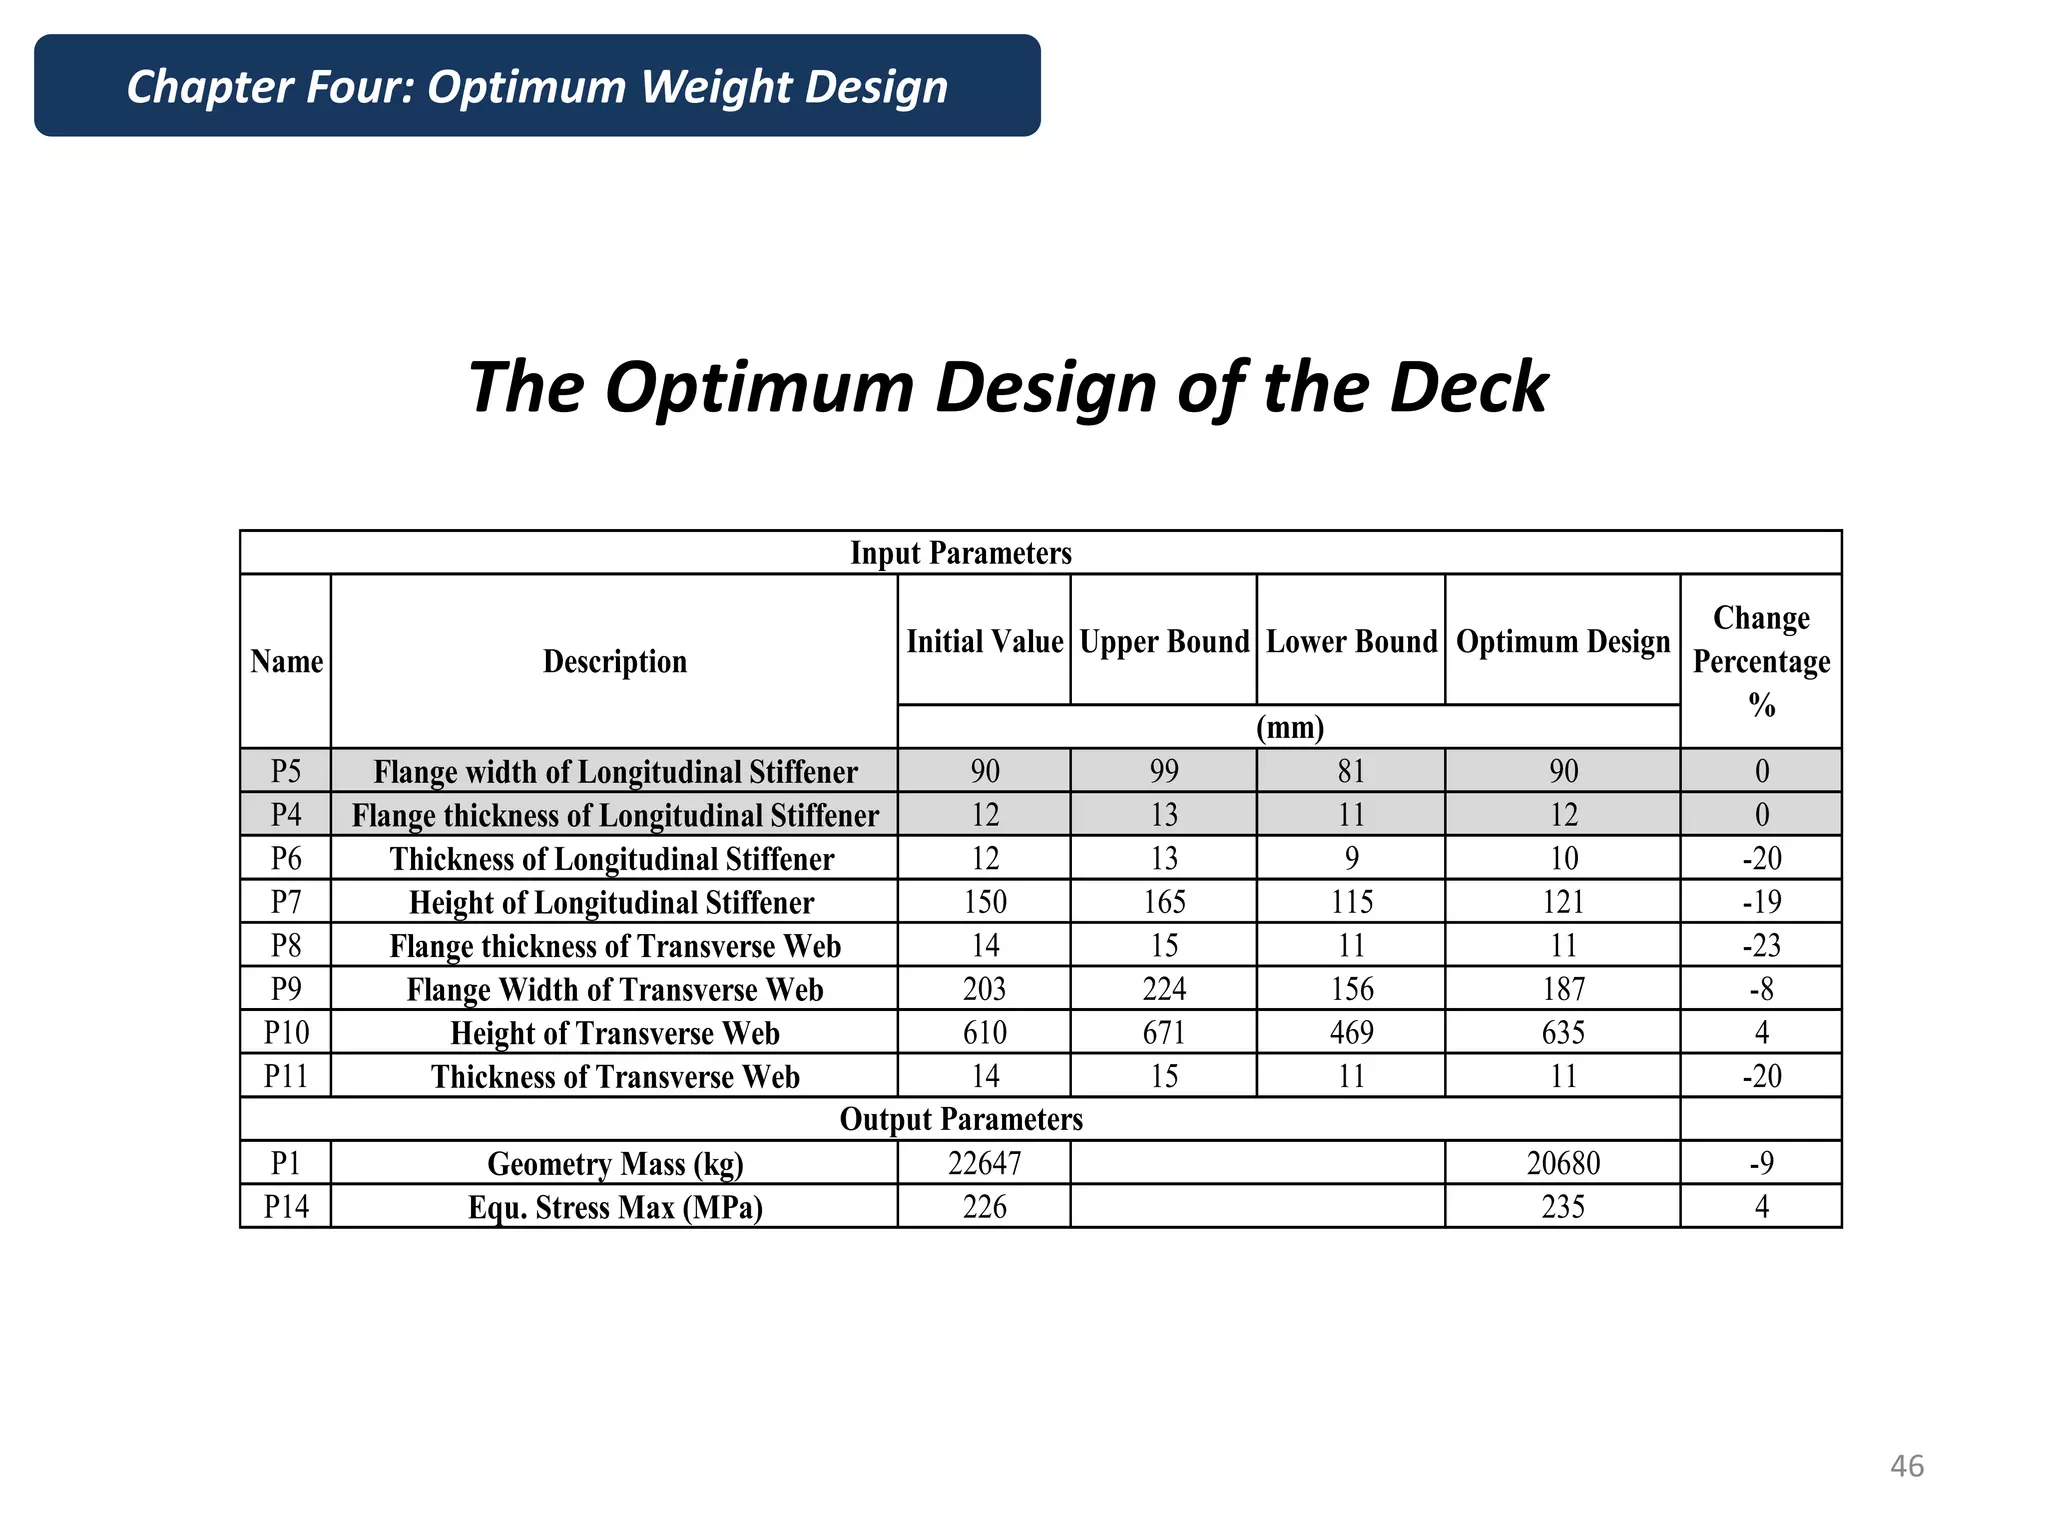
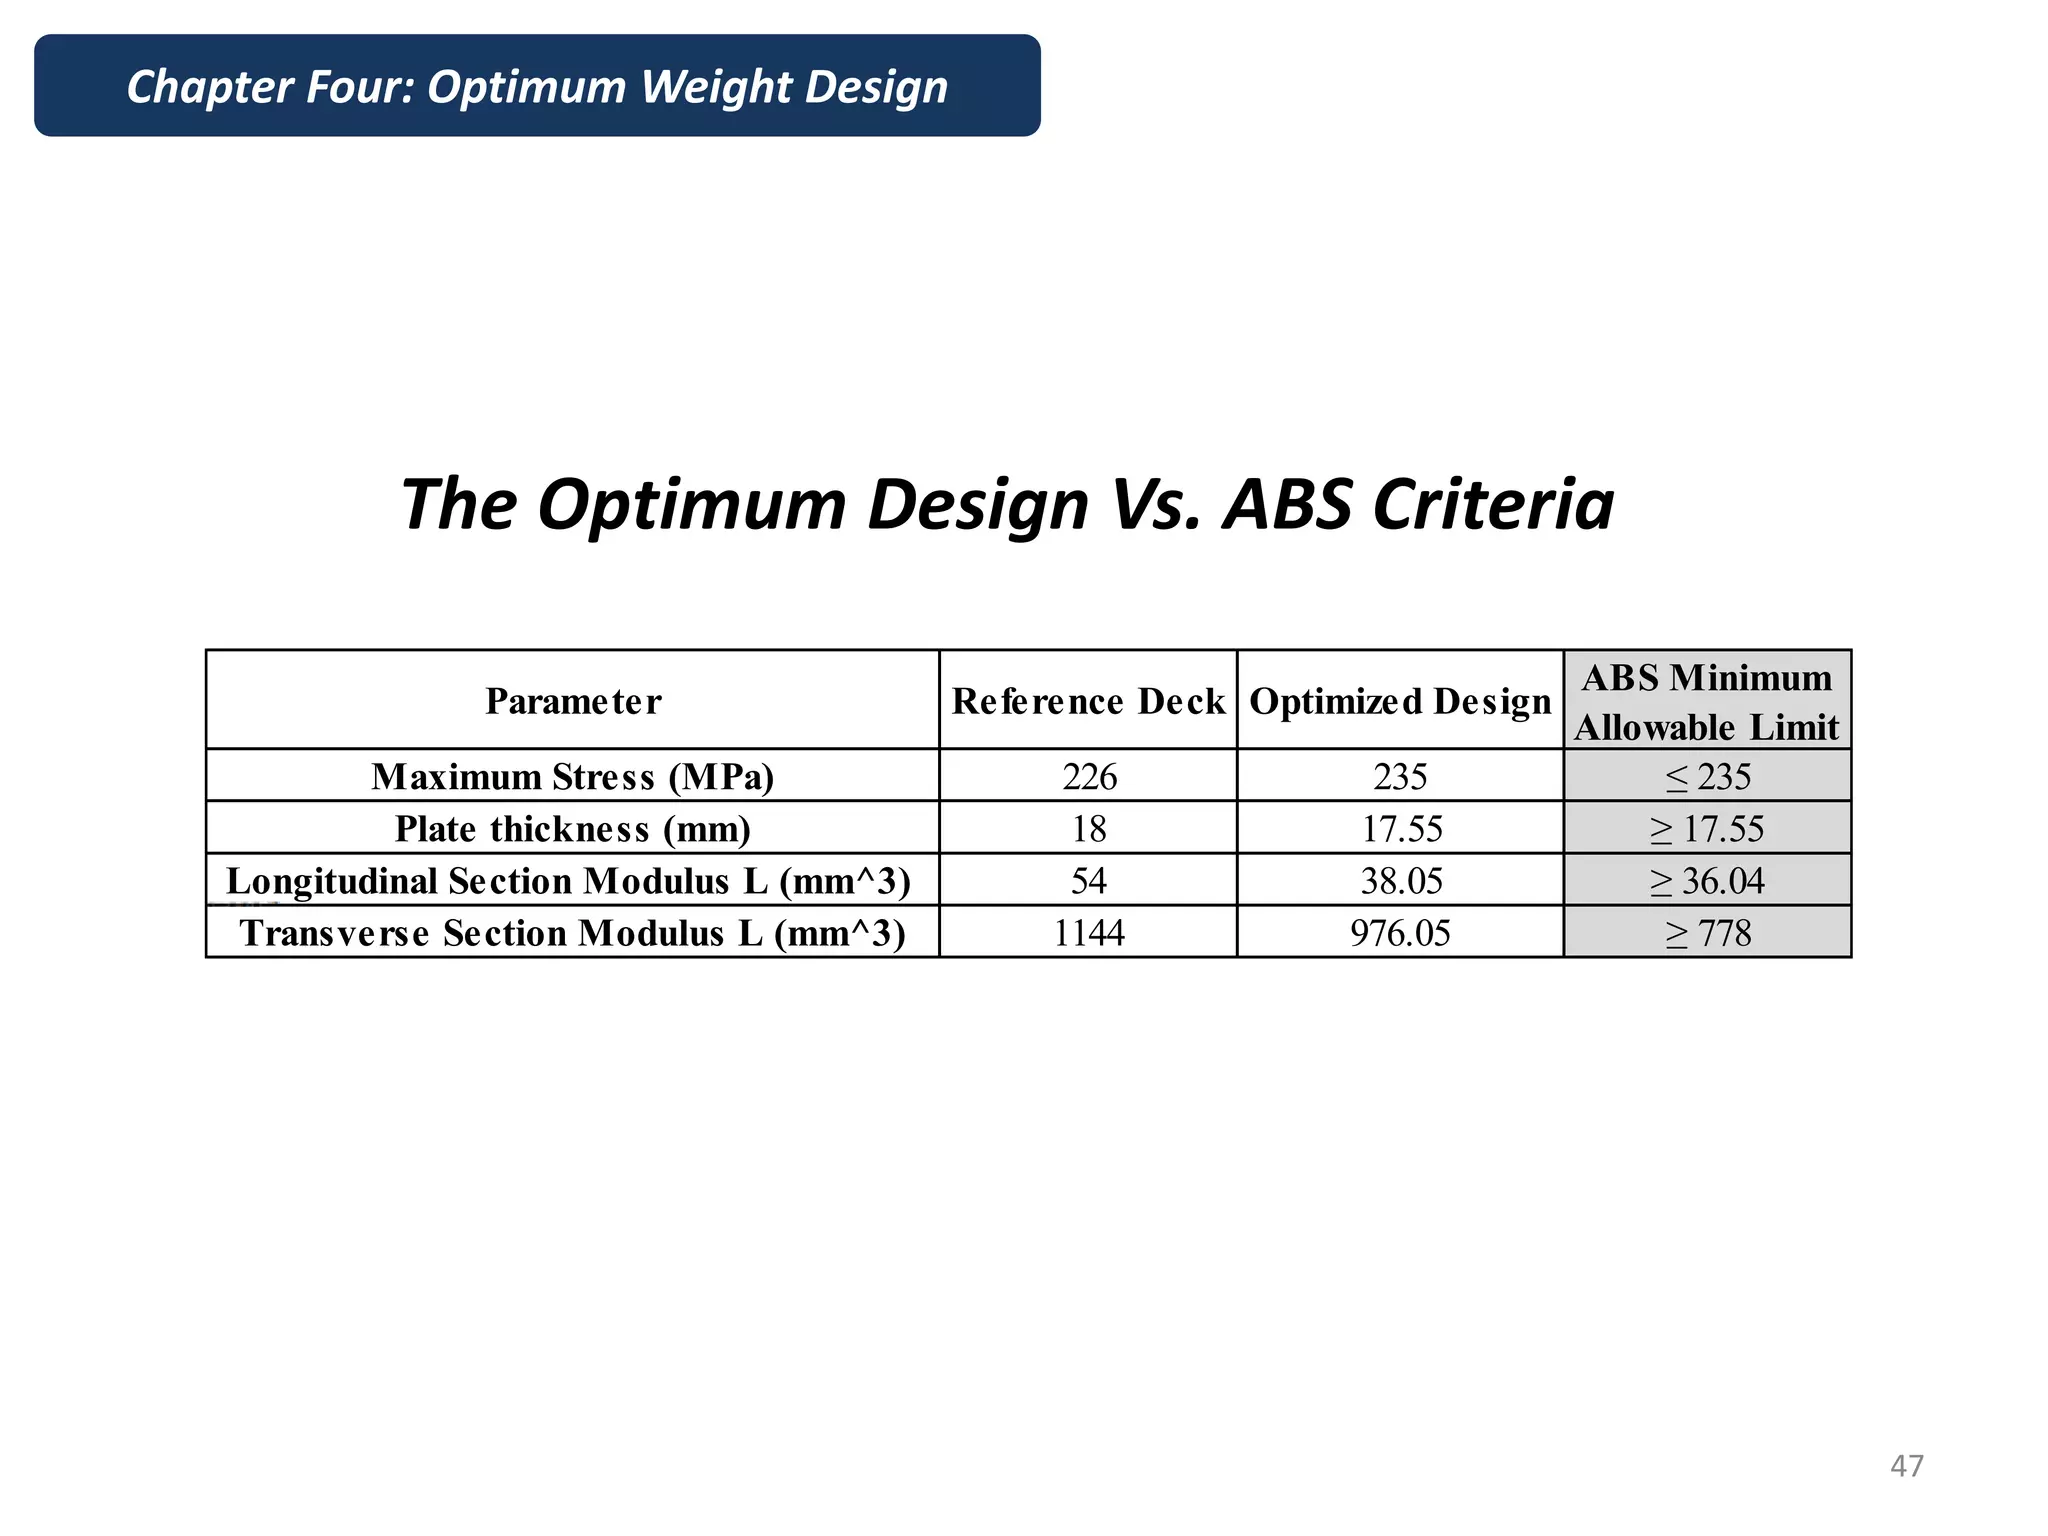
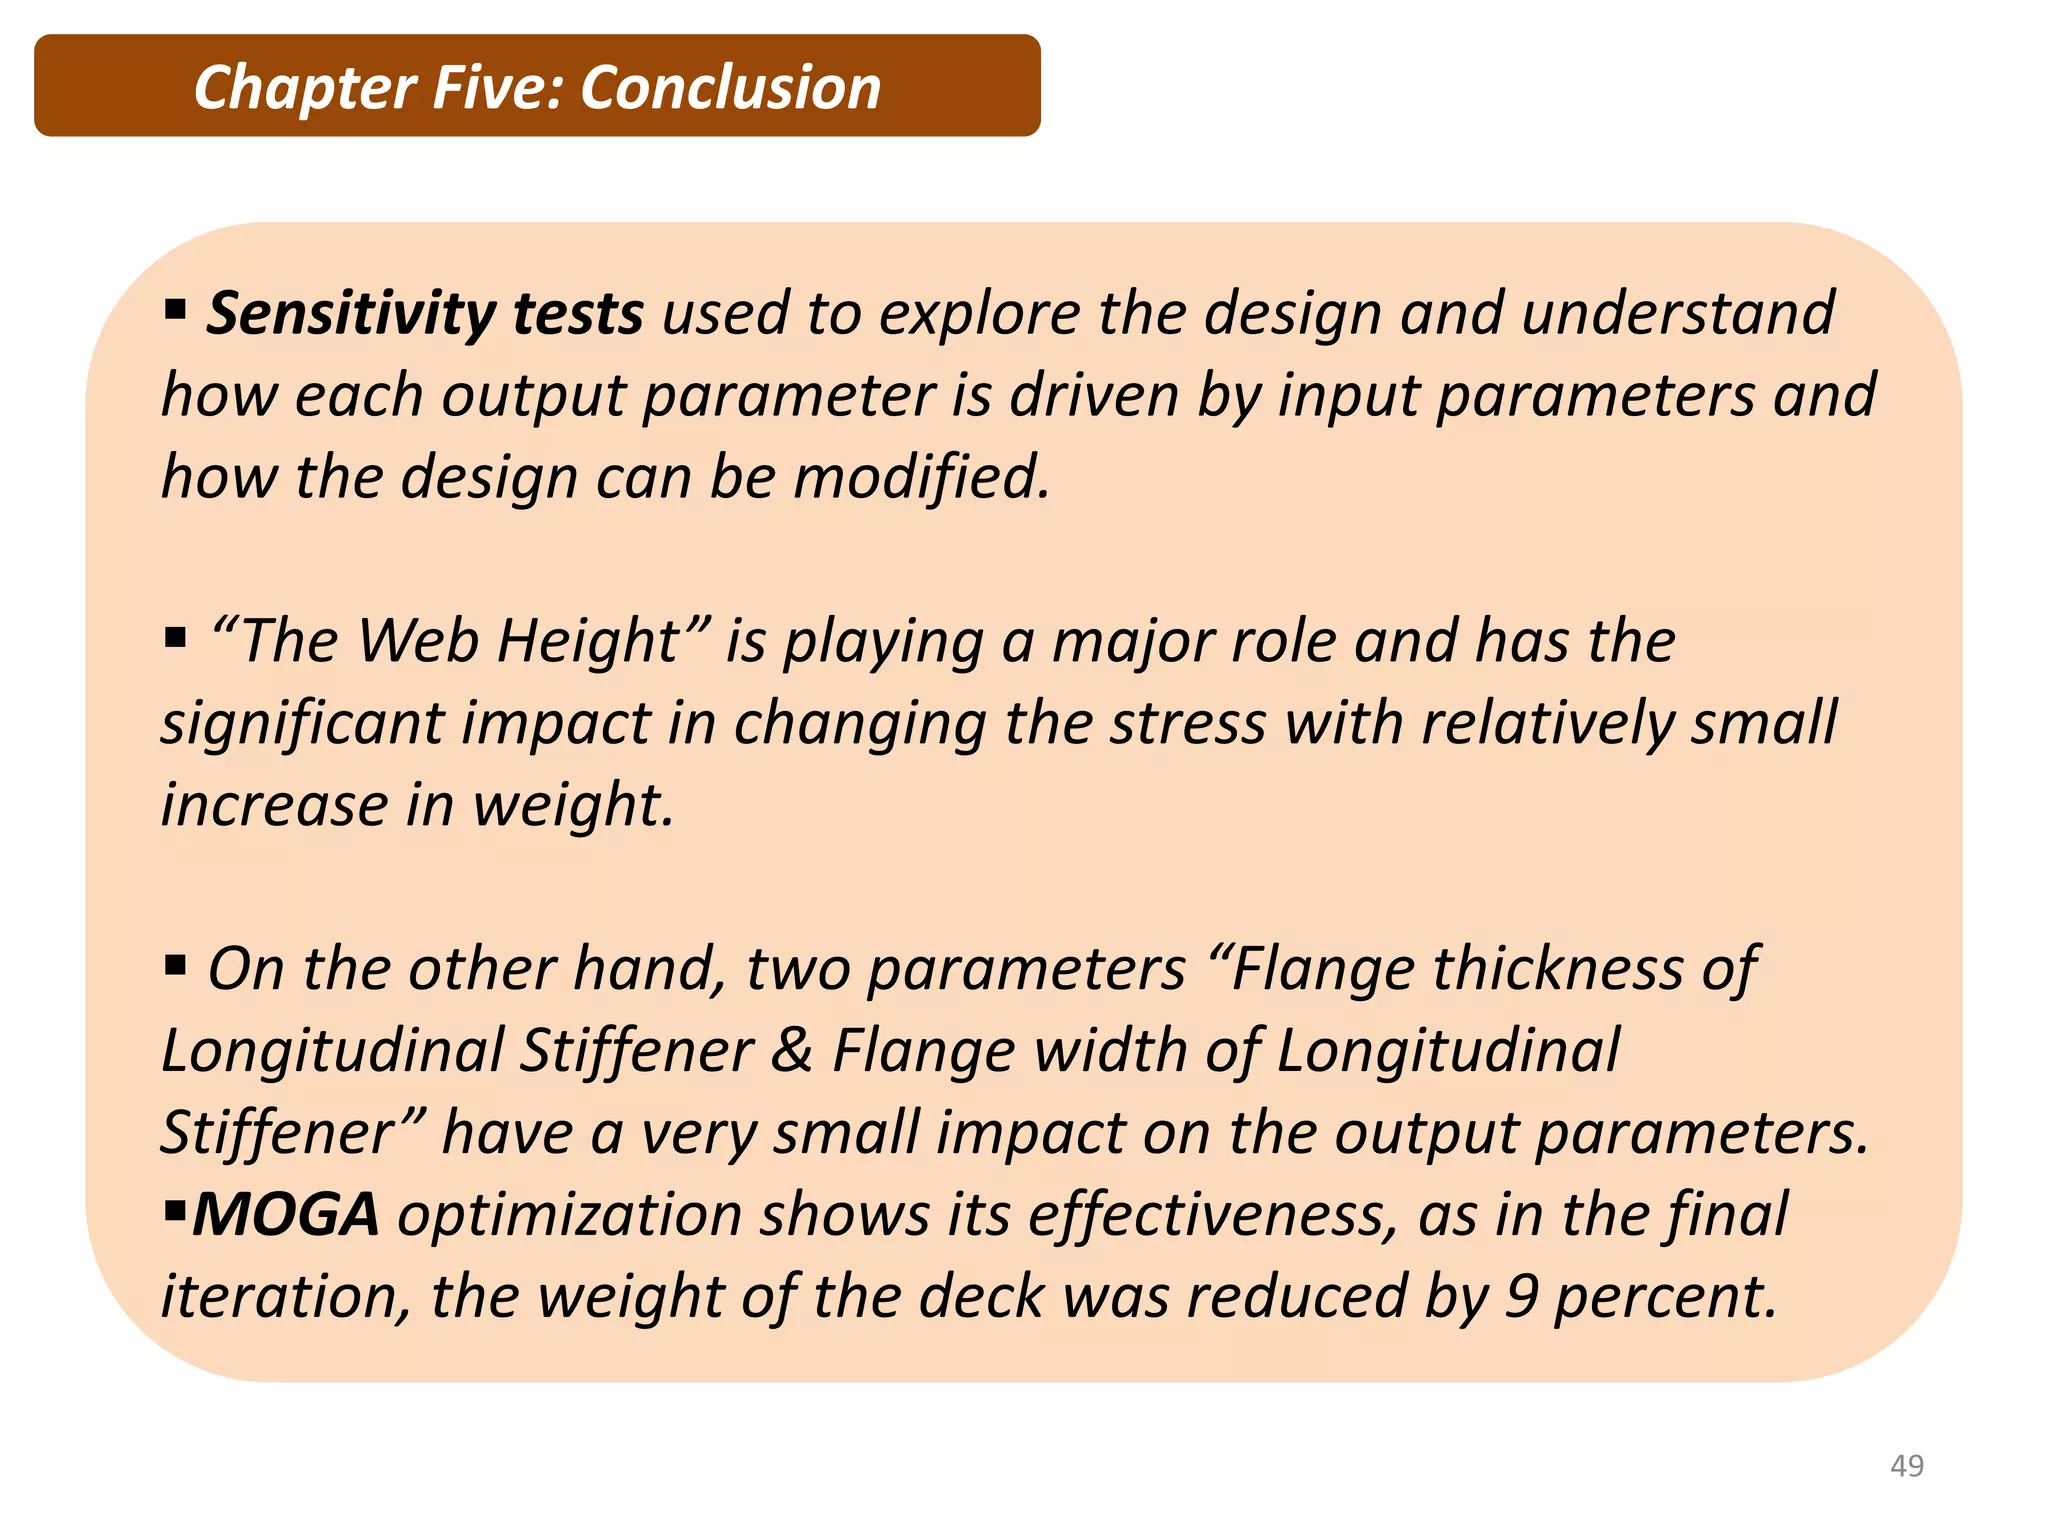
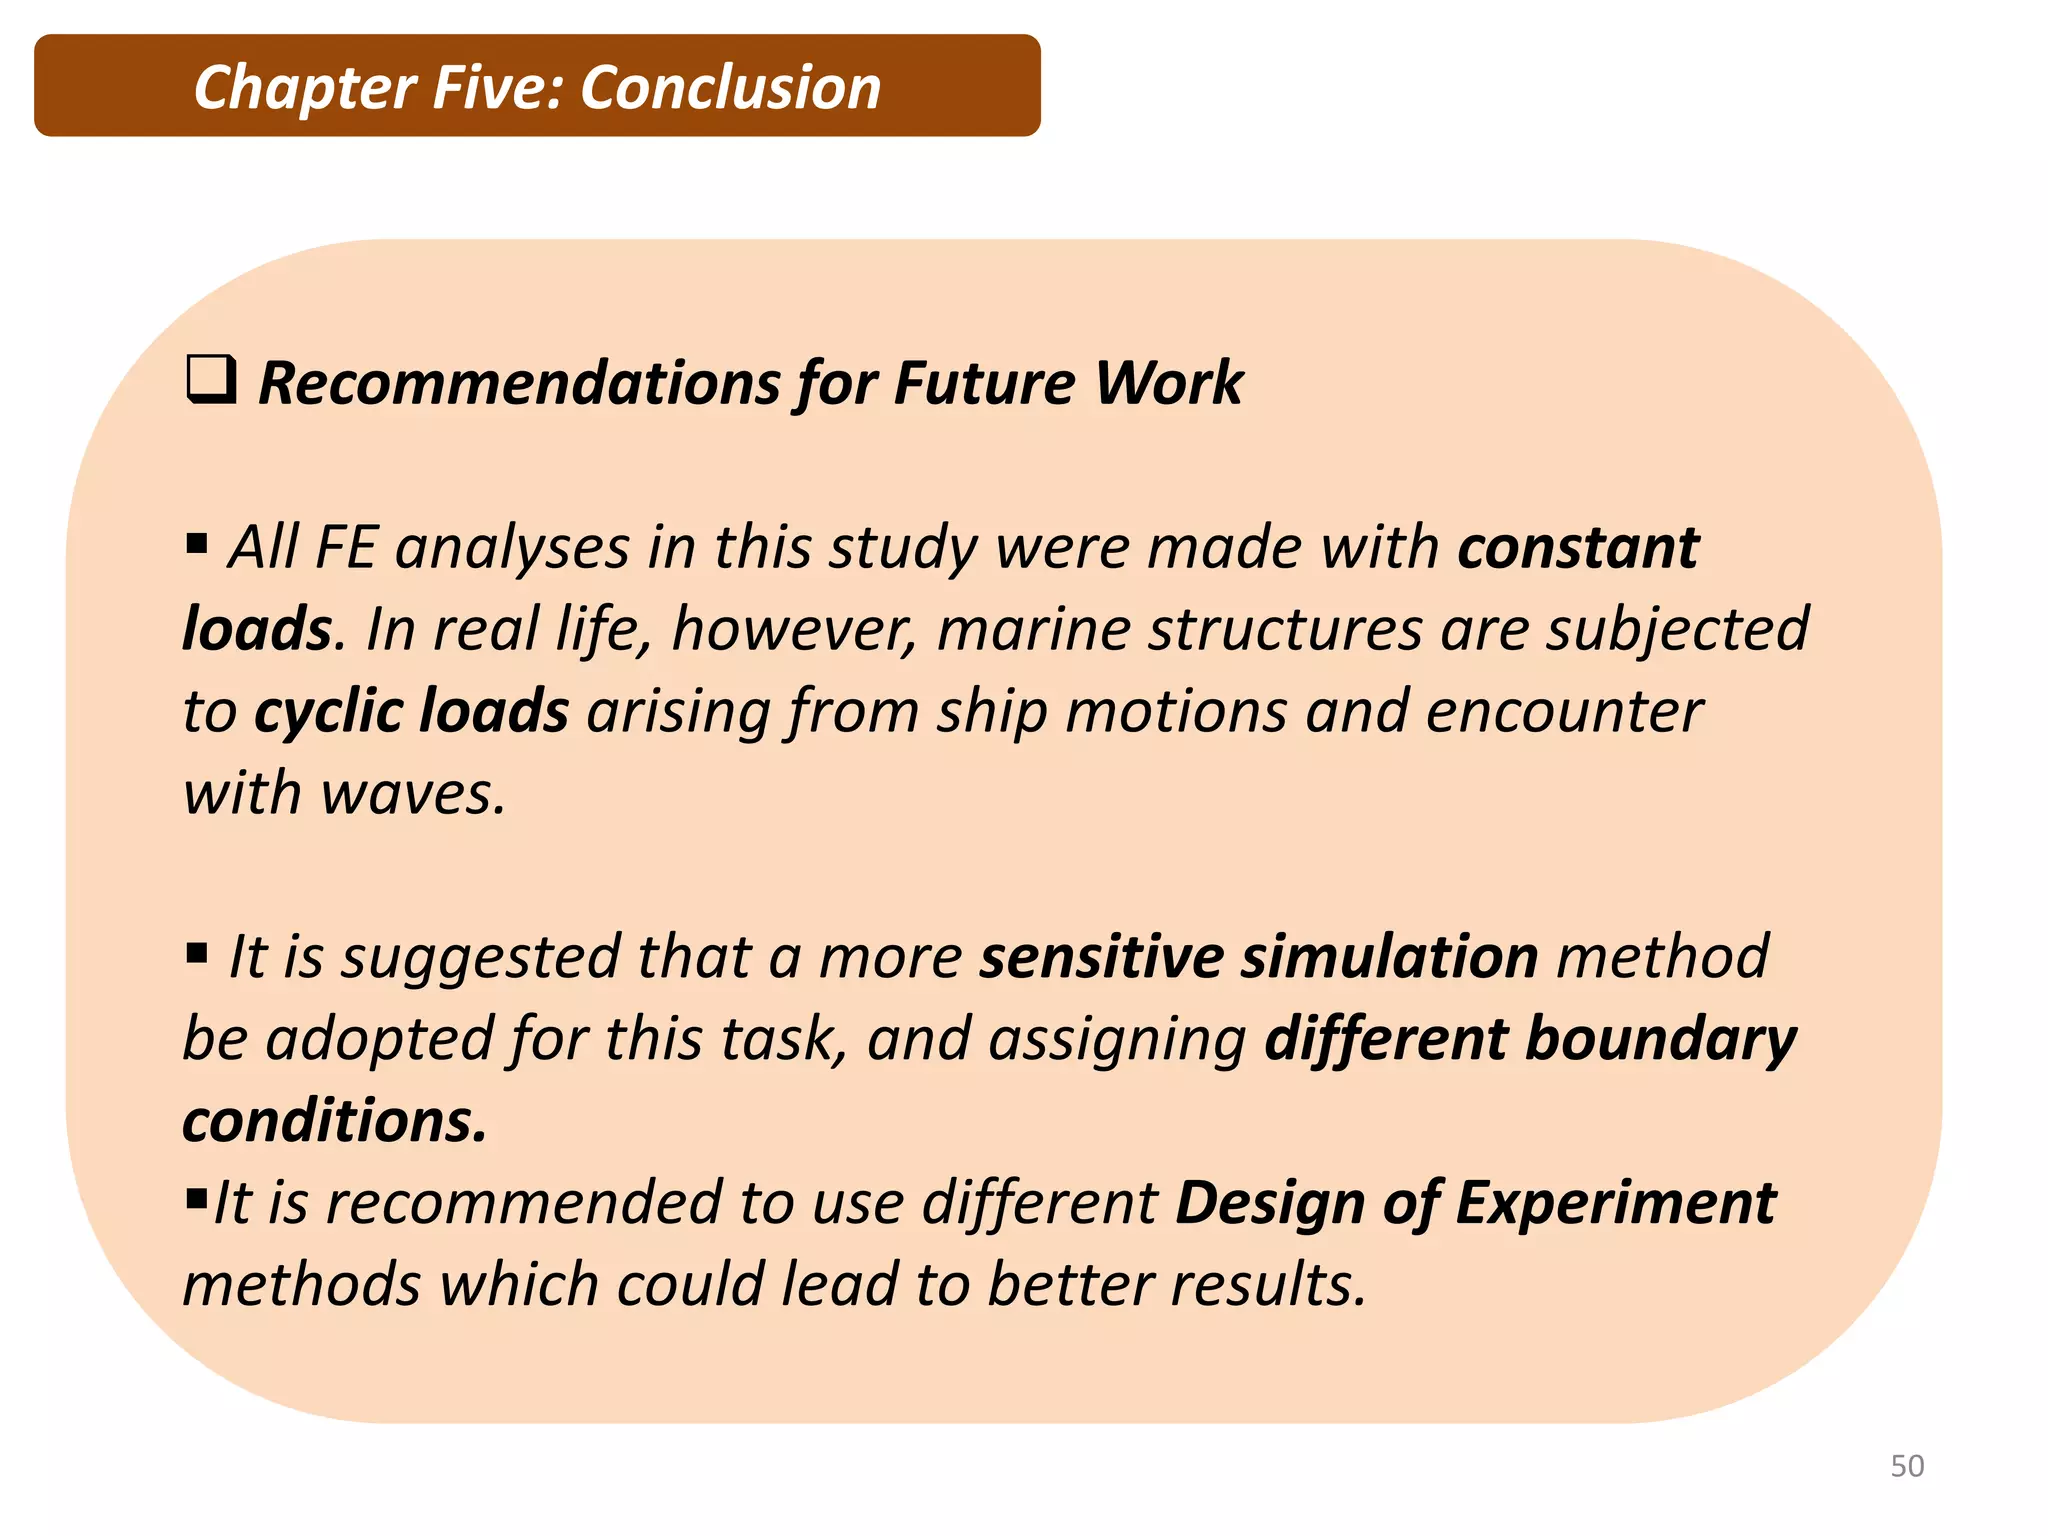
Stiffened Panels structures are widely used because they make the structure more cost-effective by offering a desirable strength/weight ratio, and is in so far that even small weight reduction of each of them can significantly affect the total empty weight of the structure. The reduction in the structural weight of ships gives valuable advantages such as; increasing their cargo-carrying efficiency, decrease in material cost supersedes the higher production costs, also lighter vessels requires engines with lower power, which means less emission of hazardous gases produced by marine diesel engines.
In this research a barge’s deck is evaluated by means of finite element analysis and optimized by parametric sensitivity analysis and numerical optimization methods, and the results would show that the deck structure could be developed further by utilizing the optimization techniques to reduce their weight by up to 9%.
1. Optimum Weight Design of
Ship’s Structures
with Application to a Barge’s Deck
By: Mohamed Moanes Abdel Salam
Prof. El-Sayed Hegazy
Professor of Ship’s Structures
Department of Marine Engineering
Port-Said University
Dr. Ahmed Naguib
Asst. Prof of Ship’s Structures
Department of Marine Engineering
Arab Academy (AAST)
Supervisors
1
5. Minimizing structural weight can have significant
impacts on;
• Production cost
• Vessel Speed
• Lifecycle cost
• Pollution
Design for Minimum Weight
Chapter One: Background and Motivation
5
6. Stiffened Panels
Stiffened panels are main member in marine structures
since half of twentieth century, as they are used in several
usages such as; bottom, side, deck and bulkhead
constructions etc.
Chapter One: Background and Motivation
6
They are more cost-effective by offering a desirable
strength/weight ratio.
9. Chapter Two: Design Optimization
Design Optimization Goal
Design Optimization is to design better, more efficient
and less expensive systems. By determining the best case
without actually testing all possible cases and identify
the relationship between the performance of the product
(Maximum stress, Deformation, Mass etc.) and the design
variables (Dimensions, Material, Loads etc.).
9
10. Chapter Two: Design Optimization
Strategy of Experimentation
10
Best guess approach
One-factor-at-a-time
Factorial Approach
11. Chapter Two: Design Optimization
Strategy of Experimentation
Golf Example
11
12.
13. Chapter Two: Design Optimization
Strategy of Experimentation
13
Best guess approach (trial and error)
• Can continue indefinitely.
• Cannot guarantee that best solution has been found.
15. Chapter Two: Design Optimization
Strategy of Experimentation
One-factor-at-a-time (OFAT) approach
15
• Inefficient (requires many test runs).
• Fails to consider any possible interaction between factors.
20. Chapter Two: Design Optimization
Design Of Experiment Techniques
Used to determine the Location of sampling points. The
goal is to get as Accurate Response Surface as possible
with as few input combinations as possible.
20
24. Multi-Objective Genetic Algorithm
Stopping rule
Process use some stopping rule, such as;
o Fixed number of iterations.
o Fixed amount of CPU time.
o Fixed number of consecutive iterations without any
improvement in the best trial solution found so far.
Chapter Two: Design Optimization
24
26. A barge is a flat-Deck boat, built mainly to transport heavy goods
such as; containers, gravel and construction equipment.
Chapter Three: FEA for a Barge’s Deck
26
27. Reference Barge’s design
Length Overall 330 ft (100.58m)
Breadth Moulded 100 ft (30.48m)
Depth Moulded 20 ft (6.10m)
Design Draft 4.5m (Approx.)
Deadweight 10,500 Tons (Approx.)
Deck Strength 20 Ton/m2
Principal Dimensions
Chapter Three: FEA for a Barge’s Deck
27
30. Deck Element Model
Name Dimensions (mm)
Deck Element Plate 12.8 m x 7.62 m x 18
Longitudinal Stiffeners 150 x 90 x 12
Transverse Webs 609 x 203 x 14
DK Side Girder 609 x 345 x 12
Spacing of Longitudinal Beams 508
Spacing of Transverse Webs 1829
Deck Element Weight is 22.647 T
Chapter Three: FEA for a Barge’s Deck
30
31. Applying Symmetry Boundary Conditions
Reduces the CPU time to the half, while delivering the same
level of accuracy in the results.
Chapter Three: FEA for a Barge’s Deck
31
32. 32
Element Size
(mm)
No. of
Elements
Equ. Stress
Max. (MPa)
110 8130 221
100 11664 221.36
95 12426 222.47
90 14954 225.95
85 16556 226.38
80 17590 226.49
75 20622 226.57
More elements in a mesh might give more accurate results
but can significantly increase the computational time. 14954
elements (9mm quadratic) used to create a fine mesh.
Chapter Three: FEA for a Barge’s Deck
Meshing
35. ABS Barge Rules
The performance of the reference deck and the ABS
class minimum requirements for the deck dimensions.
Chapter Four: Optimum Weight Design
35
Parameter Reference Deck
ABS Minimum
Allowable Limit
Maximum Stress (MPa) 226 ≤ 235
Plate thickness (mm) 18 ≥ 17.55
Longitudinal Section Modulus L (mm^3) 54 ≥ 36.04
Transverse Section Modulus L (mm^3) 1144 ≥ 778
36. Input Parameters
Name Description
Initial Value
(mm)
P5 Flange width of Long. Stiffener 90
P4 Flange thickness of Long. 12
P6 Thickness of Long. Stiffener 12
P7 Height of Long. Stiffener 150
P8 Flange thickness of Trans. Web 14
P9 Flange Width of Trans. Web 203
P10 Height of Trans. Web 610
P11 Thickness of Trans. Web 14
Chapter Four: Optimum Weight Design
36
37. Upper & Lower Bounds
The output of the OSF was 82 Design Points.
Chapter Four: Optimum Weight Design
37
Initial Value Upper Bound Lower Bound
P4 Flange thickness of Longitudinal Stiffener 12 13 11
P5 Flange width of Longitudinal Stiffener 90 99 81
P6 Thickness of Longitudinal Stiffener 12 13 9
P7 Height of Longitudinal Stiffener 150 165 115
P8 Flange thickness of Transverse Web 14 15 11
P9 Flange Width of Transverse Web 203 224 156
P10 Height of Transverse Web 610 671 469
P11 Thickness of Transverse Web 14 15 11
Name Description
Input Parameters
(mm)
39. Sensitivities Chart
Positive sensitivity occurs when increasing the input increases the
output, negative sensitivity occurs when increasing the input
decreases the output.
Chapter Four: Optimum Weight Design
39
40. Sensitivities Chart
The larger the change of the output parameters, the more
significant is the role of the input parameters that were varied.
Output Parameter – Equivalent stress max.
Chapter Four: Optimum Weight Design
40
41. Number Of Parameters Vs. Number of Design Points
Chapter Four: Optimum Weight Design
41
After disabling P4 & P5 the number of design
points that created by OSF method reduced from
82 design points for 8 input parameters to 45
design points for 6 parameters.
49. Sensitivity tests used to explore the design and understand
how each output parameter is driven by input parameters and
how the design can be modified.
“The Web Height” is playing a major role and has the
significant impact in changing the stress with relatively small
increase in weight.
On the other hand, two parameters “Flange thickness of
Longitudinal Stiffener & Flange width of Longitudinal
Stiffener” have a very small impact on the output parameters.
MOGA optimization shows its effectiveness, as in the final
iteration, the weight of the deck was reduced by 9 percent.
Chapter Five: Conclusion
49
50. Recommendations for Future Work
All FE analyses in this study were made with constant
loads. In real life, however, marine structures are subjected
to cyclic loads arising from ship motions and encounter
with waves.
It is suggested that a more sensitive simulation method
be adopted for this task, and assigning different boundary
conditions.
It is recommended to use different Design of Experiment
methods which could lead to better results.
50
Chapter Five: Conclusion