Download as PDF, PPTX
![References
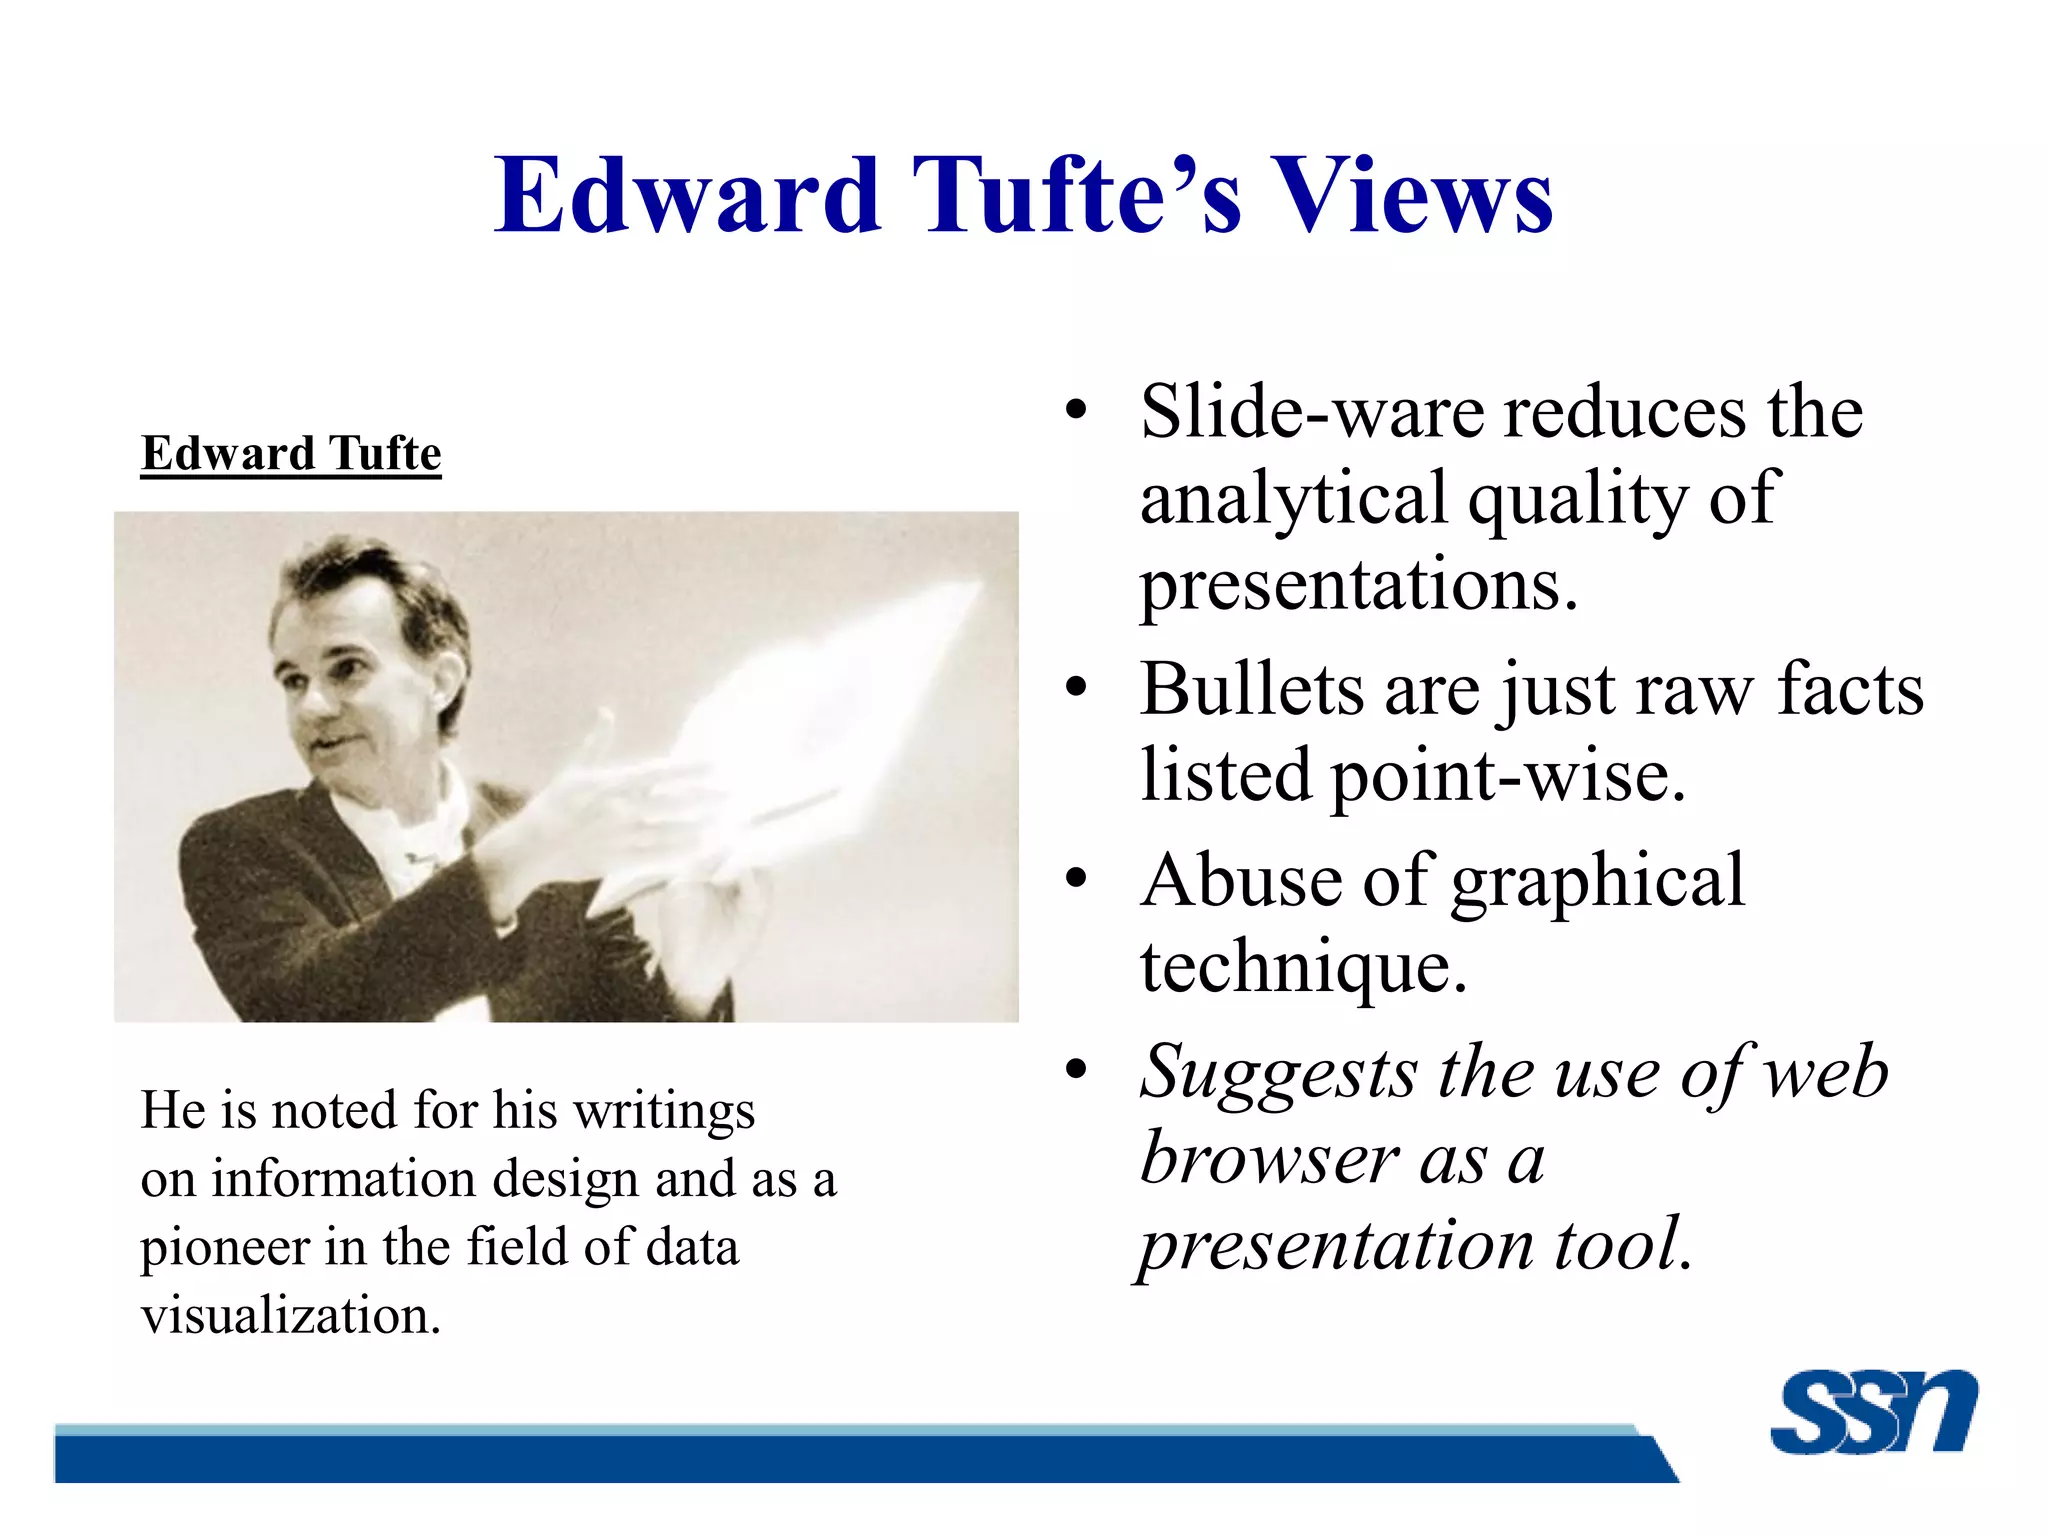
[1] Edward R. Tufte, “The Visual Display of Quantitative Information”,
Second Edition, Graphics Press LLC, 2001.
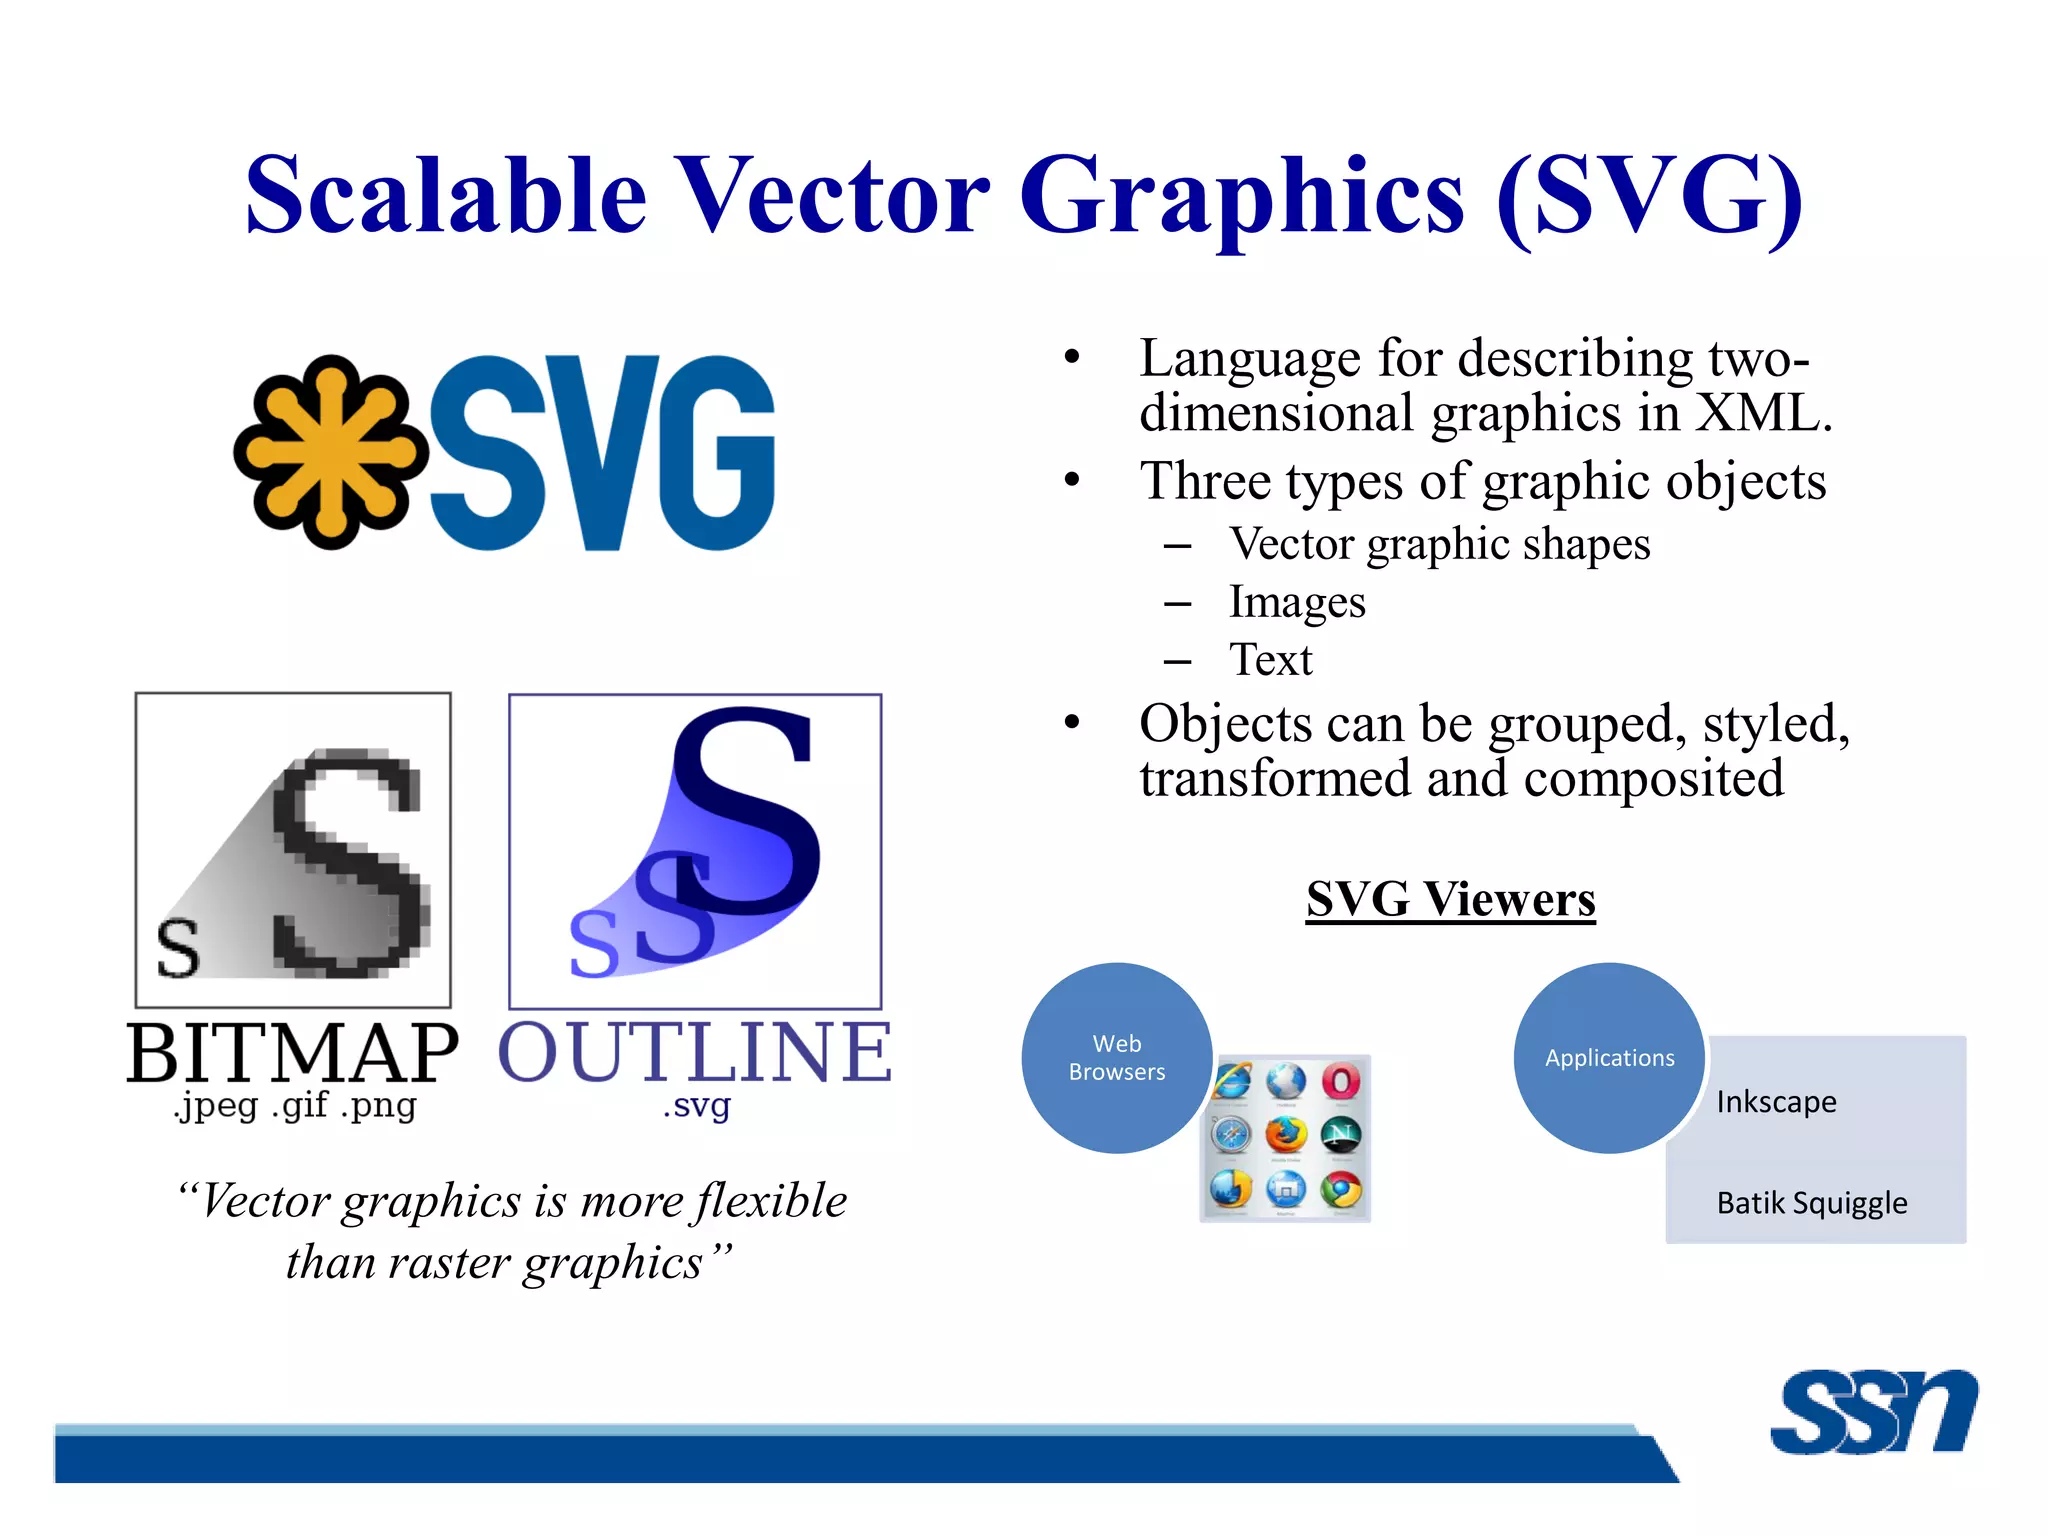
[2] W3C Recommendations, “Scalable Vector Graphics (SVG) 1.1”
(Second Edition)
http://www.w3.org/TR/SVG/
[3] Raphael.js, a cross-browser JavaScript library for drawing vector
graphics on websites
http://www.raphaeljs.com
[4] Apache Batik, Java classes for manipulating SVG
http://xmlgraphics.apache.org/batik/javadoc/
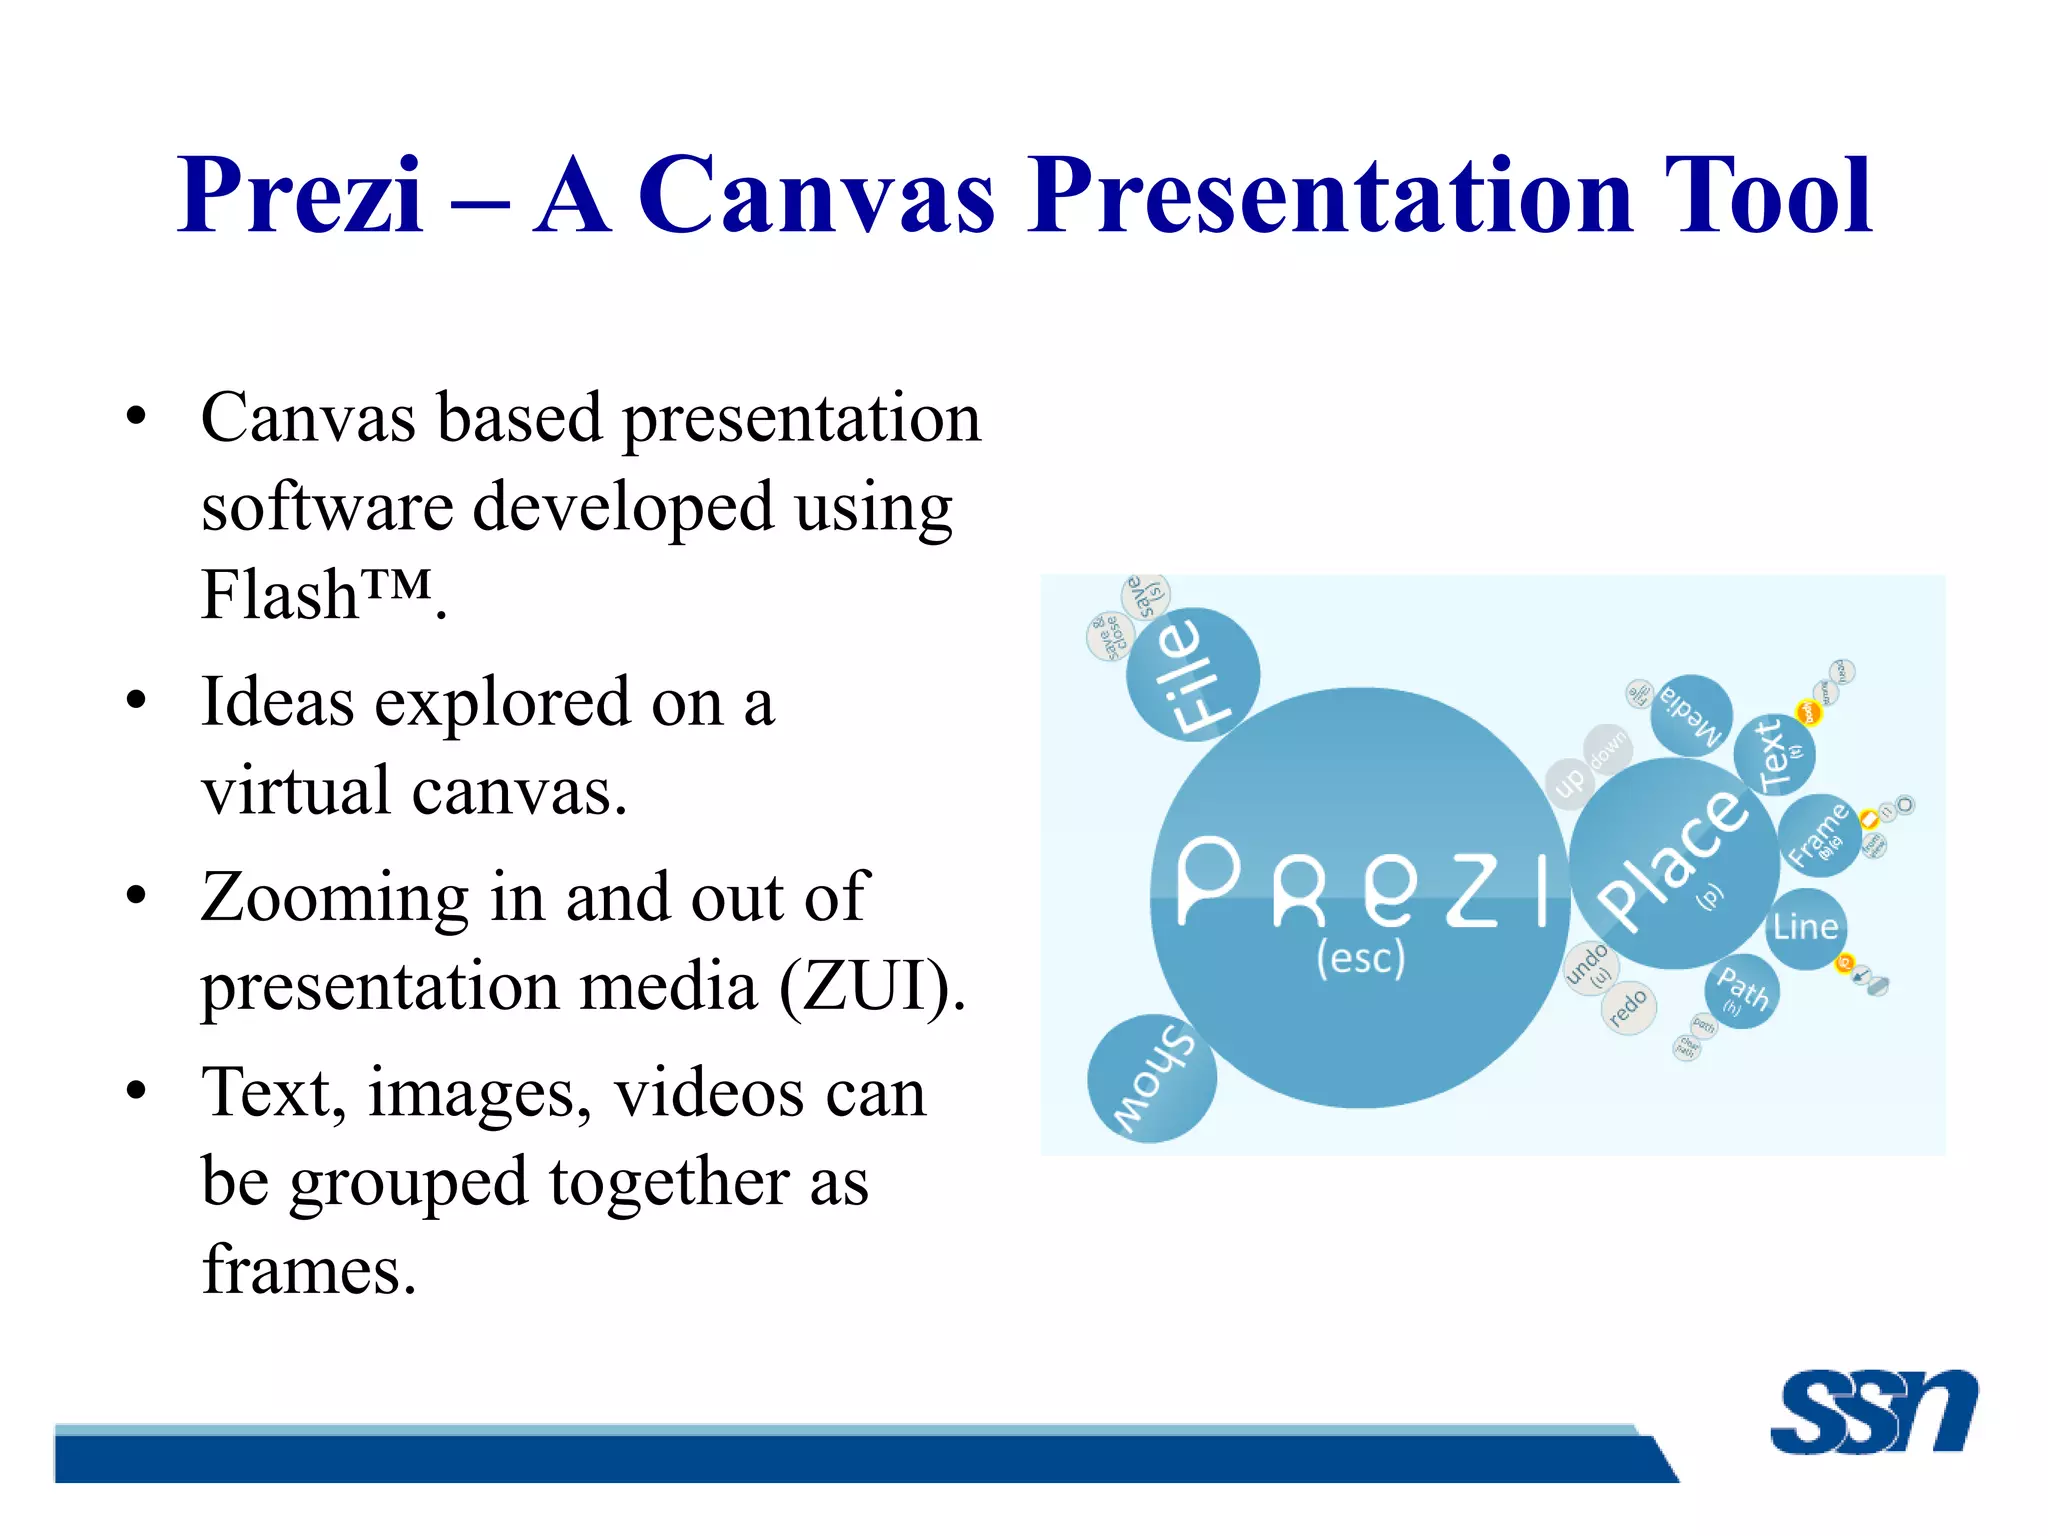
[5] Prezi, a cloud based SaaS presentation software
http://www.prezi.com
[6] Taymjong Bah, “Inkscape guide to a vector drawing program”,
Third Edition, Prentice Hall](https://image.slidesharecdn.com/zerothreviewpresentation-140716120103-phpapp01/75/Zeroth-review-presentation-14-2048.jpg)

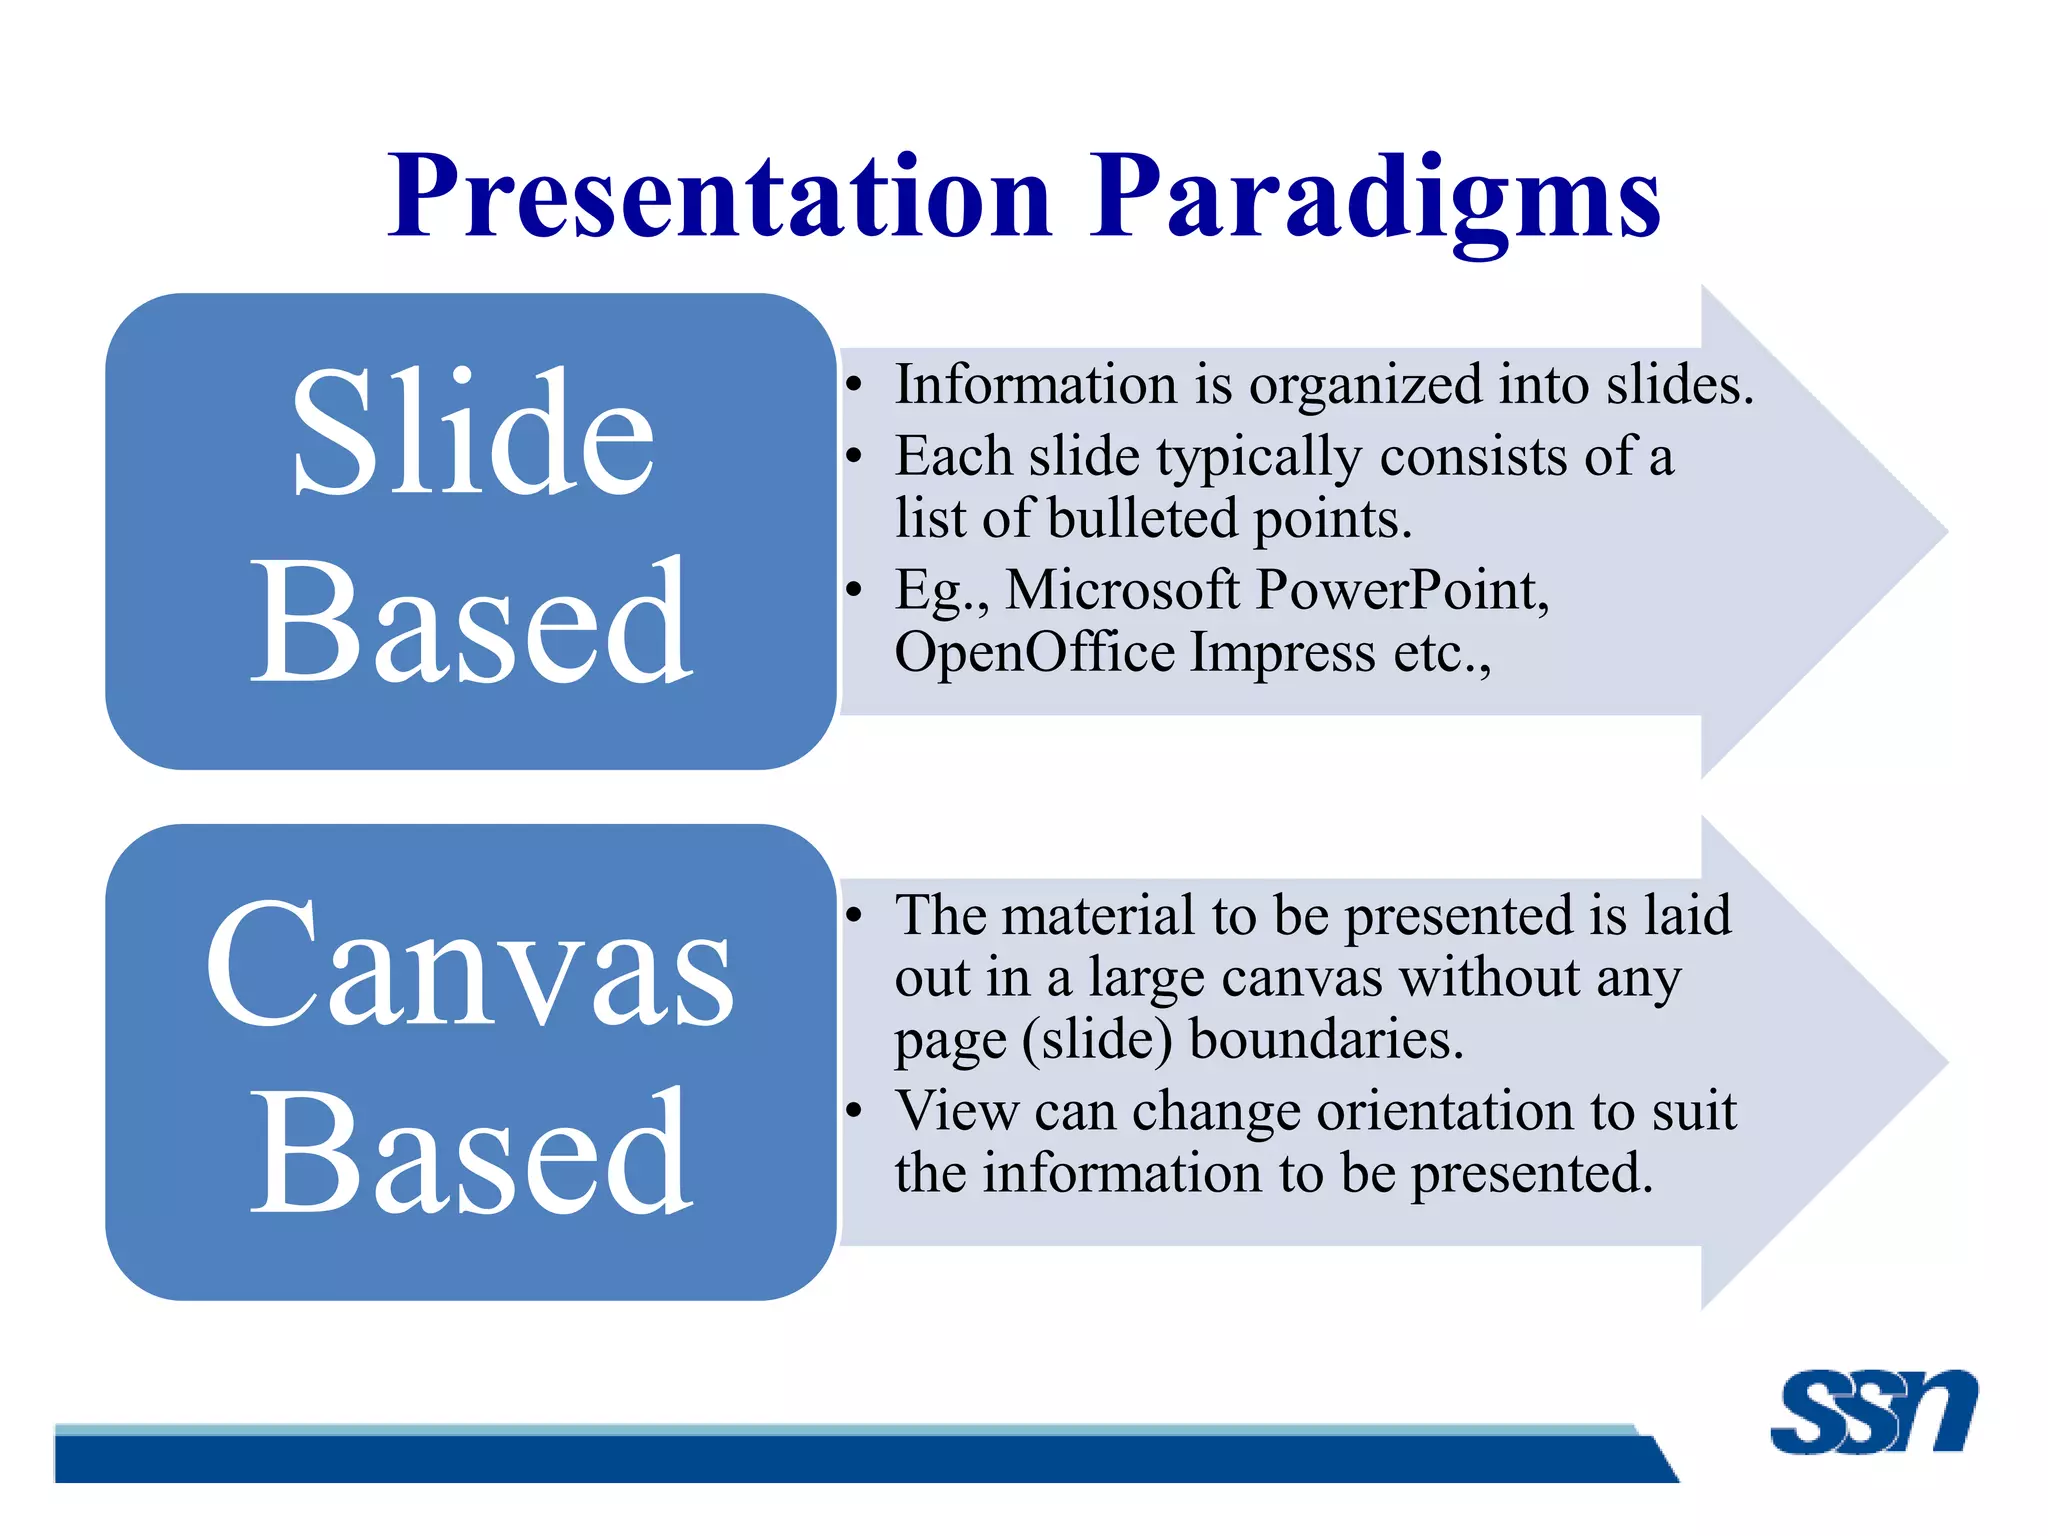
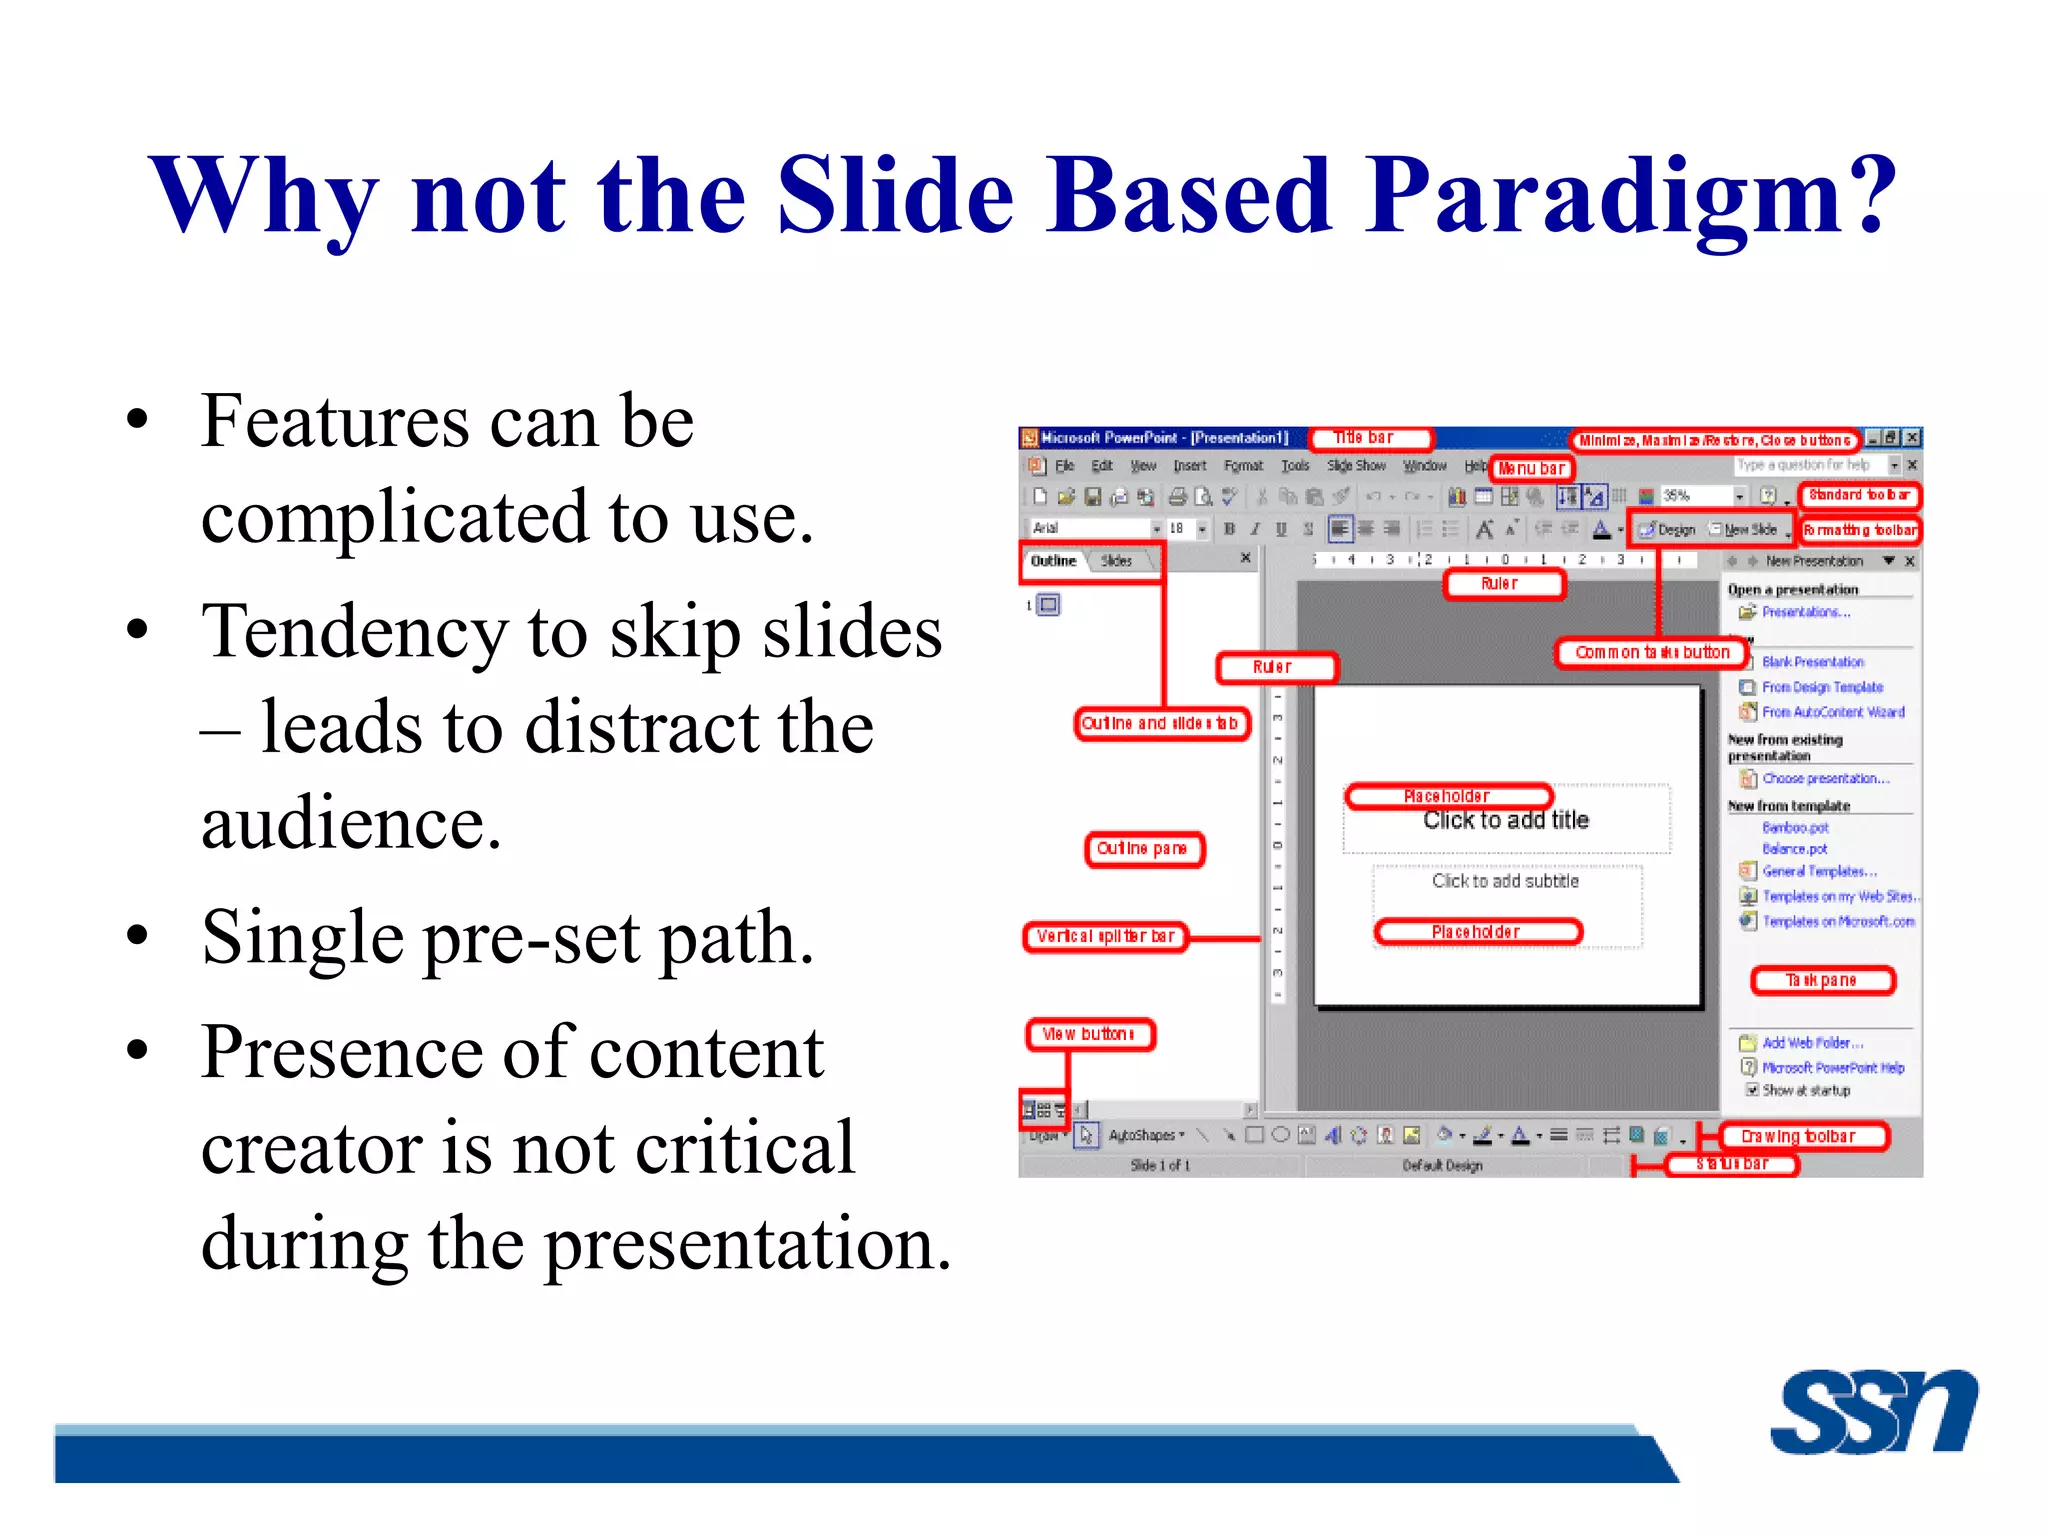
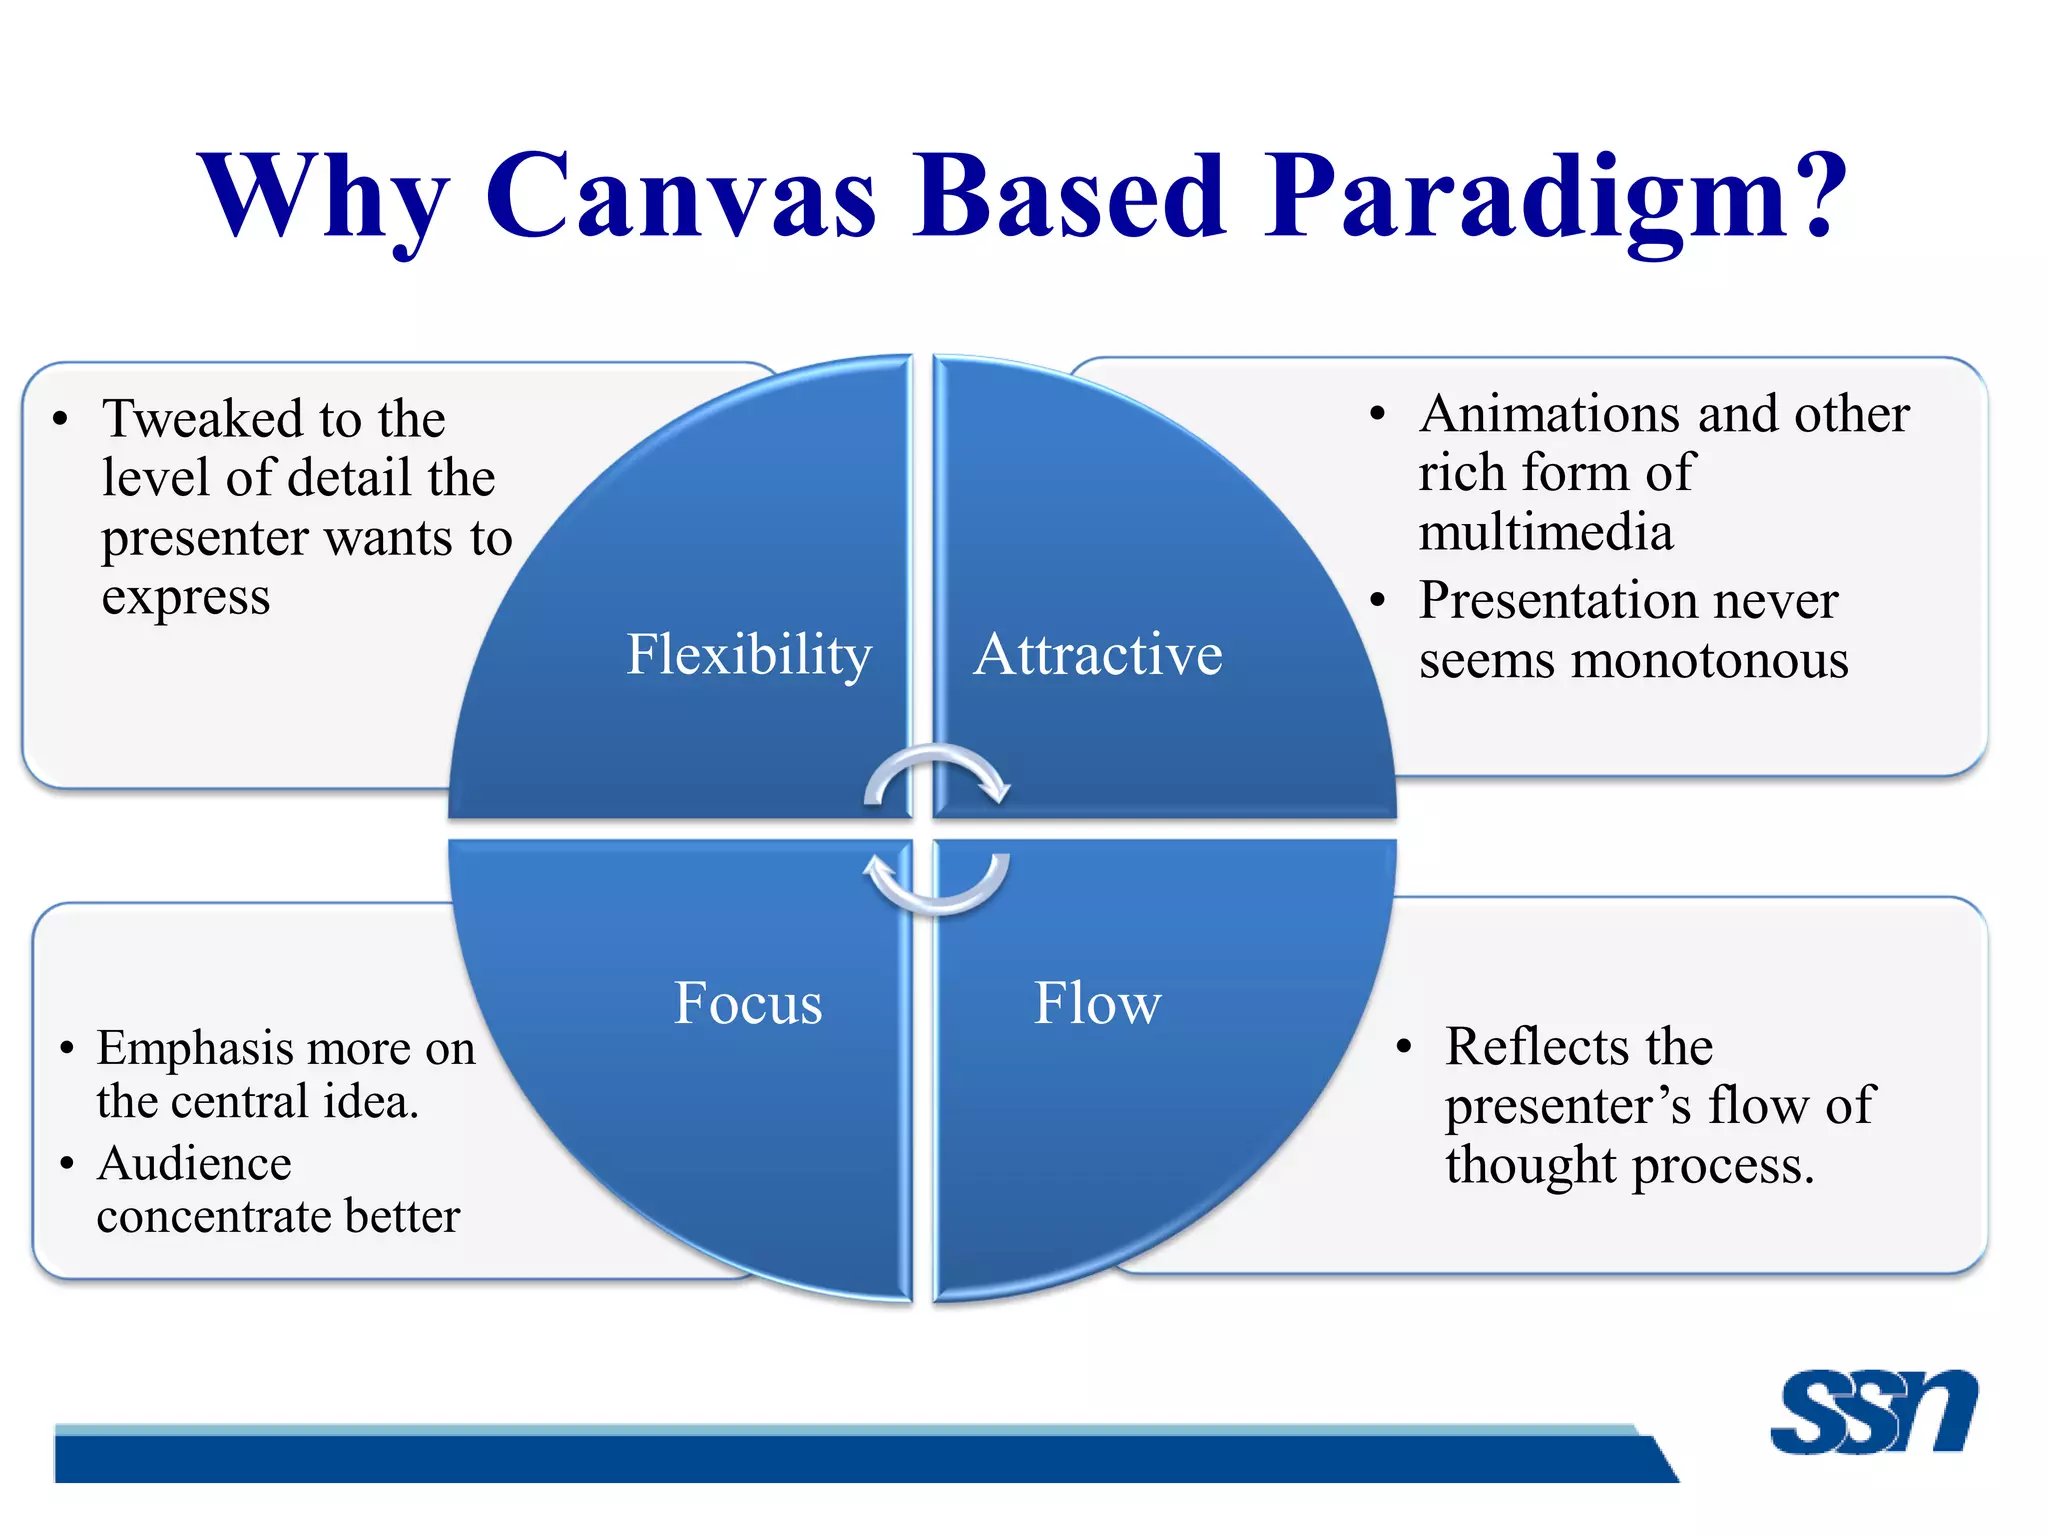
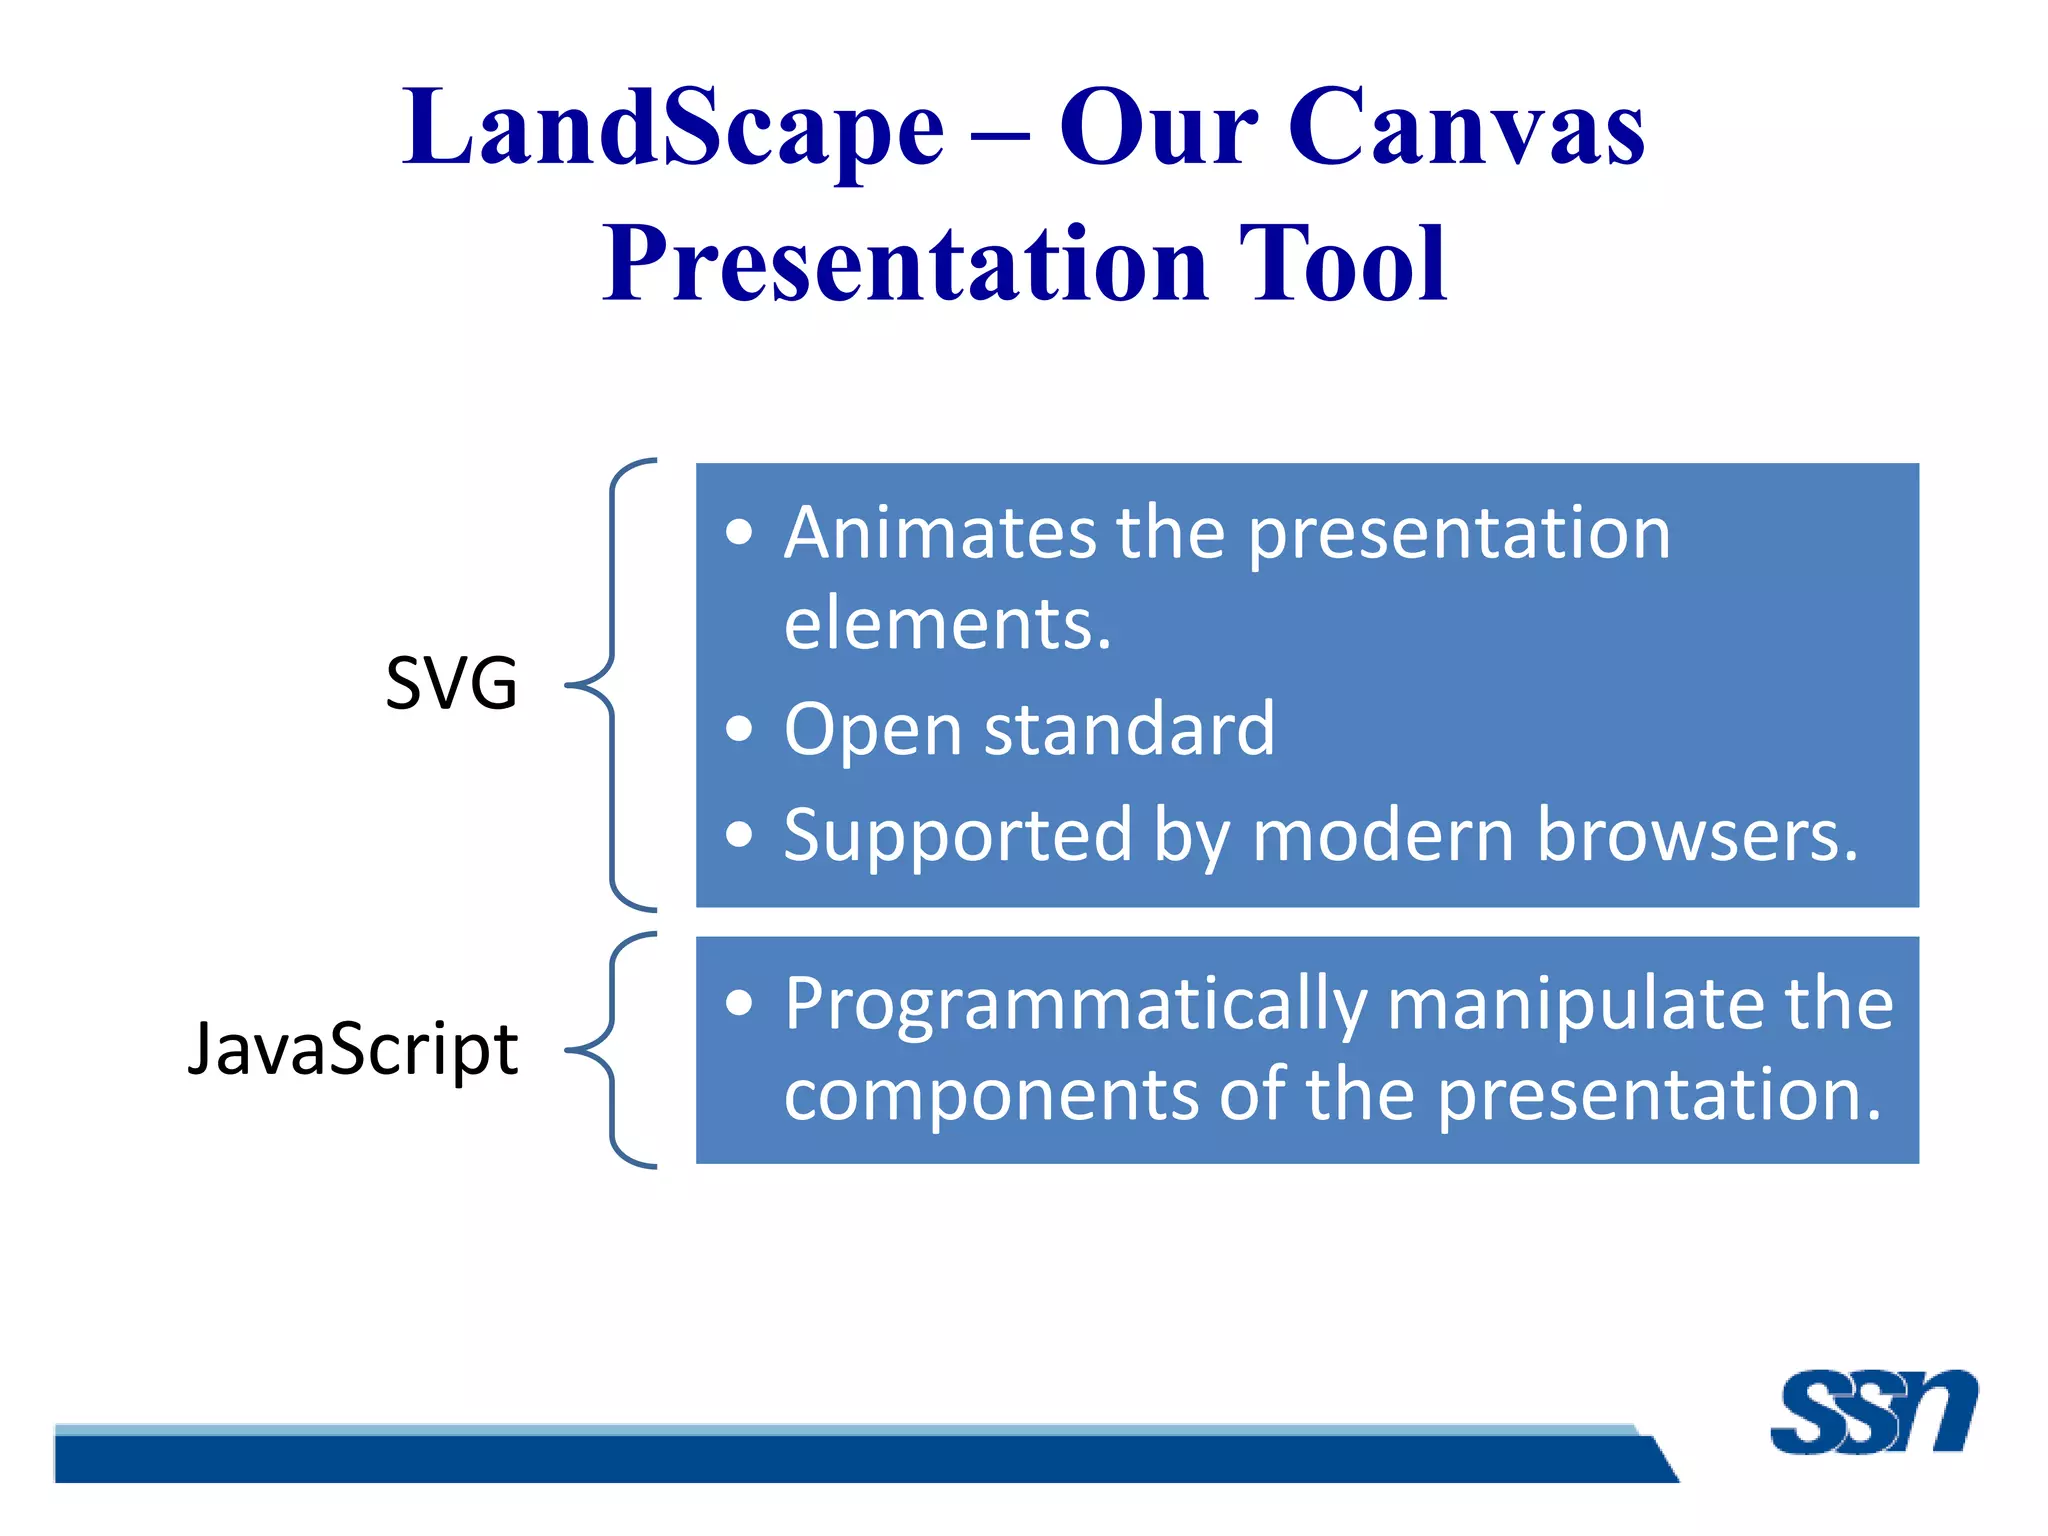
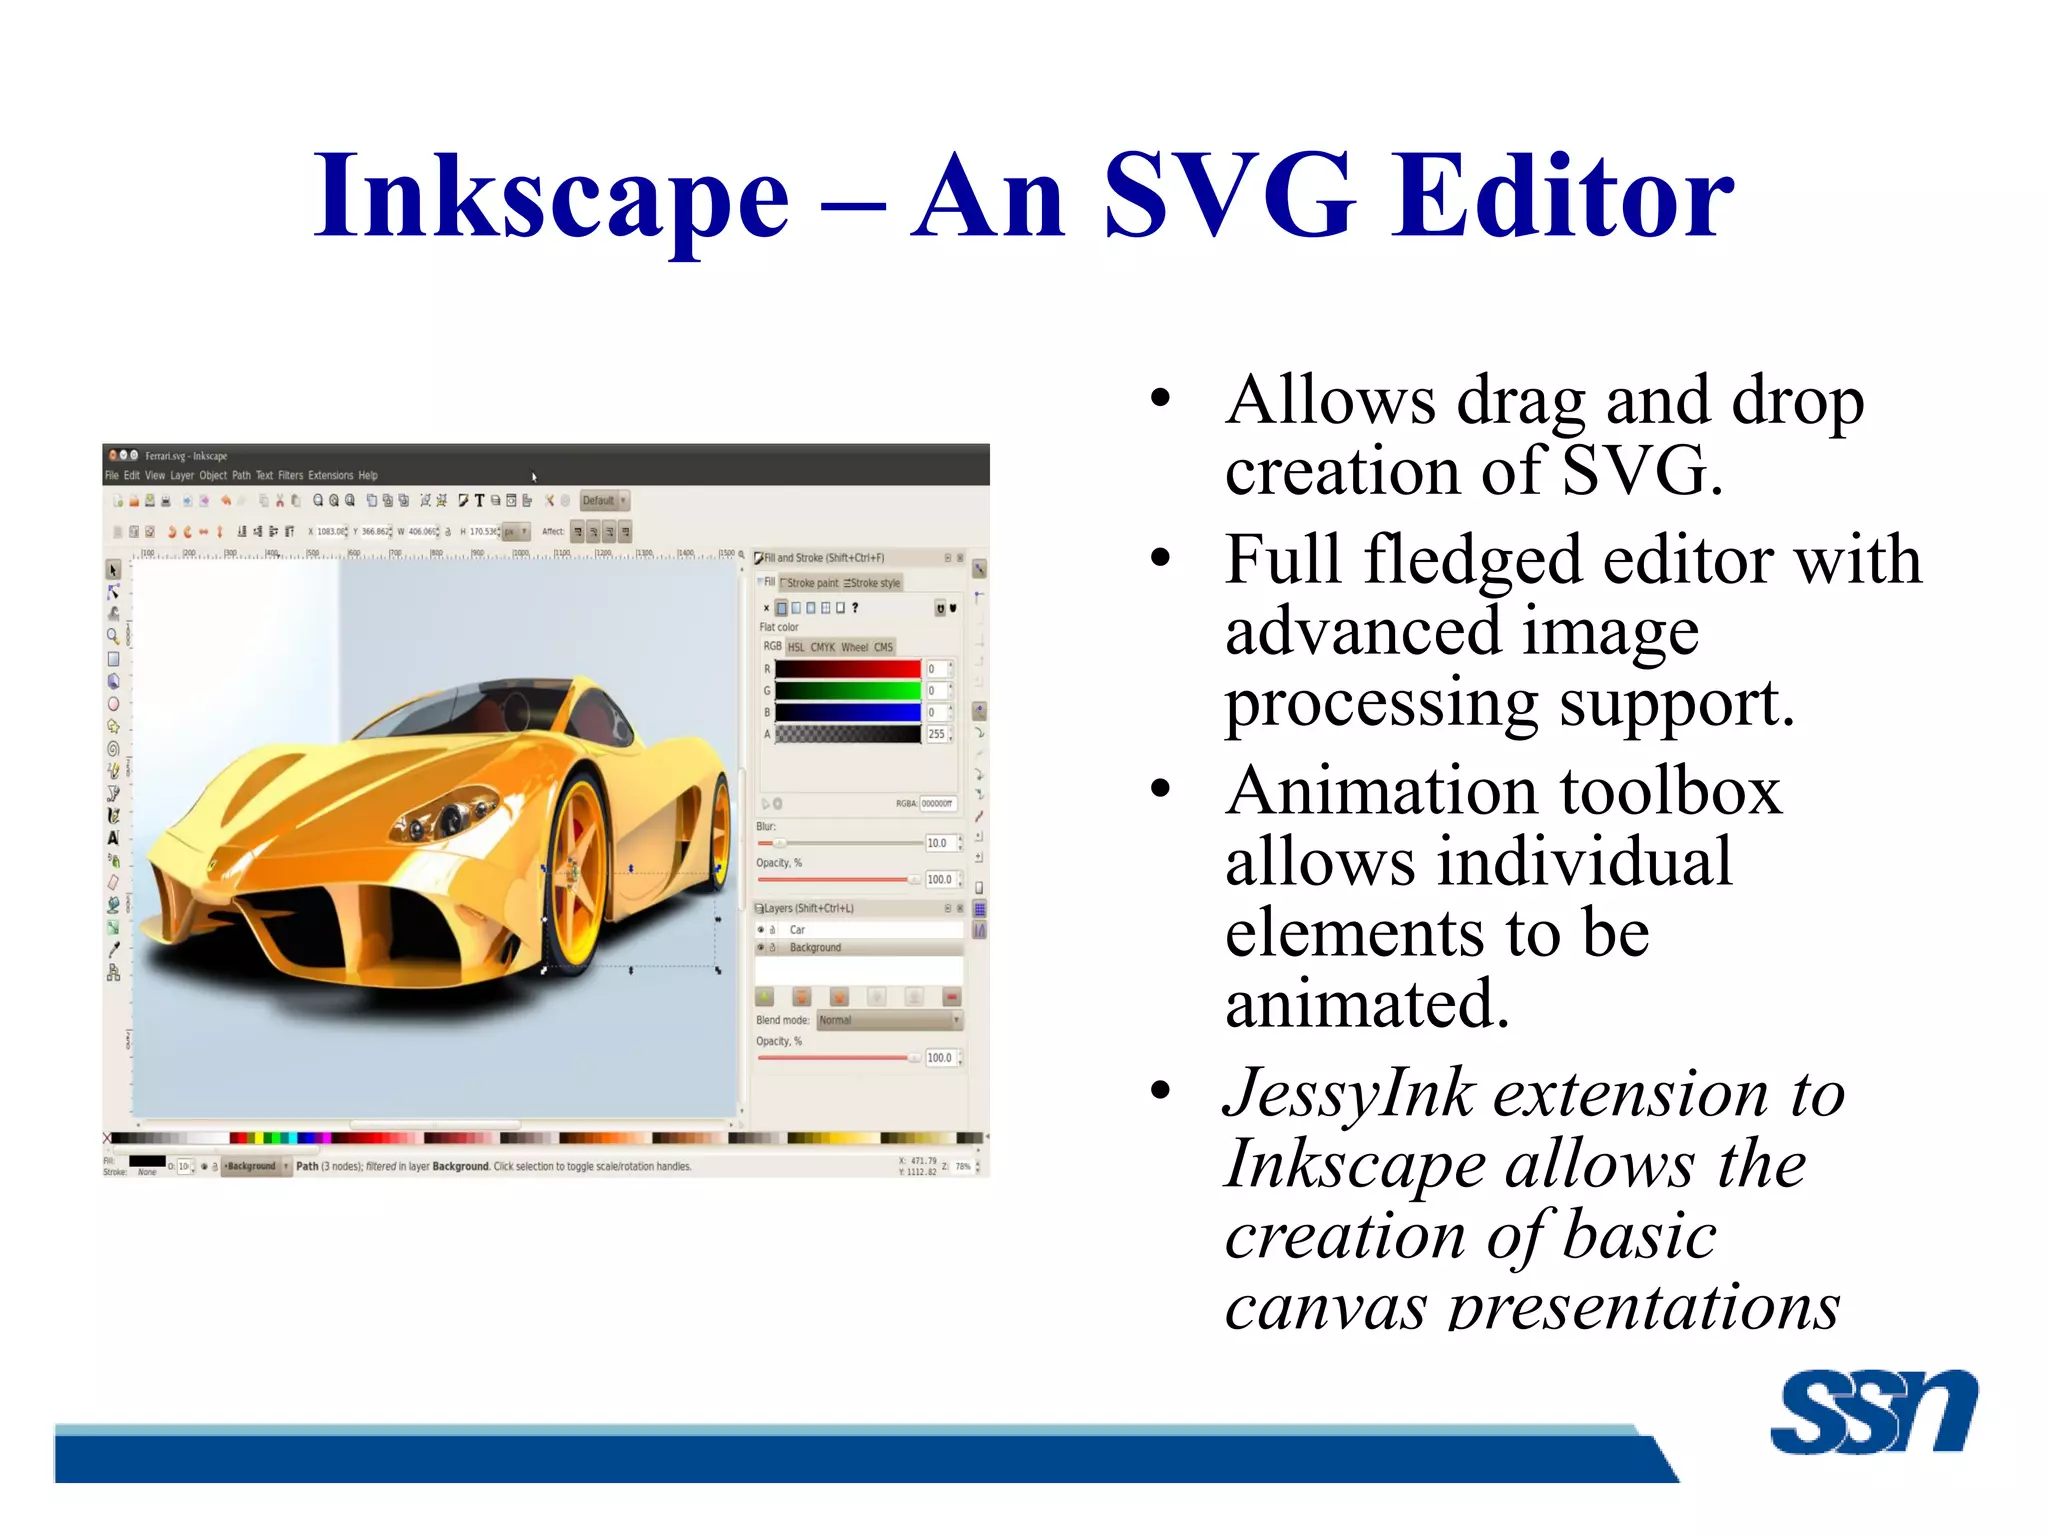
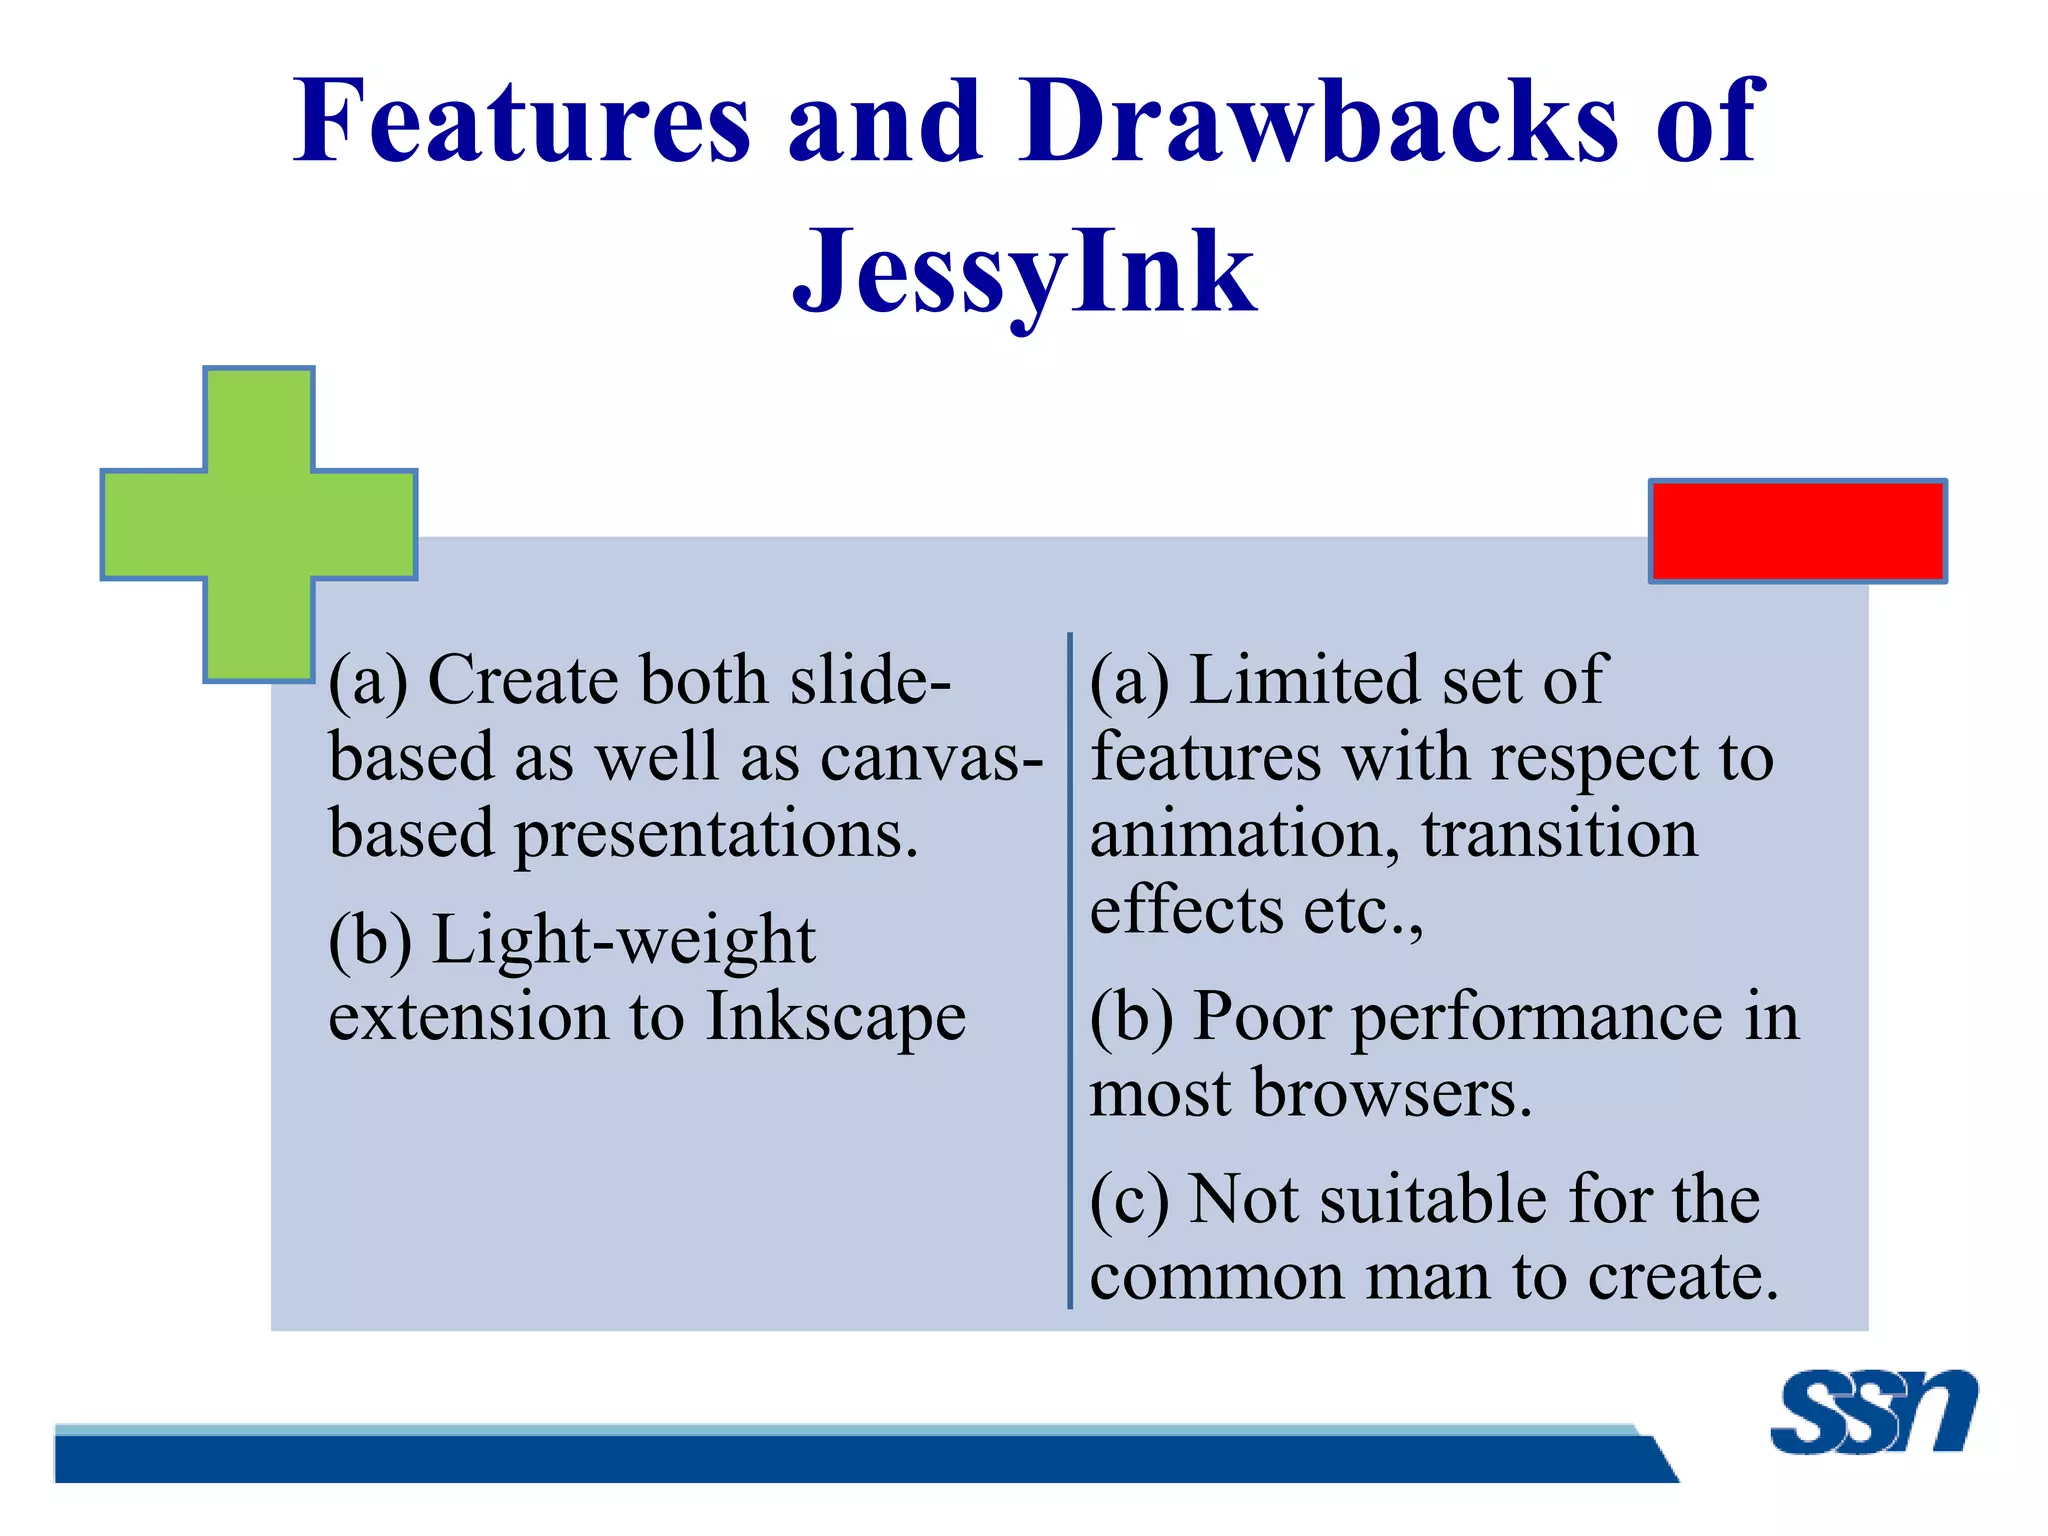
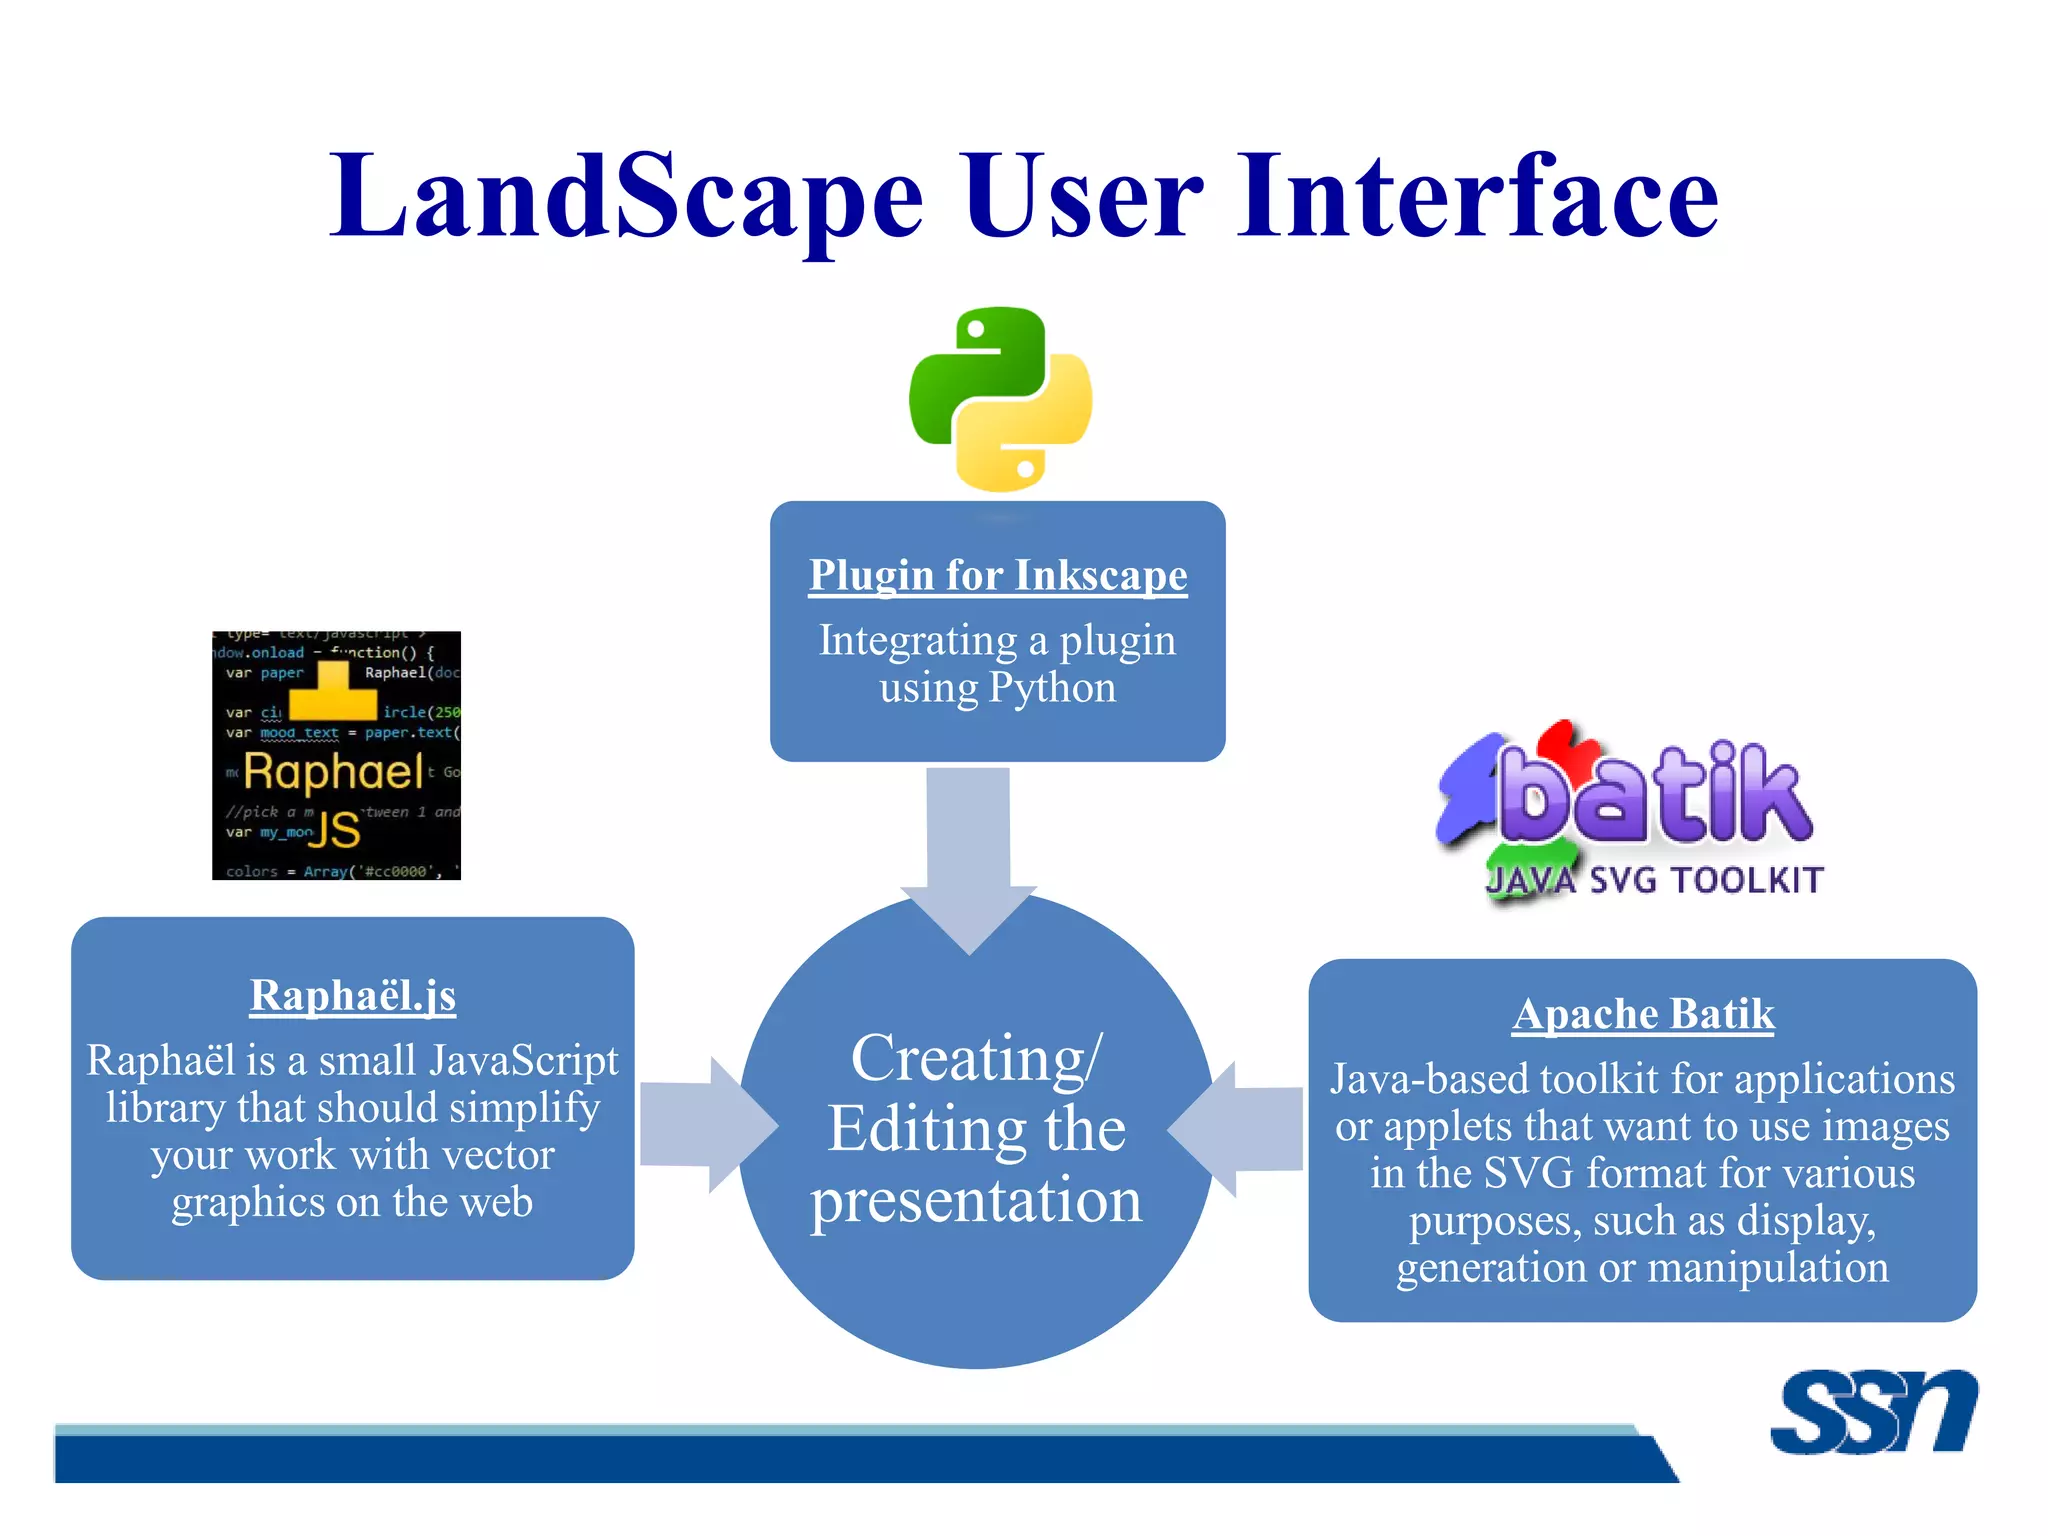
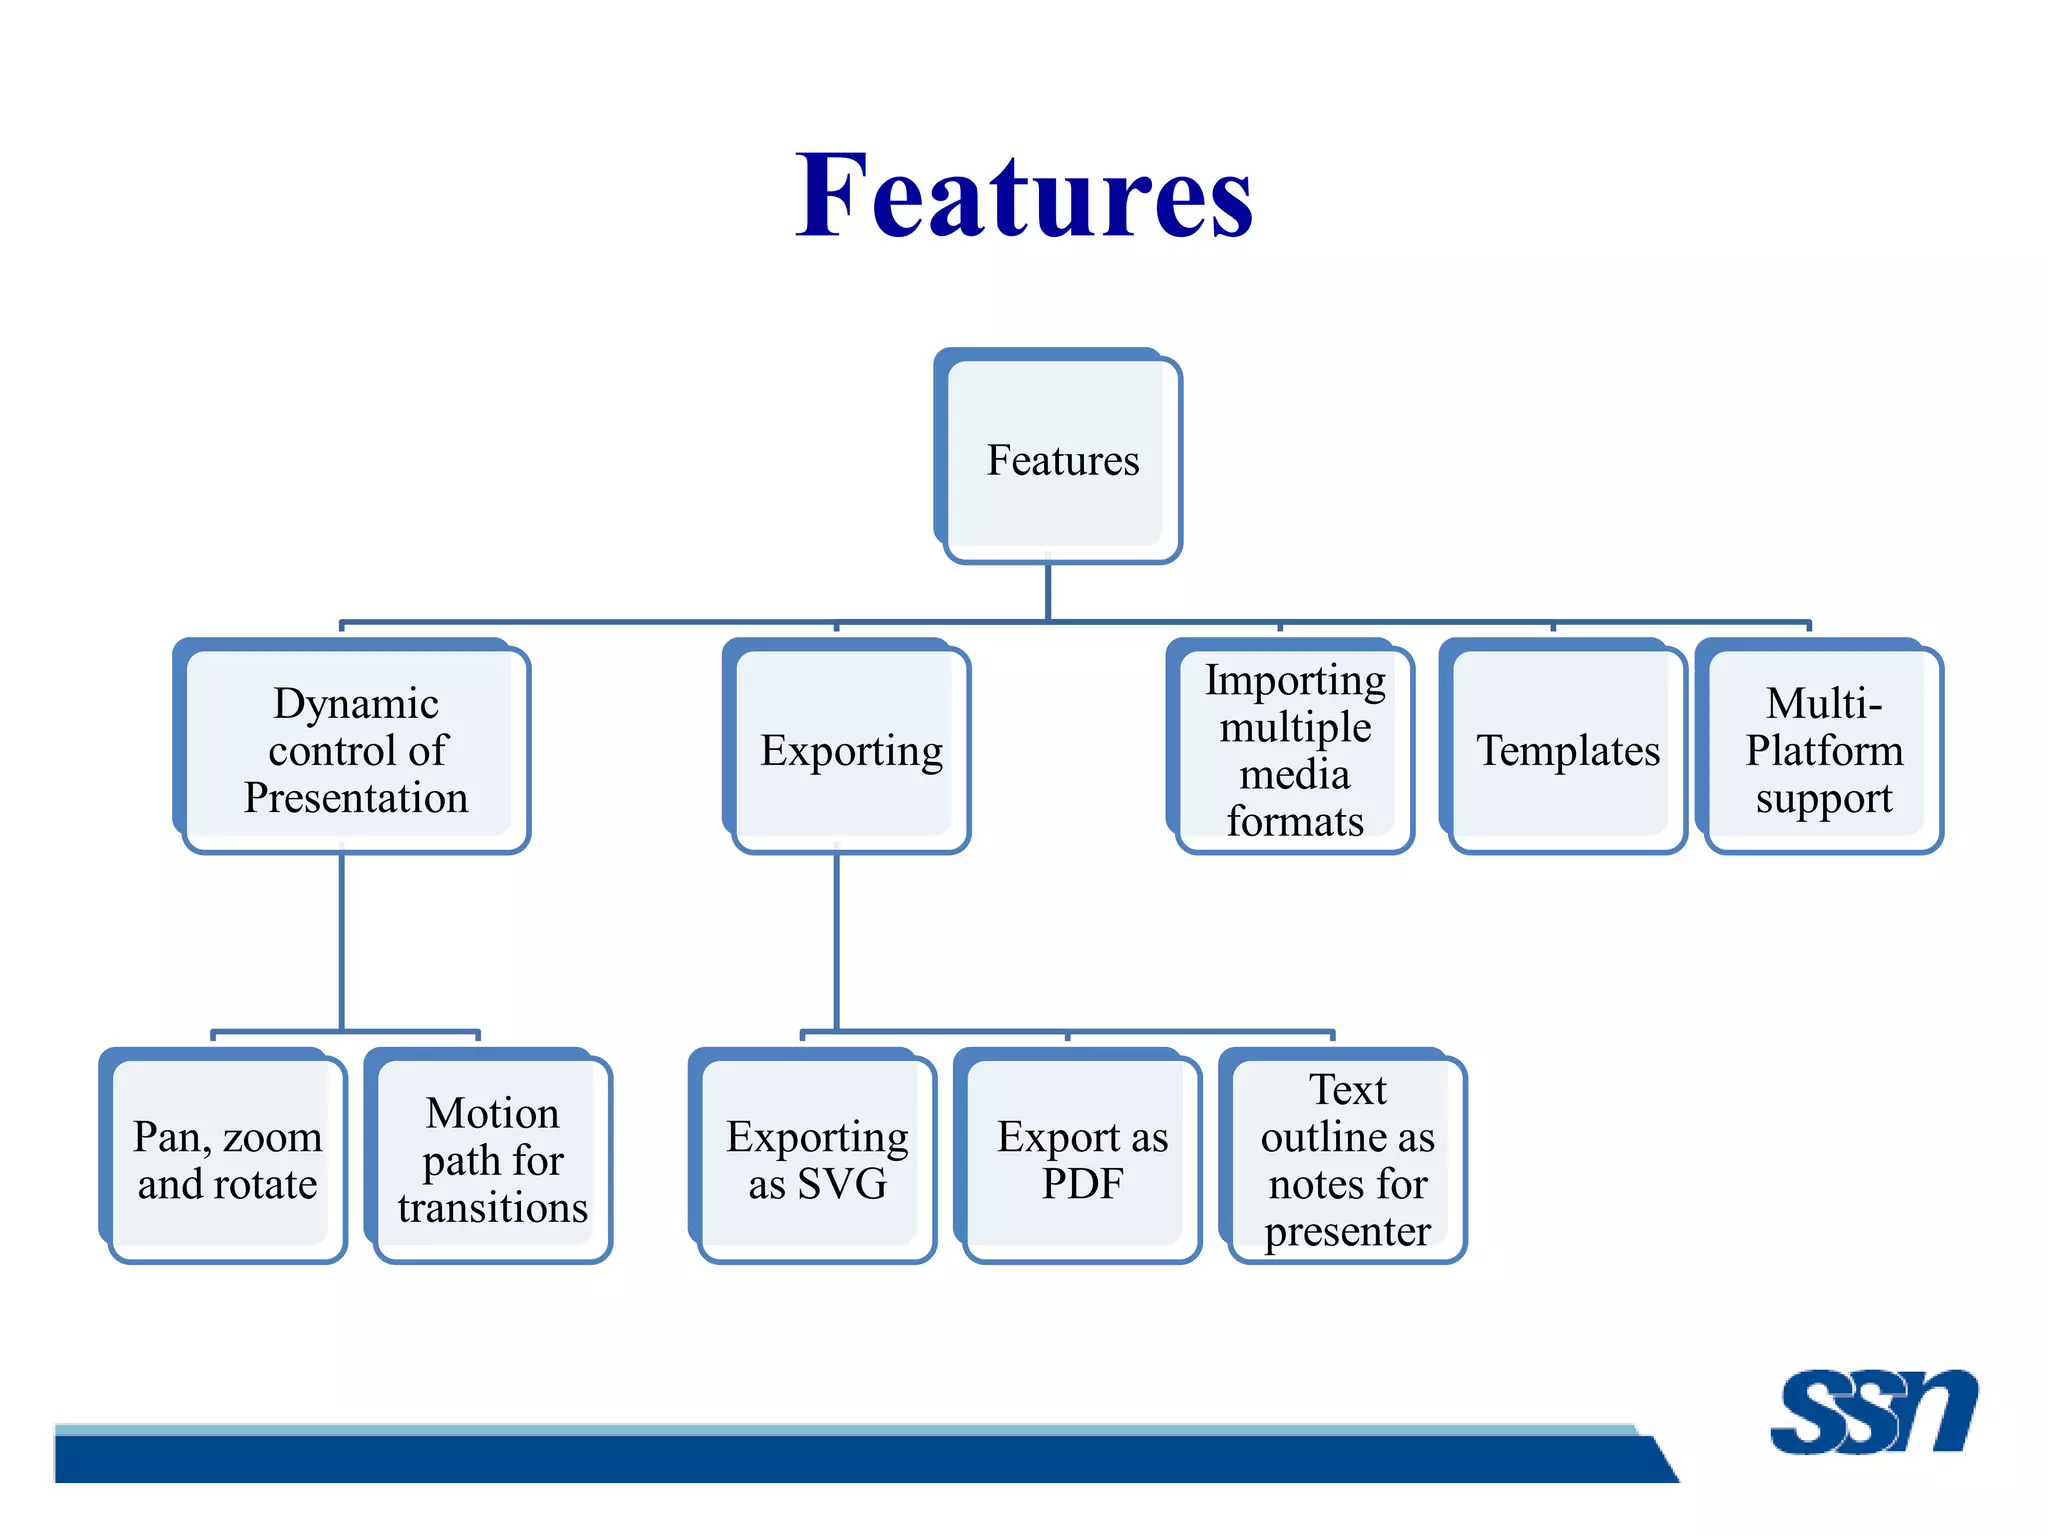
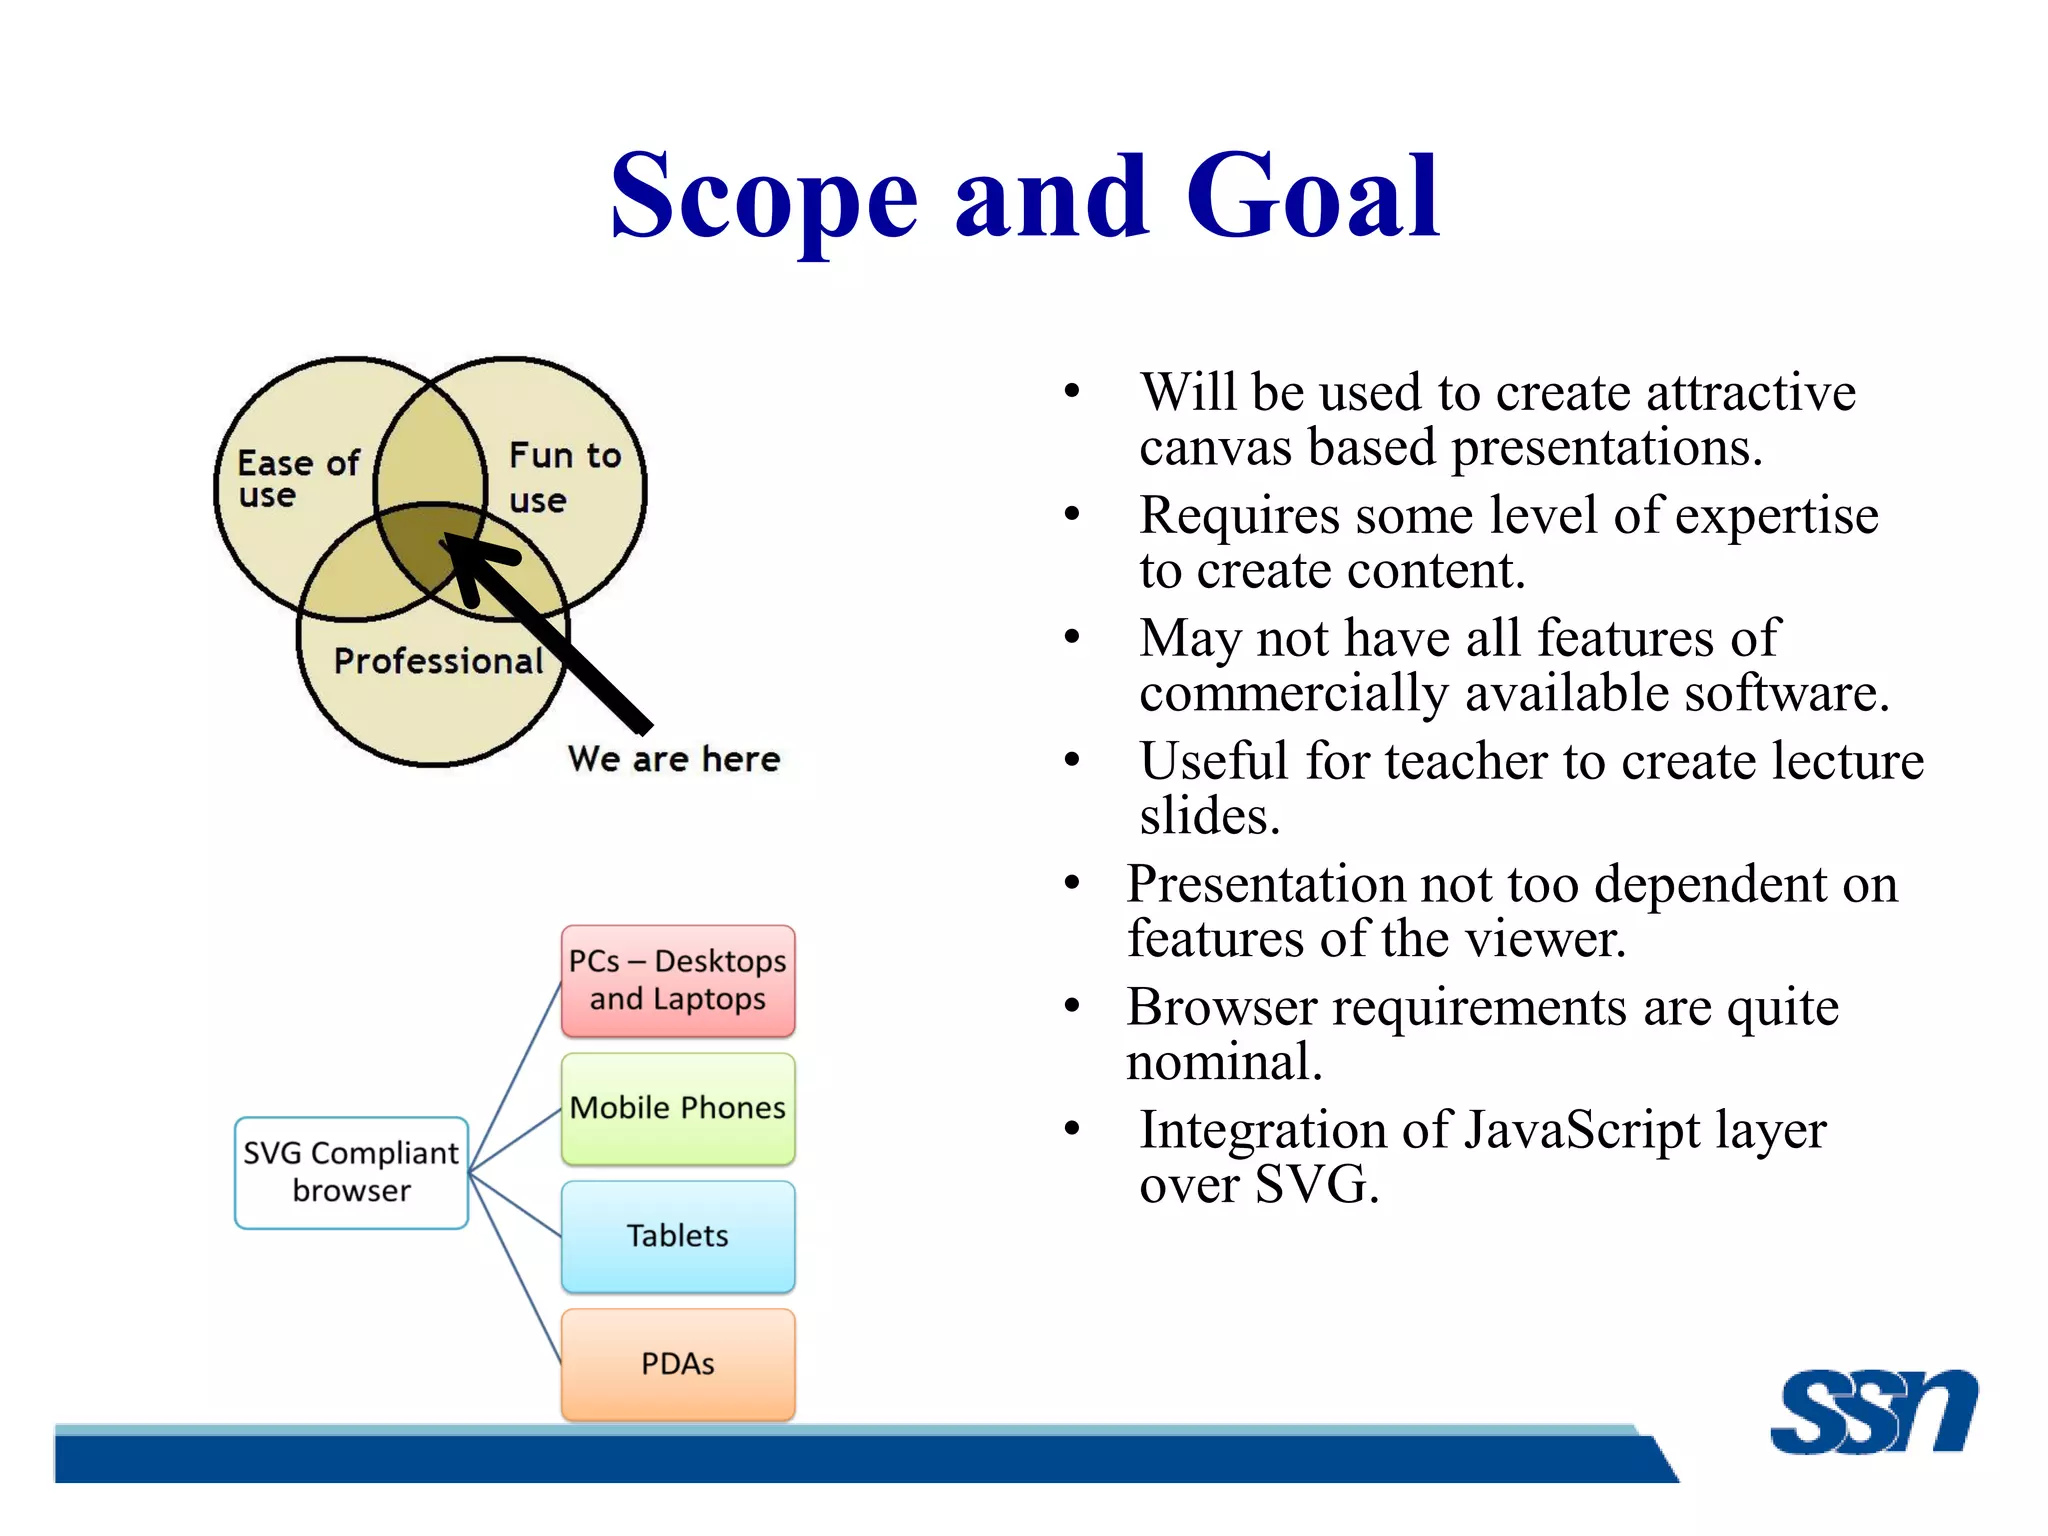
This document describes a canvas-based presentation tool called LandScape that is being developed using Scalable Vector Graphics (SVG) and JavaScript. It discusses the advantages of a canvas-based paradigm over traditional slide-based presentations. LandScape will allow creating and dynamically controlling presentations on an SVG canvas using tools like Inkscape, Raphael.js and Batik. The goal is to create an open, multi-platform tool that is more flexible than slideware but with a lighter feature set than commercial products.


![Vibe Coding vs. Spec-Driven Development [Free Meetup]](https://cdn.slidesharecdn.com/ss_thumbnails/vibecodingvsspecdrivendevelopment-251209105622-43f455e7-thumbnail.jpg?width=640&height=640&fit=bounds)


