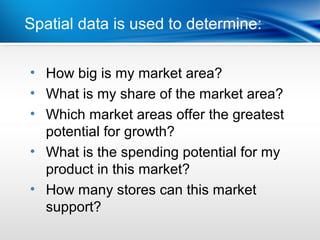
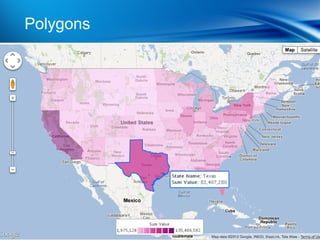
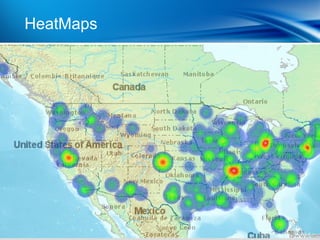
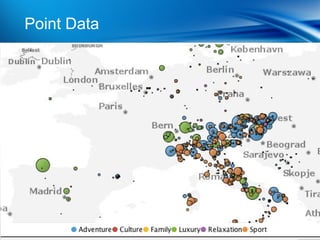
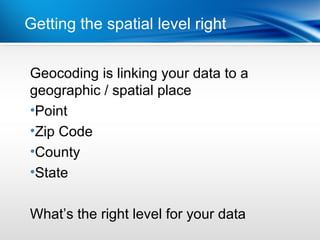
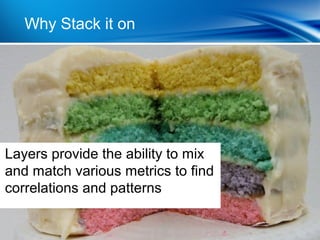
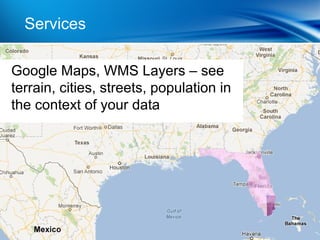
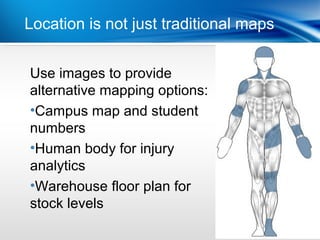
Location Intelligence Best Practices
Location Intelligence
Where it’s at…
Your presenters Year
          | Last

Yellowfin CEO, Glen Rabie


Yellowfin Strategic Alliances Manager,
Daniel Shaw-Dennis
What is LocationYear
          | Last Intelligence?
| Functional Delivery
Technical Jargon


11%
Only 11% of IT managers are familiar with
the term “Location intelligence”
Tech Target Survey 2012
It all starts |with data Delivery
                Functional


80%
Of all data has a location element
What does| this include?
            Last Year

Being able to map your data is important


           •
•90% of marketing managers from across the transport, finance, retail and public
                Customers Address
sectors plan on implementing enterprise mapping and geospatial technology in 2012
(Vanson Bourne)
           •    Store Address
•Organizations like yours listed “geographic-intelligence functions” as the standout
new analytics product requirement for 2012 (Gartner’s 2012 BI Magic Quadrant
survey)    •    Supplier Location
           •    Events
           •    Government Regions
           •    Sales Territories
Spatial dataLast Year determine:
           | is used to


• How big is my market area?
• What is my share of the market area?
• Which market areas offer the greatest
  potential for growth?
• What is the spending potential for my
  product in this market?
• How many stores can this market
  support?
Benefits of| Mapping in BI
             Last Year


• Used where traditional tables/grids,
  graphs and other analysis tools fall
  short
• Shows where data is NOT located in
  addition to where it is located
• Set you maps in motion to see
  changes over time
Case Studies
How its used
| Last Year
Cholera Map of 1854
More recentLast Year
         | examples
Visualization Styles
How to put your data on the map
Rasta MapsMobile device v PC
         |
Polygons | Smart Phone Conversion
HeatMaps | Internet Access Growth


• Heat maps should only be used for high
  density data
Point Data| Tablets & PCs
Time Animations & PCs
         | Tablets
Best Practice
Makes perfect..
Best Practice #1


    Geocode your data
       (mapify it!)
| What do they do?
Getting the spatial level right


Geocoding is linking your data to a
geographic / spatial place
•Point
•Zip Code
•County
•State

What’s the right level for your data
Where can|IWhat do they do?
             get it


• Map Providers
• Govt. Web Sites
• Manually… from Google
Best Practice #2


 Use multiple layers for
     better insight
Why Stack| it on
               Mobile BI for consumers


Layers provide the ability to mix
and match various metrics to find
correlations and patterns
Best Practice #3


   Background maps
 provide context to your
  spatial data points or
        polygons
Services | Mobile BI for consumers

Google Maps, WMS Layers – see
terrain, cities, streets, population in
the context of your data
Best Practice #4


 Think beyond traditional
  maps and geography
Location is| not just BI for consumers
             Mobile traditional maps


Use images to provide
alternative mapping options:
•Campus map and student
numbers
•Human body for injury
analytics
•Warehouse floor plan for
stock levels
Best Practice #5


 Combine mapping with
other visualizations for a
 deeper understanding
Greater level of analysis consumers
          | Mobile BI for


Combine Location analysis with
traditional data analysis & visualization:
•Filtering
•Analytic Dashboards
Best Practice #6


  Let your location data
      drive you to the
  information you need.
Drill down to the depths consumers
           | Mobile BI for


        Slice and Dice, Drill through and
        Drill down to see the why behind
        the where
Best Practice #7


  Look for opportunities
  where no data exists
Where thing’s aren’t for consumers
          | Mobile BI


Seeing what’s not there is the big
opportunity:
•Where could I put new stores
•Should I change my marketing target
areas and channels
•What is my target demographic
Conclusion
Questions
More InformationYear
           | Last

Yellowfin
www.yellowfinbi.com

Feedback & Questions
pr@yellowfin.bi                        @YellowfinBI


                       Yellowfin LinkedIn User Group

Yellowfin Location Intelligence Best Practices Webinar

  • 1.
  • 2.
  • 3.
    Your presenters Year | Last Yellowfin CEO, Glen Rabie Yellowfin Strategic Alliances Manager, Daniel Shaw-Dennis
  • 4.
    What is LocationYear | Last Intelligence?
  • 5.
    | Functional Delivery TechnicalJargon 11% Only 11% of IT managers are familiar with the term “Location intelligence” Tech Target Survey 2012
  • 6.
    It all starts|with data Delivery Functional 80% Of all data has a location element
  • 7.
    What does| thisinclude? Last Year Being able to map your data is important • •90% of marketing managers from across the transport, finance, retail and public Customers Address sectors plan on implementing enterprise mapping and geospatial technology in 2012 (Vanson Bourne) • Store Address •Organizations like yours listed “geographic-intelligence functions” as the standout new analytics product requirement for 2012 (Gartner’s 2012 BI Magic Quadrant survey) • Supplier Location • Events • Government Regions • Sales Territories
  • 8.
    Spatial dataLast Yeardetermine: | is used to • How big is my market area? • What is my share of the market area? • Which market areas offer the greatest potential for growth? • What is the spending potential for my product in this market? • How many stores can this market support?
  • 9.
    Benefits of| Mappingin BI Last Year • Used where traditional tables/grids, graphs and other analysis tools fall short • Shows where data is NOT located in addition to where it is located • Set you maps in motion to see changes over time
  • 10.
  • 11.
  • 12.
  • 13.
    Visualization Styles How toput your data on the map
  • 14.
  • 15.
    Polygons | SmartPhone Conversion
  • 16.
    HeatMaps | InternetAccess Growth • Heat maps should only be used for high density data
  • 17.
  • 18.
    Time Animations &PCs | Tablets
  • 19.
  • 20.
    Best Practice #1 Geocode your data (mapify it!)
  • 21.
    | What dothey do? Getting the spatial level right Geocoding is linking your data to a geographic / spatial place •Point •Zip Code •County •State What’s the right level for your data
  • 22.
    Where can|IWhat dothey do? get it • Map Providers • Govt. Web Sites • Manually… from Google
  • 23.
    Best Practice #2 Use multiple layers for better insight
  • 24.
    Why Stack| iton Mobile BI for consumers Layers provide the ability to mix and match various metrics to find correlations and patterns
  • 25.
    Best Practice #3 Background maps provide context to your spatial data points or polygons
  • 26.
    Services | MobileBI for consumers Google Maps, WMS Layers – see terrain, cities, streets, population in the context of your data
  • 27.
    Best Practice #4 Think beyond traditional maps and geography
  • 28.
    Location is| notjust BI for consumers Mobile traditional maps Use images to provide alternative mapping options: •Campus map and student numbers •Human body for injury analytics •Warehouse floor plan for stock levels
  • 29.
    Best Practice #5 Combine mapping with other visualizations for a deeper understanding
  • 30.
    Greater level ofanalysis consumers | Mobile BI for Combine Location analysis with traditional data analysis & visualization: •Filtering •Analytic Dashboards
  • 31.
    Best Practice #6 Let your location data drive you to the information you need.
  • 32.
    Drill down tothe depths consumers | Mobile BI for Slice and Dice, Drill through and Drill down to see the why behind the where
  • 33.
    Best Practice #7 Look for opportunities where no data exists
  • 34.
    Where thing’s aren’tfor consumers | Mobile BI Seeing what’s not there is the big opportunity: •Where could I put new stores •Should I change my marketing target areas and channels •What is my target demographic
  • 35.
  • 36.
    More InformationYear | Last Yellowfin www.yellowfinbi.com Feedback & Questions pr@yellowfin.bi @YellowfinBI Yellowfin LinkedIn User Group

Editor's Notes

  • #5 Location Intelligence is the capacity to organize and understand complex events through the use of geographic relationships inherent in all information. Yellowfin’s Location Intelligence combines traditional Business Intelligence with the addition of a spatial element to let you easily visualize your spatial and business data simultaneously.
  • #13 “ Yellowfin gives us the ability to use GIS data to determine where our sales and customers are coming from to detect new opportunities.” (Cosmetics Cubed IT Manager, Lloyd Shanks)
  • #22 DEMO Example Athlete Geo Point Agency Polygon Invoiced Amounts Change Colour Add GIS background
  • #25 Show Example 1 from dashboard. I can see sales Where are my athletes I can drill into the layers do see France has no-one.
  • #27 If I’m a skier where are my ski fields If I’m look after fishing supplies, where are the lakes and rivers.
  • #33 Drill Through in analysis tab Drill Through on Google Map.