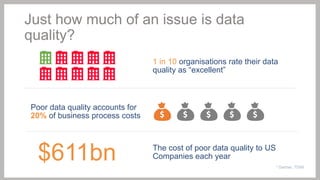
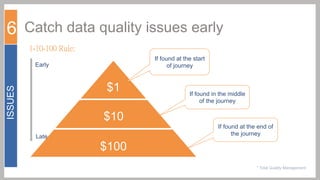
10 Data Sourcing Best
Practices 27 of February
Webinar – Thursday
th

2014
Welcome

Introducing the
speakers…

Adem Turgut
Lead Business
Analyst
SolveXia

Cameron Deed
Senior Consultant
Yellowfin

Agenda for this webinar:
Why is data quality
important?

Our 10 best
practices

Demonstration –
From data to
visualisation

Q&A
“Simplified our business…”
Nick Sutherland, Cofounder of CT Connections
Corporate Travel
Management

Online
Reporting
& Analytics
“Productivity gains that are
both dramatic but
continuous and
incremental”
Darren Robinson, Actuary
at Clearview Insurance

Process
Automation

Data
Warehousing
If you are looking for a user-friendly tool
with collaborative and mobile capabilities
that I refer to as the next generation of BI
software, take a look at Yellowfin 

David Menninger
VP & Research Director
Ventana Research
Data Quality Story
Overbooked by 10,000 tickets

Manual spreadsheet error

- telegraph.co.uk
Your data has reach…
Where data from a report is used:

Utilised by:

Within
department
31%

Inter-departmental
69%

CEO
42%

* Panko and Port, 2012
Just how much of an issue is data
quality?
1 in 10 organisations rate their data
quality as “excellent”

Poor data quality accounts for
20% of business process costs

$611bn

The cost of poor data quality to US
Companies each year
* Gartner, TDWI
And we want more…
x44 by 2020

2009 – enough data to fill a stack of
DVDs to the moon and back
2020 – Grow by 44x

Less than 1% of available data
is analysed

1%
93% of execs believe they are losing
revenue as a result of not fully
leveraging the information they collect
* IDC, Oracle and EMC
What is data quality?
HOW
TRUSTED
RELIABLE
AND
IS YOUR
CREDIBLE
DATA?

Complete
Accurate
Available

Consiste
nt
Why is data quality important?
“It can increase customer
satisfaction”

“It improves the success rate of enterprise
initiatives like Business Intelligence…”
“It supports accountability”

“It ensures the best use of our resources”
“It reduces the cost of rework”

“It increases our efficiency”
“It ensures we have the best possible
understanding of our customers and employees”

“It gives us accurate and timely
information to manage our business”
Building high quality “supply chains” of
data

GET THE
RIGHT DATA

MEASURE
FOR QUALITY

BE AGILE
1 Focus on the outcome

ISSUES

Analysis Paralysis
Letting data dictate what is
“important”
Limited time and energy
to focus
RECOMMENDATIONS

1 Focus on the outcome
…then the
data.
Start with the
outcome…

Focus on
what matters
2 Profile your data

ISSUES

Data supplier doesn’t know
your data needs
The data you source is as
good as ….
RECOMMENDATIONS

2 Profile your data
Write your data profile
Structure, Format, Frequency, Age, Delivery Method

Communicate it to data providers

Identify issues and gaps
3 Get as close to the source as possible

ISSUES

When your source data is somebody else’s
spreadsheet….
Availability of data

Human Error
Risk

Unexpected
Changes
Additional effort and complexity
RECOMMENDATIONS

3 Get as close to the source as possible

PLAN

CAUTION

Be cautious of
manual
spreadsheets

Skip the
spreadsheet as a
source

Communicate and
measure for quality
EXAMPLE

3 Get as close to the source as possible
Insurance Intermediary

Insurance Broker

Monthly CFO Report

Data sourced from manual
spreadsheet
Time consuming and risky

Monthly CFO Report
4 Streamline data sources

ISSUES

Using multiple sources
Redundant data
Increased complexity and quality risk
4 Streamline data sources
EXAMPLE

Identify redundant data
Focus on the essentials
Cut out the stuff you don’t need
ISSUES

5 Set data quality expectations
Perfectionism  Burnout

Focusing on things that few care about..
RECOMMENDATIONS

5 Set data quality expectations
Focus on high impact data

RELAX

(a little)

Tolerances and ranges for quality and accuracy
6 Catch data quality issues early
1-10-100 Rule:
If found at the start
of journey

Early

ISSUES

$1

If found in the middle
of the journey

$10
Late

If found at the end of
the journey

$100
* Total Quality Management
RECOMMENDATIONS

6 Catch data quality issues early
Implement quality measures near the start
of the data supply chain
Use the “start” as a reference point when
checking data further down the journey
EXAMPLE

6 Catch data quality issues early

Australian Life Insurer

New Business Reporting
ISSUES

7 Actively measure quality
Invalid Assumption:
If the data meets our expectations today, it
will going forward
No simple way to identify if data is correct
What happens when we do find an issue?
RECOMMENDATIONS

7 Actively measure quality
NOT GOOD

OK
GOOD

Define metrics for your data quality

Measure for quality on a consistent basis

Address consistent issues with strategic
solutions (e.g. data cleansing)
EXAMPLE

7 Actively measure quality

Margin Lending Group

Client Credit Reports
8 Expect Change. Embrace It.

ISSUES

We all know change is coming
Business activity, changes in
strategies and systems.
So rigid that you need to
“reset”
Score and rank potential changes

H

Likelihood

RECOMMENDATIONS

8 Expect Change. Embrace It.

Focus on high likelihood/impact
changes
L
L

H

Impact

Have a plan in place for high risk
items
9 Plan for change

ISSUES

A change occurs, then what?
Lack of clear policies and rules on who
needs to do what…
Knowledge resting in the minds of key
individuals
RECOMMENDATIONS

9 Plan for change
CAUTION
In the event
of a change
the following
people will…

Policies and rules

Documentation

Tracking
Changes
EXAMPLE

9 Plan for change
Big 4 Bank

Actuarial Valuation
1
Controlled human interaction
0

ISSUES

Value of human interaction with data…
… at the cost of data quality
Uncontrolled manipulation of data
RECOMMENDATIONS

1
Controlled human interaction
0
Avoid uncontrolled manipulation
Facilitate controlled and discrete changes
Make sure it is traceable
Demonstration
Visualisation

Process
Automation

Storage (Managed
Tables)
Q&A
THANK YOU

solvexia.com
carolyn.eames@solvexia.com
@solvexia
SolveXia Pty Ltd

www

yellowfinbi.com
pr@yellowfin.bi
@yellowfinbi
Yellowfin LinkedIn User Group

Data Sourcing Best Practices for Reporting (Webinar slides)

  • 1.
    10 Data SourcingBest Practices 27 of February Webinar – Thursday th 2014
  • 2.
    Welcome Introducing the speakers… Adem Turgut LeadBusiness Analyst SolveXia Cameron Deed Senior Consultant Yellowfin Agenda for this webinar: Why is data quality important? Our 10 best practices Demonstration – From data to visualisation Q&A
  • 3.
    “Simplified our business…” NickSutherland, Cofounder of CT Connections Corporate Travel Management Online Reporting & Analytics “Productivity gains that are both dramatic but continuous and incremental” Darren Robinson, Actuary at Clearview Insurance Process Automation Data Warehousing
  • 4.
    If you arelooking for a user-friendly tool with collaborative and mobile capabilities that I refer to as the next generation of BI software, take a look at Yellowfin David Menninger VP & Research Director Ventana Research
  • 5.
    Data Quality Story Overbookedby 10,000 tickets Manual spreadsheet error - telegraph.co.uk
  • 6.
    Your data hasreach… Where data from a report is used: Utilised by: Within department 31% Inter-departmental 69% CEO 42% * Panko and Port, 2012
  • 7.
    Just how muchof an issue is data quality? 1 in 10 organisations rate their data quality as “excellent” Poor data quality accounts for 20% of business process costs $611bn The cost of poor data quality to US Companies each year * Gartner, TDWI
  • 8.
    And we wantmore… x44 by 2020 2009 – enough data to fill a stack of DVDs to the moon and back 2020 – Grow by 44x Less than 1% of available data is analysed 1% 93% of execs believe they are losing revenue as a result of not fully leveraging the information they collect * IDC, Oracle and EMC
  • 9.
    What is dataquality? HOW TRUSTED RELIABLE AND IS YOUR CREDIBLE DATA? Complete Accurate Available Consiste nt
  • 10.
    Why is dataquality important? “It can increase customer satisfaction” “It improves the success rate of enterprise initiatives like Business Intelligence…” “It supports accountability” “It ensures the best use of our resources” “It reduces the cost of rework” “It increases our efficiency” “It ensures we have the best possible understanding of our customers and employees” “It gives us accurate and timely information to manage our business”
  • 11.
    Building high quality“supply chains” of data GET THE RIGHT DATA MEASURE FOR QUALITY BE AGILE
  • 12.
    1 Focus onthe outcome ISSUES Analysis Paralysis Letting data dictate what is “important” Limited time and energy to focus
  • 13.
    RECOMMENDATIONS 1 Focus onthe outcome …then the data. Start with the outcome… Focus on what matters
  • 14.
    2 Profile yourdata ISSUES Data supplier doesn’t know your data needs The data you source is as good as ….
  • 15.
    RECOMMENDATIONS 2 Profile yourdata Write your data profile Structure, Format, Frequency, Age, Delivery Method Communicate it to data providers Identify issues and gaps
  • 16.
    3 Get asclose to the source as possible ISSUES When your source data is somebody else’s spreadsheet…. Availability of data Human Error Risk Unexpected Changes Additional effort and complexity
  • 17.
    RECOMMENDATIONS 3 Get asclose to the source as possible PLAN CAUTION Be cautious of manual spreadsheets Skip the spreadsheet as a source Communicate and measure for quality
  • 18.
    EXAMPLE 3 Get asclose to the source as possible Insurance Intermediary Insurance Broker Monthly CFO Report Data sourced from manual spreadsheet Time consuming and risky Monthly CFO Report
  • 19.
    4 Streamline datasources ISSUES Using multiple sources Redundant data Increased complexity and quality risk
  • 20.
    4 Streamline datasources EXAMPLE Identify redundant data Focus on the essentials Cut out the stuff you don’t need
  • 21.
    ISSUES 5 Set dataquality expectations Perfectionism  Burnout Focusing on things that few care about..
  • 22.
    RECOMMENDATIONS 5 Set dataquality expectations Focus on high impact data RELAX (a little) Tolerances and ranges for quality and accuracy
  • 23.
    6 Catch dataquality issues early 1-10-100 Rule: If found at the start of journey Early ISSUES $1 If found in the middle of the journey $10 Late If found at the end of the journey $100 * Total Quality Management
  • 24.
    RECOMMENDATIONS 6 Catch dataquality issues early Implement quality measures near the start of the data supply chain Use the “start” as a reference point when checking data further down the journey
  • 25.
    EXAMPLE 6 Catch dataquality issues early Australian Life Insurer New Business Reporting
  • 26.
    ISSUES 7 Actively measurequality Invalid Assumption: If the data meets our expectations today, it will going forward No simple way to identify if data is correct What happens when we do find an issue?
  • 27.
    RECOMMENDATIONS 7 Actively measurequality NOT GOOD OK GOOD Define metrics for your data quality Measure for quality on a consistent basis Address consistent issues with strategic solutions (e.g. data cleansing)
  • 28.
    EXAMPLE 7 Actively measurequality Margin Lending Group Client Credit Reports
  • 29.
    8 Expect Change.Embrace It. ISSUES We all know change is coming Business activity, changes in strategies and systems. So rigid that you need to “reset”
  • 30.
    Score and rankpotential changes H Likelihood RECOMMENDATIONS 8 Expect Change. Embrace It. Focus on high likelihood/impact changes L L H Impact Have a plan in place for high risk items
  • 31.
    9 Plan forchange ISSUES A change occurs, then what? Lack of clear policies and rules on who needs to do what… Knowledge resting in the minds of key individuals
  • 32.
    RECOMMENDATIONS 9 Plan forchange CAUTION In the event of a change the following people will… Policies and rules Documentation Tracking Changes
  • 33.
    EXAMPLE 9 Plan forchange Big 4 Bank Actuarial Valuation
  • 34.
    1 Controlled human interaction 0 ISSUES Valueof human interaction with data… … at the cost of data quality Uncontrolled manipulation of data
  • 35.
    RECOMMENDATIONS 1 Controlled human interaction 0 Avoiduncontrolled manipulation Facilitate controlled and discrete changes Make sure it is traceable
  • 36.
  • 37.
  • 38.
  • 39.
    THANK YOU solvexia.com carolyn.eames@solvexia.com @solvexia SolveXia PtyLtd www yellowfinbi.com pr@yellowfin.bi @yellowfinbi Yellowfin LinkedIn User Group