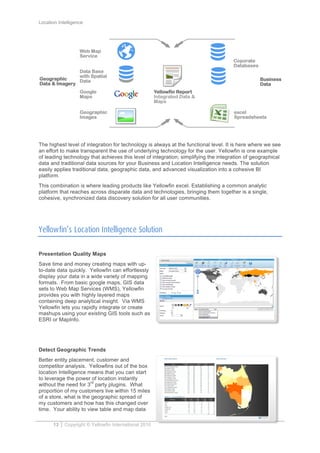
Making Business
Intelligence Easy
White Paper
Location Intelligence
2 Copyright © Yellowfin International 2010
Contents
Overview.................................................................................................................................................3	
  
Location Intelligence what is it?..............................................................................................................4	
  
A brief history......................................................................................................................................4
Who is it for?...........................................................................................................................................5	
  
Restaurant/Retail ................................................................................................................................5
Communications .................................................................................................................................5
Banking...............................................................................................................................................6
Healthcare...........................................................................................................................................6
Agriculture...........................................................................................................................................6
Crime Analysis....................................................................................................................................6
What are the external factors driving location Intelligence? ...................................................................7	
  
What are the internal drivers for Location intelligence?..........................................................................7	
  
Benefits of Locations Intelligence ...........................................................................................................8	
  
Spatial data and layering underpins Location Intelligence? .................................................................10	
  
Geocoding – creating geographic data types. ..................................................................................10
The Join Problem - Why layers are cool...........................................................................................11
Styles of Spatial Data Access...............................................................................................................12	
  
Web Map Services............................................................................................................................12
GIS data stored in a data base .........................................................................................................12
Geographic images...........................................................................................................................12
Google / Bing Maps ..........................................................................................................................12
Yellowfin’s Location Intelligence Solution.............................................................................................13	
  
Summary ..............................................................................................................................................14	
  
Yellowfin, and the Yellowfin logo are trademarks or registered trademarks of Yellowfin International Pty Ltd. All other names are
trademarks or registered trademarks of their respective companies.
While every attempt has been made to ensure that the information in this document is accurate and complete, some
typographical errors or technical inaccuracies may exist. Yellowfin does not accept responsibility for any kind of loss resulting
from the use of information contained in this document.
The information contained in this document is subject to change without notice. This text contains proprietary information, which
is protected by copyright. All rights are reserved. No part of this document may be photocopied, reproduced, stored in a
retrieval system, transmitted in any form or by any means, or translated into another language without the prior written consent
of Yellowfin International Pty Ltd.
The incorporation of the product attributes discussed in these materials into any release or upgrade of any Yellowfin software
product – as well as the timing of any such release or upgrade – is at the sole discretion of Yellowfin.
This document version published January 2010 Copyright © 2010Yellowfin International Pty Ltd.
Location Intelligence
3 Copyright © Yellowfin International 2010
Overview
Today’s knowledge workers deal with vast amounts of data in a variety of formats, from spreadsheets
and databases, to online content such as statistical data. The recent trend towards mash up solutions
in which information and content from multiple sources is combined to create versatile online
applications is indicative of the way that business users use highly integrated solutions to make sense
of the vast amount of information that is available to them.
At the same time, advances in technology have led to the proliferation of geographical services,
including online mapping solutions such as Google Maps and Microsoft® Virtual Earth. This
technology was once the preserve of geographic information system (GIS) specialists but is now
widely available to everyone.
These two factors bring new expectations and opportunities for organizations. The ubiquity of
geographical services, and the increasing sophistication with which users can consume data means
that spatial information is just another component to be incorporated into a Business intelligence
solution and used as a basis for making better decisions and providing higher value services.
Spatial data can be used in many ways, such as:
• How big is my market area?
• What is my share of the market area?
• Which market areas offer the greatest potential for growth?
• What is the spending potential for my product in this market?
• How many stores can this market support?
These examples represent only a few of the possibilities created by the integration of spatial data into
software applications.
Yellowfin provides support for geographical data through the inclusion of location Intelligence
capability, which you can use to query and present location-based information. The spatial support in
Yellowfin can help users to make better decisions through analysis of location data in scenarios such
as:
• Customer-base management and development
• Environmental-related data impact, analysis, and planning
• Financial and economic analysis in communities
• Government-based planning and development analysis
• Market segmentation and analysis
• Scientific research study design and analysis
This whitepaper provides a high-level introduction to the comprehensive spatial data support in
Yellowifn, and describes its high-performance spatial capabilities and location-aware application
extensibility.
Location Intelligence
4 Copyright © Yellowfin International 2010
Location Intelligence what is it?
More than 70% of your organizational data has a location component - be it a customer address or a
sales territory. This combined with the growing ability of businesses to quickly absorb large volumes
of data, together with the increased availability of digital maps and spatially-enabled applications has
created an unprecedented opportunity to incorporate geographic factors into decision making
processes and analysis.
Location Intelligence is the capacity to organize and understand complex events through the use of
geographic relationships inherent in all information. This is achieved by combining location-related
data with other business data, organizations can gain critical insights, make better decisions and
optimize important processes and applications. Location Intelligence offers organizations
opportunities to streamline their business processes and customer relationships to improve
performance and results.
Yellowfin’s Location Intelligence combines traditional Business Intelligence with the addition of a
spatial element to let you easily visualize your spatial and business data simultaneously. As a BI
platform with its fully integrated GIS capability, Yellowfin is unique. It lets you query the “where” as
well as the “what” and “when”. This distinctive capability enables you to merge your spatial data with
your corporate information. Table data and maps are interlinked and displayed as a single report.
The merging of your spatial data into your business data will give you the analytic capability that you
need to excel in Location Intelligence.
A brief history
Location Intelligence is the provision of thematic maps that assist with the understanding of where
events such as sales or incidents occur.
One of the earliest examples of the use of
thematic mapping comes from London
physician John Snow. Though disease
had been mapped thematically, Snow’s
cholera map in 1854 is the best known
example of using thematic maps for
analysis. Essentially, his technique and
methodology anticipate principles of a
geographic information system (GIS).
Starting with an accurate base map of a
London neighborhood which included
streets and pump locations, Snow
mapped out the incidents of cholera
death. The emerging pattern centered
around one particular pump on Broad
Street. At Snow’s request, the handle of
the pump was removed, and new cholera
cases ceased almost at once. Further
investigation of the area revealed the
Broad Street pump was near a sewer line.
Subsequently maps used to help explain complex phenomenon have been used with increasing
regularity. By the early 20th century map theory had led to the development of maps which were
separated into layers, and computer hardware development spurred by nuclear weapon research
would lead to general-purpose computer "mapping" applications by the early 1960s.
By the early 1980s commercial vendors of GIS software such as ESRI made GIS applications
available to highly trained users within organizations. However, it was through the rapid growth of
Location Intelligence
5 Copyright © Yellowfin International 2010
internet based GIS applications, such as Google Maps launches in 2005, that truly exposed the power
of location based decision making to a much broader business audience.
Who is it for?
Location affects virtually every business and government entity across almost every functional area.
Customers and constituents, stores and service offices, territories and voting districts, threats and
opportunities, can all be viewed and analyzed spatially. Common BI tools do a good job at analyzing
the basic who, what, when, and how questions that characterize things such as customers. But unlike
the dimensions of who, what, and when (customer, product, time), the where gets little attention. For
this Location Intelligence capability is needed.
The where, its geographic location, of any business transaction is almost always captured. In fact,
multiple locations are often captured. Ship-to, bill-to and customer contacts are all often captured at
companies everywhere. By using this data effectively Location intelligence can be made available to
a wide variety of Industries. Some examples include:
Restaurant/Retail
The core strategic advantage in these industries is “location, location, location.” Location provides
insight into the most critical aspects of the business. Reporting and analyzing on the spatial
dimensions of transaction data, customer and demographic data, inventory data, and more provides
local, national and global retail and restaurant chains with a significant competitive advantage.
Case Study
Ray Kroc, founder of the McDonald’s restaurant chain provided insight into his companies
Location Intelligence program when, following a lecture, Kroc asked a group of MBA students
what business he was in. Thinking this was a joke, one of the students gave the obvious
reply: “The hamburger business, of course,” the student said. Kroc promptly told him that he
was wrong. He declared, “I’m not in the hamburger business. My business is real estate.”
Kroc went on to explain to the skeptical students that, while his company’s business plan
stated the obvious— that his primary day-to-day activity was, in fact, the selling of hamburger
franchises—Kroc’s main interest was the physical location of each franchise. McDonalds
“knew that the real estate and its location was the most significant factor in the success of
each franchise.” Basically, the person who bought the franchise was also buying the land
under the franchise. Today, McDonald’s is the world’s largest single owner of real estate, a
portfolio that includes some of the most valuable traffic intersections in the world.
Communications
Location Intelligence enables communications companies to effectively visualize where revenue fall
off needs to be addressed, where their most profitable customers are located, and where the most
effective cross-sell opportunities are present. Key Performance Indicators can be tracked, viewed by
location, and displayed in detailed maps for analysis and assessment.
Case Study
Traditionally, customers conducting a multi channel marketing campaign are able to analyze
web data with Google Analytics but there is no tool to report on inbound calls. Justin Graham
CEO, had a vision to reshape this market by allowing customer’s call data to be analyzed as
easily as their web data. He sought a solution that would use maps to allow customer’s to
visualize their call data and regional demographic data in conjunction with standard tabular
data.
The challenge was to find a solution that was a combination of GIS and Business Intelligence
platform. Jet found this with Yellowfin. Having implemented Yellowfin, Jet’s customer’s have
the ability to query the “where” as well as the “what” and “when” with the call data they were
collecting.
Location Intelligence
6 Copyright © Yellowfin International 2010
Justin Graham, (CEO Jet Interactive) said “Every time any ad or form of internet marketing
delivers a phone call, the call is recorded, traced back and can be seen in real-time detailed
reports showing call volume”.
By combining Call Analytics with Location Intelligence, customers are able to track the
success of their traditional and online advertising campaigns as they happen, allowing them
to make changes to ensure a successful return on investment.
Banking
Branch-level metrics are a mainstay of banking analytics. The Location Component provides the
ability to quickly and easily generate reports and maps related to product performance, transaction
volumes, customer demographics and more. The ability to move back and forth between tables and
maps, and to manipulate data fluidly in both views, helps identify opportunities before competitors see
them, and respond to potential threats before they materialize.
Healthcare
Preventing the spread of an epidemic can be difficult. It starts with the need to identify the exact
location of each case, when it was identified and treated. The diffusion of the illness can be tracked
much more effectively when geospatial data are displayed on a screen and the number of cases can
be color coded to indicate both intensity as well as timing.
Agriculture
Forecasting the crop yields from a producing area can be done through imaging techniques. Specific
agricultural regions where a crop has been planted can be color coded, the time to harvest estimated
and the health of crops assessed. This reduces the time it takes to produce a forecast and improves
its accuracy.
Crime Analysis
Law enforcement organizations have been mapping the incidence of crime in metropolitan areas for
quite some time. What’s new is the ability to integrate this with information from large databases from
other relevant organizations. Seeing the use of a credit card pop up on a screen on a map allows
better predictions of where a suspect might be going. Identifying geographical patterns in the financial
transactions of an individual or an organization tend to provide insights that investigators can use to
crack a case.
Location Intelligence
7 Copyright © Yellowfin International 2010
What are the external factors driving location Intelligence?
For decades, GIS was the only comprehensive option for managing location-centric business
processes and decision-making provided and designed by vendors such as ESRI, MapInfo, Northrop
Grumman and Lockheed Martin.
However, the market opportunity is expanding with the entrance of familiar giants such as Microsoft,
Google and Yahoo!, which are making simple maps and location search accessible to the masses for
free. In addition, internet technology such as portals, Simple Object Access Protocol (SOAP)/XML,
Asynchronous JavaScript and XML (AJAX) and mash-ups (i.e., Web 2.0 applications that use content
from more than one source to create a completely new service) speed and simplify internet
application development.
The three drivers of location intelligence for organizations are:
1. Growing awareness of location-enabled services
Location intelligence has been popularized by consumer applications from Internet search
portals and navigation device vendors; and this increased awareness is moving into the
Enterprise segment of the market.
2. The availability of high quality, current and complete data
Commercial geographic content providers are getting more sophisticated in the data offerings
made available (e.g. to the building units in apartment buildings) allowing for a hyper-local
perspective in business applications not previously available. Full service providers of location
intelligence include subscriptions to geographic data that is maintained and developed on an
on-going basis.
3. The rise of web services as a better-faster-cheaper deployment model
Web Map Services is one of the most compelling innovations allowing for deployments of
location intelligence that are cost effective and pervasive. Solutions and delivery models are
maturing and can be adopted without any disruption to existing IT structures or data modelling
applications, reducing the attendant risk and expense.
More and more, the value of location intelligence is being linked to strategic and operational success
at an enterprise level. As a means of generating revenues and controlling expenditures, location
intelligence can directly impact profitability.
What are the internal drivers for Location intelligence?
Even organizations that understand the value of references to location implicitly or explicitly
represented within their enterprise struggle to translate that understanding into meaningful profit-
generating activities.
Much of the difficulty stems from the challenges of marrying business data, which is typically housed
in relational databases, with geographic information. Location Intelligence solutions that provide
access to both sets of data are needed. The result is a clean, current and consolidated view of
enterprise information revealing new opportunities to enhance profitability.
Enterprises can leverage Location Intelligence to benefit all aspects of the enterprise. The three
primary internal drivers for these solutions are:
1. Better Business decisions
Location Intelligence
8 Copyright © Yellowfin International 2010
The use of Location Intelligence to provide insight into optimal business strategy operations
and intelligence is a key driver. Typically, the solutions are industry-specific, ranging from
trade area selections in retail to asset utilization in healthcare.
2. Improved customer-facing portals and activities
These are enterprise applications that provide CRM features such as customer service and
self-service. Real estate is an area that has embraced location intelligence and has begun to
explore the possibilities for sales, marketing, customer service and self-service.
3. Consumer applications
Mash-ups are perfect examples of businesses focused on providing services to consumers.
Applications that build loyalty among customers and influence purchasing behaviors. For
example, retailers can execute store-specific promotions with more accuracy, and profile and
target their markets, resulting in the identification of higher value customers. Or retailers may
use location intelligence to augment loyalty program services via internet channels, as in
neighbourhood smart store offerings.
Benefits of Locations Intelligence
Location Intelligence provides you with the ability to visualize your spatial or geographic data on
maps, floorplans etc. This style of visualisation differs from standard table or grid reports and charts
in that it associates your data with a particular location and allows you to easily see patterns which
are otherwise hidden within a dataset.
1. Used where traditional tables/grids, graphs and other analysis tools fall short
Tables/grids and charts only tell a part of the story. Map visualizations are the only way to
quickly relate BI data with locations that are meaningful to your business and to detect
geographic trends such as customer clusters or outlyers.
2. Shows where data is NOT located in addition to where it is located
Geographic visualizations are complete. This means that when looking at a map we see it in
its entirety. For eaxample when looking at a map of the US we see the entire USA laid out
before us. So when overlaying your data onto a map not only do you see where you are on
the map but where you are not located. This provides you with instant insight into the
potential markets that you may be missing out on.
Location Intelligence
9 Copyright © Yellowfin International 2010
3. Set you maps in motion to see changes over time
In addition to location, time is also a critical determinant of your data analysis. With
Yellowfin’s map animation you can ‘re-play’ your data and to see the changes overtime
animated. This provides you with an understanding of how trends are changing and hot spots
are moving geographically.
Location Intelligence
10 Copyright © Yellowfin International 2010
Spatial data and layering underpins Location Intelligence?
The most critical element in your capacity to deliver Location intelligence is the ability to accurately
capture and store your data in a spatial format. Different geographical features are expressed by
different types of geometry, such as:
1. Points
Points (often expressed as latitude and longitude) are used for geographical features that can
best be expressed by a single point reference; in other words, simple location. For example,
the locations of customers, stores or points of interest. Points convey the least amount of
information and no measurements are possible with point features.
2. Lines
One-dimensional lines are used for linear features such as roads and railroads. Line features
can measure distance.
3. Polygons
Two-dimensional polygons are used for geographical features that cover a particular area
such as sales territory, drive time from stores, customer density, or land uses. Polygons
convey the most amount of information and can be used to measure perimeter and area.
Each of these geometries is linked to a row in a database that describes their attributes. For example,
a database that describes a sales territory may contain average household income, population by
segment, and sales history. This information can be used to make a map to describe a particular
attribute of the dataset. For example, sales territory could be coloured depending on level of sales.
Different geometries can also be compared. For example, the GIS could be used to identify all
customers (point geometry) that are within 100 kilometres of a sales territory (polygon geometry) that
has a high level of sales.
Geocoding – creating geographic data types.
Geospatial data consists of the where an event or item took place or exists. This data could be
represented by something as abstract as a country to as detailed as a full address including: address,
city, state, postal code, and country. The more data available, the better the accuracy of location
plotting that can be achieved. The entire process of going from raw data to being able to plot that
information on a map consists of a step called geocoding.
Geocoding is taking your street address information or other types of geographic data like an internet
IP Address and getting a latitude and longitude from that. With a latitude and longitude you can
produce aggregated heats maps or bubble plots. This geospatial data will also give you the ability to
filter that data in amazing ways as well; Imagine being able to filter for all related data within x-number
of miles from that, or points that only exist within a boundary.
Location Intelligence
11 Copyright © Yellowfin International 2010
Initially you may not have geographic data types available for your data. However Geocoding
provides you with the process to turn basic address information into meaningful geographic data
points by relating a physical address such as 360 Elizabeth street, Melbourne into a latitude and
longitude (-37.810838,144.961849)
The Join Problem - Why layers are cool
One of the most valuable functions of Location intelligence is
its ability to overcome the “join problem”. This is when data
has various levels of granularity and using a traditional SQL
environment it is not possible to correlate these together into
a meaningful report easily because the data is incompatible.
Granularity is when one aspect of your data is captured at
the customer level for example demographics, but other data
is captured at the store level for example revenue. If you
wanted to compare revenue to demographic this would be
hard to do in a standard table report but with Map Layers
this becomes easy.
In most GIS software data is organized in themes as data
layers, such as customer distribution, store drive time etc.
This approach allows data to be input as separate themes
and overlaid based on analysis requirements.
The really powerful aspect of layers is that the human brain, which is wired to find patterns, joins the
incompatible data together rather than a complex query, and it is so intuitive that anyone can
understand the data being presented to them.
In any Location Intelligence project a variety of data layers will be required. These must be identified
before the project is started and a priority given to the input or digitizing of the spatial data layers. This
is mandatory, as often one data layer contains features that are coincident with another, e.g. lakes
can be used to define polygons within the forest inventory data layer. Data layers are commonly
defined based on the needs of the user and the availability of data. They should be completely user
definable.
Location Intelligence
12 Copyright © Yellowfin International 2010
Styles of Spatial Data Access
Location Intelligence can be driven by a number of spatially enabled methods. Typically complex GIS
systems were considered the norm, however a range of alternatives have entered the market which
can make Location Intelligence incredibly easy to implement into your organisation.
Web Map Services
A Web Map Service (WMS) is a standard protocol for serving georeferenced map images over the
Internet that are generated by a map server using data from a GIS database. This standard allows
you to access any spatial data stored in your GIS system, or even externally hosted GIS data
providers.
GIS data stored in a data base
Your geo-coded spatial data that relates your business data to spatial attributes such as address etc.
These can be stored in databases that support spatial data types such as Oracle, MySQL and SQL
Server. By storing spatial data in relational tables, the database makes it possible to combine spatial
data with any other kind of business data; this removes the need to maintain a separate, dedicated
spatial data store and enables high performance queries that do not need to combine data from
multiple external sources.
Geographic images
In some cases you may not have access to detailed maps and your mapping requirements are
relatively simple. Fir instance you want to show sales volume be state or sales region. In this
scenario you can quickly and easily implement geographic images, or rasta images, to deliver your
location intelligence needs. These images have the benefit that with almost no geo-coding you can
create meaningful maps for your business users.
Google / Bing Maps
Google and Bing Maps are basic web mapping service applications, free (for non-commercial use),
that powers many map-based services, and maps embedded on third-party websites via the API.
The challenge of multiple geographic and business data sources is to have a platform that seamlessly
ties all of these together. The real power of Location Intelligence is the integration of business and
spatial data.
Location Intelligence
13 Copyright © Yellowfin International 2010
The highest level of integration for technology is always at the functional level. It is here where we see
an effort to make transparent the use of underlying technology for the user. Yellowfin is one example
of leading technology that achieves this level of integration; simplifying the integration of geographical
data and traditional data sources for your Business and Location Intelligence needs. The solution
easily applies traditional data, geographic data, and advanced visualization into a cohesive BI
platform.
This combination is where leading products like Yellowfin excel. Establishing a common analytic
platform that reaches across disparate data and technologies, bringing them together is a single,
cohesive, synchronized data discovery solution for all user communities.
Yellowfin’s Location Intelligence Solution
Presentation Quality Maps
Save time and money creating maps with up-
to-date data quickly. Yellowfin can effortlessly
display your data in a wide variety of mapping
formats. From basic google maps, GIS data
sets to Web Map Services (WMS), Yellowfin
provides you with highly layered maps
containing deep analytical insight. Via WMS
Yellowfin lets you rapidly integrate or create
mashups using your existing GIS tools such as
ESRI or MapInfo.
Detect Geographic Trends
Better entity placement, customer and
competitor analysis. Yellowfins out of the box
location Intelligence means that you can start
to leverage the power of location instantly
without the need for 3
rd
party plugins. What
proportion of my customers live within 15 miles
of a store, what is the geographic spread of
my customers and how has this changed over
time. Your ability to view table and map data
Location Intelligence
14 Copyright © Yellowfin International 2010
simultaneously gives you a deeper understanding of geographic trends.
Take advantage of Data Layering & Statistical Data
The ability to overlay demographic or statistical data onto your maps provides you with an additional
layer of analysis that can add to your interpretation of the data. Data such as Per capita income,
census data, retail statistics, telco statistics can easily be layered onto a map. Often with this type of
data the additional data set is incompatible with your initial data set. For example you have sales
income by sales territory and customer details by address. How do you merge or join the two
together? Typically this is difficult using traditional database techniques but with Yellowfin you can
create multilayers maps. These layers let the human eye doing the joining for you – creating that a ha
moment.
Summary
Our ability to exploit the massive amounts of complex, disparate data will never be resolved by the
traditional technology we introduce or the common techniques we attempt to implement. Pie charts
and other typical graphics, for example, fall short of supporting better decision making. A pie chart is
simply not sufficient to interrogate a large OLAP cube or provide the necessary insight from the data
pushed into our dashboards.
Innovative visualization technology is necessary to effectively synthesize detailed data into
information and present this content in an understandable manner to users. However, for leading
business intelligence (BI) environments, this visualization must be based on spatial (geographic) data.
Effective BI, therefore, is dependent on its capacity to include spatial data and deliver Location
Intelligence.
Integrating spatial data with visualization technology delivers accurate, high-impact information
content. Solutions like Yellowfin foster this integration for BI applications, transforming data into
human understanding and actionable insight.
	
  
Find	
  out	
  more	
  
Contact Yellowfin at www.yellowfin.bi
and ask for our proven roadmap to assist you
to successfully implement Yellowfin’s
Location Intelligence into your organization.

Wp location

  • 1.
    Making Business Intelligence Easy WhitePaper Location Intelligence
  • 2.
    Location Intelligence 2 Copyright© Yellowfin International 2010 Contents Overview.................................................................................................................................................3   Location Intelligence what is it?..............................................................................................................4   A brief history......................................................................................................................................4 Who is it for?...........................................................................................................................................5   Restaurant/Retail ................................................................................................................................5 Communications .................................................................................................................................5 Banking...............................................................................................................................................6 Healthcare...........................................................................................................................................6 Agriculture...........................................................................................................................................6 Crime Analysis....................................................................................................................................6 What are the external factors driving location Intelligence? ...................................................................7   What are the internal drivers for Location intelligence?..........................................................................7   Benefits of Locations Intelligence ...........................................................................................................8   Spatial data and layering underpins Location Intelligence? .................................................................10   Geocoding – creating geographic data types. ..................................................................................10 The Join Problem - Why layers are cool...........................................................................................11 Styles of Spatial Data Access...............................................................................................................12   Web Map Services............................................................................................................................12 GIS data stored in a data base .........................................................................................................12 Geographic images...........................................................................................................................12 Google / Bing Maps ..........................................................................................................................12 Yellowfin’s Location Intelligence Solution.............................................................................................13   Summary ..............................................................................................................................................14   Yellowfin, and the Yellowfin logo are trademarks or registered trademarks of Yellowfin International Pty Ltd. All other names are trademarks or registered trademarks of their respective companies. While every attempt has been made to ensure that the information in this document is accurate and complete, some typographical errors or technical inaccuracies may exist. Yellowfin does not accept responsibility for any kind of loss resulting from the use of information contained in this document. The information contained in this document is subject to change without notice. This text contains proprietary information, which is protected by copyright. All rights are reserved. No part of this document may be photocopied, reproduced, stored in a retrieval system, transmitted in any form or by any means, or translated into another language without the prior written consent of Yellowfin International Pty Ltd. The incorporation of the product attributes discussed in these materials into any release or upgrade of any Yellowfin software product – as well as the timing of any such release or upgrade – is at the sole discretion of Yellowfin. This document version published January 2010 Copyright © 2010Yellowfin International Pty Ltd.
  • 3.
    Location Intelligence 3 Copyright© Yellowfin International 2010 Overview Today’s knowledge workers deal with vast amounts of data in a variety of formats, from spreadsheets and databases, to online content such as statistical data. The recent trend towards mash up solutions in which information and content from multiple sources is combined to create versatile online applications is indicative of the way that business users use highly integrated solutions to make sense of the vast amount of information that is available to them. At the same time, advances in technology have led to the proliferation of geographical services, including online mapping solutions such as Google Maps and Microsoft® Virtual Earth. This technology was once the preserve of geographic information system (GIS) specialists but is now widely available to everyone. These two factors bring new expectations and opportunities for organizations. The ubiquity of geographical services, and the increasing sophistication with which users can consume data means that spatial information is just another component to be incorporated into a Business intelligence solution and used as a basis for making better decisions and providing higher value services. Spatial data can be used in many ways, such as: • How big is my market area? • What is my share of the market area? • Which market areas offer the greatest potential for growth? • What is the spending potential for my product in this market? • How many stores can this market support? These examples represent only a few of the possibilities created by the integration of spatial data into software applications. Yellowfin provides support for geographical data through the inclusion of location Intelligence capability, which you can use to query and present location-based information. The spatial support in Yellowfin can help users to make better decisions through analysis of location data in scenarios such as: • Customer-base management and development • Environmental-related data impact, analysis, and planning • Financial and economic analysis in communities • Government-based planning and development analysis • Market segmentation and analysis • Scientific research study design and analysis This whitepaper provides a high-level introduction to the comprehensive spatial data support in Yellowifn, and describes its high-performance spatial capabilities and location-aware application extensibility.
  • 4.
    Location Intelligence 4 Copyright© Yellowfin International 2010 Location Intelligence what is it? More than 70% of your organizational data has a location component - be it a customer address or a sales territory. This combined with the growing ability of businesses to quickly absorb large volumes of data, together with the increased availability of digital maps and spatially-enabled applications has created an unprecedented opportunity to incorporate geographic factors into decision making processes and analysis. Location Intelligence is the capacity to organize and understand complex events through the use of geographic relationships inherent in all information. This is achieved by combining location-related data with other business data, organizations can gain critical insights, make better decisions and optimize important processes and applications. Location Intelligence offers organizations opportunities to streamline their business processes and customer relationships to improve performance and results. Yellowfin’s Location Intelligence combines traditional Business Intelligence with the addition of a spatial element to let you easily visualize your spatial and business data simultaneously. As a BI platform with its fully integrated GIS capability, Yellowfin is unique. It lets you query the “where” as well as the “what” and “when”. This distinctive capability enables you to merge your spatial data with your corporate information. Table data and maps are interlinked and displayed as a single report. The merging of your spatial data into your business data will give you the analytic capability that you need to excel in Location Intelligence. A brief history Location Intelligence is the provision of thematic maps that assist with the understanding of where events such as sales or incidents occur. One of the earliest examples of the use of thematic mapping comes from London physician John Snow. Though disease had been mapped thematically, Snow’s cholera map in 1854 is the best known example of using thematic maps for analysis. Essentially, his technique and methodology anticipate principles of a geographic information system (GIS). Starting with an accurate base map of a London neighborhood which included streets and pump locations, Snow mapped out the incidents of cholera death. The emerging pattern centered around one particular pump on Broad Street. At Snow’s request, the handle of the pump was removed, and new cholera cases ceased almost at once. Further investigation of the area revealed the Broad Street pump was near a sewer line. Subsequently maps used to help explain complex phenomenon have been used with increasing regularity. By the early 20th century map theory had led to the development of maps which were separated into layers, and computer hardware development spurred by nuclear weapon research would lead to general-purpose computer "mapping" applications by the early 1960s. By the early 1980s commercial vendors of GIS software such as ESRI made GIS applications available to highly trained users within organizations. However, it was through the rapid growth of
  • 5.
    Location Intelligence 5 Copyright© Yellowfin International 2010 internet based GIS applications, such as Google Maps launches in 2005, that truly exposed the power of location based decision making to a much broader business audience. Who is it for? Location affects virtually every business and government entity across almost every functional area. Customers and constituents, stores and service offices, territories and voting districts, threats and opportunities, can all be viewed and analyzed spatially. Common BI tools do a good job at analyzing the basic who, what, when, and how questions that characterize things such as customers. But unlike the dimensions of who, what, and when (customer, product, time), the where gets little attention. For this Location Intelligence capability is needed. The where, its geographic location, of any business transaction is almost always captured. In fact, multiple locations are often captured. Ship-to, bill-to and customer contacts are all often captured at companies everywhere. By using this data effectively Location intelligence can be made available to a wide variety of Industries. Some examples include: Restaurant/Retail The core strategic advantage in these industries is “location, location, location.” Location provides insight into the most critical aspects of the business. Reporting and analyzing on the spatial dimensions of transaction data, customer and demographic data, inventory data, and more provides local, national and global retail and restaurant chains with a significant competitive advantage. Case Study Ray Kroc, founder of the McDonald’s restaurant chain provided insight into his companies Location Intelligence program when, following a lecture, Kroc asked a group of MBA students what business he was in. Thinking this was a joke, one of the students gave the obvious reply: “The hamburger business, of course,” the student said. Kroc promptly told him that he was wrong. He declared, “I’m not in the hamburger business. My business is real estate.” Kroc went on to explain to the skeptical students that, while his company’s business plan stated the obvious— that his primary day-to-day activity was, in fact, the selling of hamburger franchises—Kroc’s main interest was the physical location of each franchise. McDonalds “knew that the real estate and its location was the most significant factor in the success of each franchise.” Basically, the person who bought the franchise was also buying the land under the franchise. Today, McDonald’s is the world’s largest single owner of real estate, a portfolio that includes some of the most valuable traffic intersections in the world. Communications Location Intelligence enables communications companies to effectively visualize where revenue fall off needs to be addressed, where their most profitable customers are located, and where the most effective cross-sell opportunities are present. Key Performance Indicators can be tracked, viewed by location, and displayed in detailed maps for analysis and assessment. Case Study Traditionally, customers conducting a multi channel marketing campaign are able to analyze web data with Google Analytics but there is no tool to report on inbound calls. Justin Graham CEO, had a vision to reshape this market by allowing customer’s call data to be analyzed as easily as their web data. He sought a solution that would use maps to allow customer’s to visualize their call data and regional demographic data in conjunction with standard tabular data. The challenge was to find a solution that was a combination of GIS and Business Intelligence platform. Jet found this with Yellowfin. Having implemented Yellowfin, Jet’s customer’s have the ability to query the “where” as well as the “what” and “when” with the call data they were collecting.
  • 6.
    Location Intelligence 6 Copyright© Yellowfin International 2010 Justin Graham, (CEO Jet Interactive) said “Every time any ad or form of internet marketing delivers a phone call, the call is recorded, traced back and can be seen in real-time detailed reports showing call volume”. By combining Call Analytics with Location Intelligence, customers are able to track the success of their traditional and online advertising campaigns as they happen, allowing them to make changes to ensure a successful return on investment. Banking Branch-level metrics are a mainstay of banking analytics. The Location Component provides the ability to quickly and easily generate reports and maps related to product performance, transaction volumes, customer demographics and more. The ability to move back and forth between tables and maps, and to manipulate data fluidly in both views, helps identify opportunities before competitors see them, and respond to potential threats before they materialize. Healthcare Preventing the spread of an epidemic can be difficult. It starts with the need to identify the exact location of each case, when it was identified and treated. The diffusion of the illness can be tracked much more effectively when geospatial data are displayed on a screen and the number of cases can be color coded to indicate both intensity as well as timing. Agriculture Forecasting the crop yields from a producing area can be done through imaging techniques. Specific agricultural regions where a crop has been planted can be color coded, the time to harvest estimated and the health of crops assessed. This reduces the time it takes to produce a forecast and improves its accuracy. Crime Analysis Law enforcement organizations have been mapping the incidence of crime in metropolitan areas for quite some time. What’s new is the ability to integrate this with information from large databases from other relevant organizations. Seeing the use of a credit card pop up on a screen on a map allows better predictions of where a suspect might be going. Identifying geographical patterns in the financial transactions of an individual or an organization tend to provide insights that investigators can use to crack a case.
  • 7.
    Location Intelligence 7 Copyright© Yellowfin International 2010 What are the external factors driving location Intelligence? For decades, GIS was the only comprehensive option for managing location-centric business processes and decision-making provided and designed by vendors such as ESRI, MapInfo, Northrop Grumman and Lockheed Martin. However, the market opportunity is expanding with the entrance of familiar giants such as Microsoft, Google and Yahoo!, which are making simple maps and location search accessible to the masses for free. In addition, internet technology such as portals, Simple Object Access Protocol (SOAP)/XML, Asynchronous JavaScript and XML (AJAX) and mash-ups (i.e., Web 2.0 applications that use content from more than one source to create a completely new service) speed and simplify internet application development. The three drivers of location intelligence for organizations are: 1. Growing awareness of location-enabled services Location intelligence has been popularized by consumer applications from Internet search portals and navigation device vendors; and this increased awareness is moving into the Enterprise segment of the market. 2. The availability of high quality, current and complete data Commercial geographic content providers are getting more sophisticated in the data offerings made available (e.g. to the building units in apartment buildings) allowing for a hyper-local perspective in business applications not previously available. Full service providers of location intelligence include subscriptions to geographic data that is maintained and developed on an on-going basis. 3. The rise of web services as a better-faster-cheaper deployment model Web Map Services is one of the most compelling innovations allowing for deployments of location intelligence that are cost effective and pervasive. Solutions and delivery models are maturing and can be adopted without any disruption to existing IT structures or data modelling applications, reducing the attendant risk and expense. More and more, the value of location intelligence is being linked to strategic and operational success at an enterprise level. As a means of generating revenues and controlling expenditures, location intelligence can directly impact profitability. What are the internal drivers for Location intelligence? Even organizations that understand the value of references to location implicitly or explicitly represented within their enterprise struggle to translate that understanding into meaningful profit- generating activities. Much of the difficulty stems from the challenges of marrying business data, which is typically housed in relational databases, with geographic information. Location Intelligence solutions that provide access to both sets of data are needed. The result is a clean, current and consolidated view of enterprise information revealing new opportunities to enhance profitability. Enterprises can leverage Location Intelligence to benefit all aspects of the enterprise. The three primary internal drivers for these solutions are: 1. Better Business decisions
  • 8.
    Location Intelligence 8 Copyright© Yellowfin International 2010 The use of Location Intelligence to provide insight into optimal business strategy operations and intelligence is a key driver. Typically, the solutions are industry-specific, ranging from trade area selections in retail to asset utilization in healthcare. 2. Improved customer-facing portals and activities These are enterprise applications that provide CRM features such as customer service and self-service. Real estate is an area that has embraced location intelligence and has begun to explore the possibilities for sales, marketing, customer service and self-service. 3. Consumer applications Mash-ups are perfect examples of businesses focused on providing services to consumers. Applications that build loyalty among customers and influence purchasing behaviors. For example, retailers can execute store-specific promotions with more accuracy, and profile and target their markets, resulting in the identification of higher value customers. Or retailers may use location intelligence to augment loyalty program services via internet channels, as in neighbourhood smart store offerings. Benefits of Locations Intelligence Location Intelligence provides you with the ability to visualize your spatial or geographic data on maps, floorplans etc. This style of visualisation differs from standard table or grid reports and charts in that it associates your data with a particular location and allows you to easily see patterns which are otherwise hidden within a dataset. 1. Used where traditional tables/grids, graphs and other analysis tools fall short Tables/grids and charts only tell a part of the story. Map visualizations are the only way to quickly relate BI data with locations that are meaningful to your business and to detect geographic trends such as customer clusters or outlyers. 2. Shows where data is NOT located in addition to where it is located Geographic visualizations are complete. This means that when looking at a map we see it in its entirety. For eaxample when looking at a map of the US we see the entire USA laid out before us. So when overlaying your data onto a map not only do you see where you are on the map but where you are not located. This provides you with instant insight into the potential markets that you may be missing out on.
  • 9.
    Location Intelligence 9 Copyright© Yellowfin International 2010 3. Set you maps in motion to see changes over time In addition to location, time is also a critical determinant of your data analysis. With Yellowfin’s map animation you can ‘re-play’ your data and to see the changes overtime animated. This provides you with an understanding of how trends are changing and hot spots are moving geographically.
  • 10.
    Location Intelligence 10 Copyright© Yellowfin International 2010 Spatial data and layering underpins Location Intelligence? The most critical element in your capacity to deliver Location intelligence is the ability to accurately capture and store your data in a spatial format. Different geographical features are expressed by different types of geometry, such as: 1. Points Points (often expressed as latitude and longitude) are used for geographical features that can best be expressed by a single point reference; in other words, simple location. For example, the locations of customers, stores or points of interest. Points convey the least amount of information and no measurements are possible with point features. 2. Lines One-dimensional lines are used for linear features such as roads and railroads. Line features can measure distance. 3. Polygons Two-dimensional polygons are used for geographical features that cover a particular area such as sales territory, drive time from stores, customer density, or land uses. Polygons convey the most amount of information and can be used to measure perimeter and area. Each of these geometries is linked to a row in a database that describes their attributes. For example, a database that describes a sales territory may contain average household income, population by segment, and sales history. This information can be used to make a map to describe a particular attribute of the dataset. For example, sales territory could be coloured depending on level of sales. Different geometries can also be compared. For example, the GIS could be used to identify all customers (point geometry) that are within 100 kilometres of a sales territory (polygon geometry) that has a high level of sales. Geocoding – creating geographic data types. Geospatial data consists of the where an event or item took place or exists. This data could be represented by something as abstract as a country to as detailed as a full address including: address, city, state, postal code, and country. The more data available, the better the accuracy of location plotting that can be achieved. The entire process of going from raw data to being able to plot that information on a map consists of a step called geocoding. Geocoding is taking your street address information or other types of geographic data like an internet IP Address and getting a latitude and longitude from that. With a latitude and longitude you can produce aggregated heats maps or bubble plots. This geospatial data will also give you the ability to filter that data in amazing ways as well; Imagine being able to filter for all related data within x-number of miles from that, or points that only exist within a boundary.
  • 11.
    Location Intelligence 11 Copyright© Yellowfin International 2010 Initially you may not have geographic data types available for your data. However Geocoding provides you with the process to turn basic address information into meaningful geographic data points by relating a physical address such as 360 Elizabeth street, Melbourne into a latitude and longitude (-37.810838,144.961849) The Join Problem - Why layers are cool One of the most valuable functions of Location intelligence is its ability to overcome the “join problem”. This is when data has various levels of granularity and using a traditional SQL environment it is not possible to correlate these together into a meaningful report easily because the data is incompatible. Granularity is when one aspect of your data is captured at the customer level for example demographics, but other data is captured at the store level for example revenue. If you wanted to compare revenue to demographic this would be hard to do in a standard table report but with Map Layers this becomes easy. In most GIS software data is organized in themes as data layers, such as customer distribution, store drive time etc. This approach allows data to be input as separate themes and overlaid based on analysis requirements. The really powerful aspect of layers is that the human brain, which is wired to find patterns, joins the incompatible data together rather than a complex query, and it is so intuitive that anyone can understand the data being presented to them. In any Location Intelligence project a variety of data layers will be required. These must be identified before the project is started and a priority given to the input or digitizing of the spatial data layers. This is mandatory, as often one data layer contains features that are coincident with another, e.g. lakes can be used to define polygons within the forest inventory data layer. Data layers are commonly defined based on the needs of the user and the availability of data. They should be completely user definable.
  • 12.
    Location Intelligence 12 Copyright© Yellowfin International 2010 Styles of Spatial Data Access Location Intelligence can be driven by a number of spatially enabled methods. Typically complex GIS systems were considered the norm, however a range of alternatives have entered the market which can make Location Intelligence incredibly easy to implement into your organisation. Web Map Services A Web Map Service (WMS) is a standard protocol for serving georeferenced map images over the Internet that are generated by a map server using data from a GIS database. This standard allows you to access any spatial data stored in your GIS system, or even externally hosted GIS data providers. GIS data stored in a data base Your geo-coded spatial data that relates your business data to spatial attributes such as address etc. These can be stored in databases that support spatial data types such as Oracle, MySQL and SQL Server. By storing spatial data in relational tables, the database makes it possible to combine spatial data with any other kind of business data; this removes the need to maintain a separate, dedicated spatial data store and enables high performance queries that do not need to combine data from multiple external sources. Geographic images In some cases you may not have access to detailed maps and your mapping requirements are relatively simple. Fir instance you want to show sales volume be state or sales region. In this scenario you can quickly and easily implement geographic images, or rasta images, to deliver your location intelligence needs. These images have the benefit that with almost no geo-coding you can create meaningful maps for your business users. Google / Bing Maps Google and Bing Maps are basic web mapping service applications, free (for non-commercial use), that powers many map-based services, and maps embedded on third-party websites via the API. The challenge of multiple geographic and business data sources is to have a platform that seamlessly ties all of these together. The real power of Location Intelligence is the integration of business and spatial data.
  • 13.
    Location Intelligence 13 Copyright© Yellowfin International 2010 The highest level of integration for technology is always at the functional level. It is here where we see an effort to make transparent the use of underlying technology for the user. Yellowfin is one example of leading technology that achieves this level of integration; simplifying the integration of geographical data and traditional data sources for your Business and Location Intelligence needs. The solution easily applies traditional data, geographic data, and advanced visualization into a cohesive BI platform. This combination is where leading products like Yellowfin excel. Establishing a common analytic platform that reaches across disparate data and technologies, bringing them together is a single, cohesive, synchronized data discovery solution for all user communities. Yellowfin’s Location Intelligence Solution Presentation Quality Maps Save time and money creating maps with up- to-date data quickly. Yellowfin can effortlessly display your data in a wide variety of mapping formats. From basic google maps, GIS data sets to Web Map Services (WMS), Yellowfin provides you with highly layered maps containing deep analytical insight. Via WMS Yellowfin lets you rapidly integrate or create mashups using your existing GIS tools such as ESRI or MapInfo. Detect Geographic Trends Better entity placement, customer and competitor analysis. Yellowfins out of the box location Intelligence means that you can start to leverage the power of location instantly without the need for 3 rd party plugins. What proportion of my customers live within 15 miles of a store, what is the geographic spread of my customers and how has this changed over time. Your ability to view table and map data
  • 14.
    Location Intelligence 14 Copyright© Yellowfin International 2010 simultaneously gives you a deeper understanding of geographic trends. Take advantage of Data Layering & Statistical Data The ability to overlay demographic or statistical data onto your maps provides you with an additional layer of analysis that can add to your interpretation of the data. Data such as Per capita income, census data, retail statistics, telco statistics can easily be layered onto a map. Often with this type of data the additional data set is incompatible with your initial data set. For example you have sales income by sales territory and customer details by address. How do you merge or join the two together? Typically this is difficult using traditional database techniques but with Yellowfin you can create multilayers maps. These layers let the human eye doing the joining for you – creating that a ha moment. Summary Our ability to exploit the massive amounts of complex, disparate data will never be resolved by the traditional technology we introduce or the common techniques we attempt to implement. Pie charts and other typical graphics, for example, fall short of supporting better decision making. A pie chart is simply not sufficient to interrogate a large OLAP cube or provide the necessary insight from the data pushed into our dashboards. Innovative visualization technology is necessary to effectively synthesize detailed data into information and present this content in an understandable manner to users. However, for leading business intelligence (BI) environments, this visualization must be based on spatial (geographic) data. Effective BI, therefore, is dependent on its capacity to include spatial data and deliver Location Intelligence. Integrating spatial data with visualization technology delivers accurate, high-impact information content. Solutions like Yellowfin foster this integration for BI applications, transforming data into human understanding and actionable insight.   Find  out  more   Contact Yellowfin at www.yellowfin.bi and ask for our proven roadmap to assist you to successfully implement Yellowfin’s Location Intelligence into your organization.