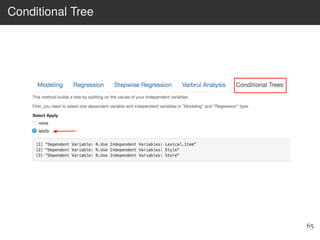
Download to read offline
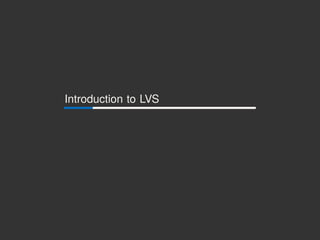
![How To Unify All Methods: Data Science Workflow
1. Import data into R: read_csv(), read_line() [even praat
files!]
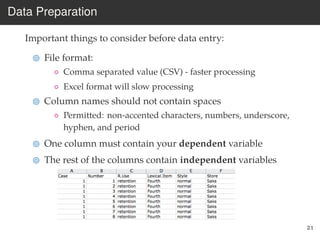
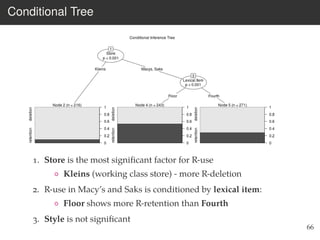
2. Tidy data - pre-processing
3. Transform with dplyr [select, subset, recode...]
4. Visualize with ggplot and plotly
5. Model with glm, lda, randomForest...
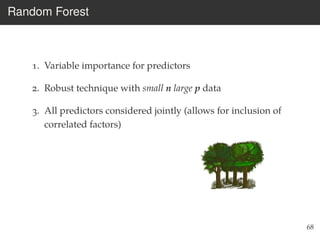
11
Tidyverse - a system of R packages for data manipulation,
exploration, and visualization that share a common design
philosophy (Wickham and Grolemund, 2017)](https://image.slidesharecdn.com/workshopnwav47-181017040120/85/Workshop-nwav-47-LVS-Tool-for-Quantitative-Data-Analysis-13-320.jpg)
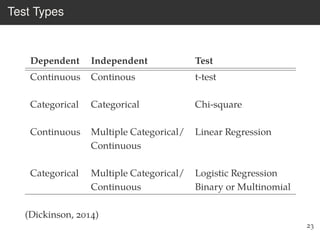

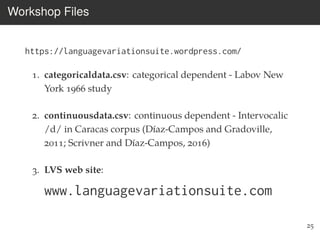
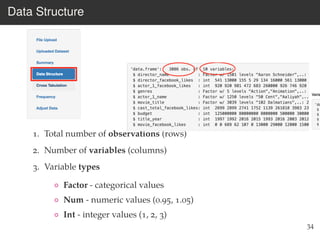

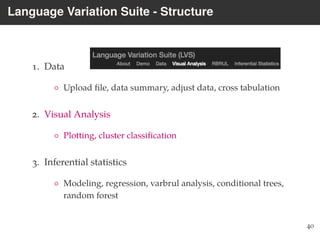
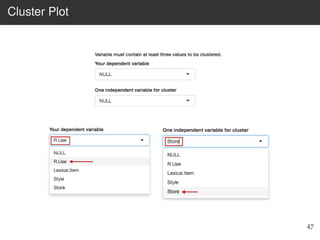
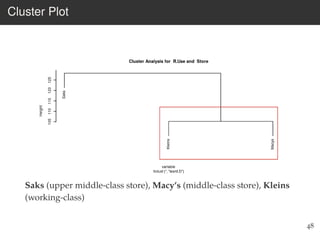
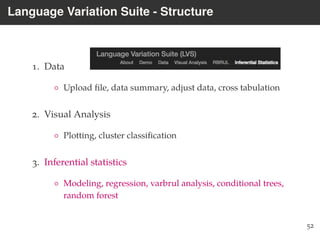
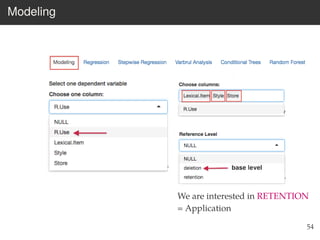

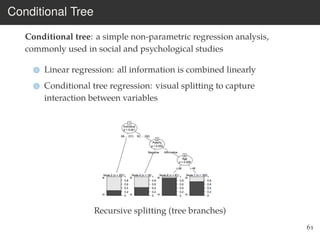
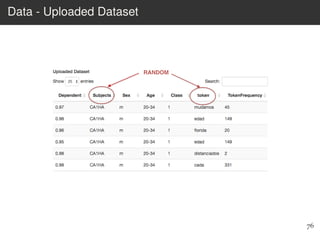
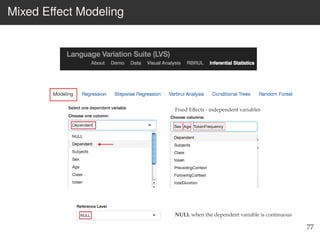
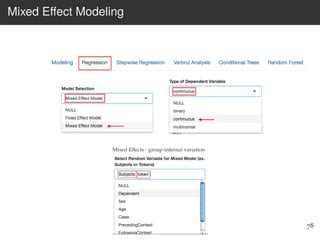
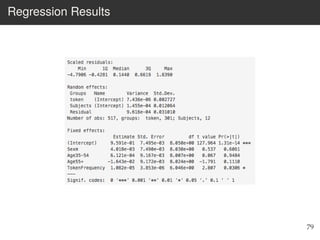
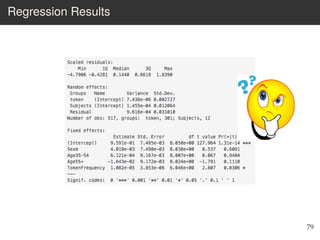
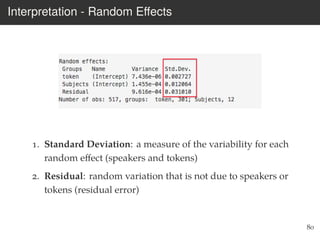
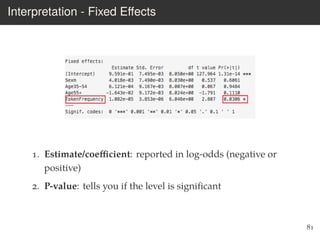
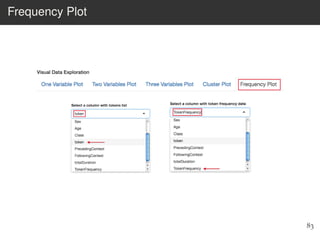
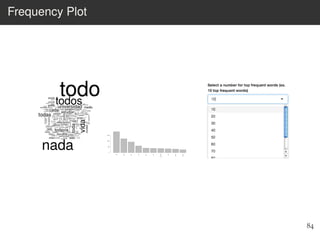
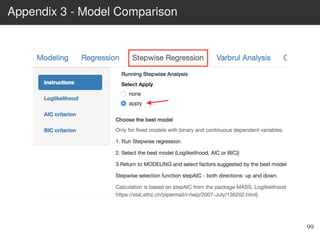

This document provides an overview of the Language Variation Suite (LVS) toolkit. The LVS is a web application designed for sociolinguistic data analysis. It allows users to upload spreadsheet data, perform data cleaning and preprocessing, generate summary statistics and cross tabulations, create data visualizations, and conduct various statistical analyses including regression modeling, clustering, and random forests. The workshop will cover the structure and functionality of the LVS through practical examples and exercises using sample sociolinguistic datasets.


![제 23회 보아즈(BOAZ) 빅데이터 컨퍼런스 - [MBOAX] : ABSA를 활용한 소비자 반응 분석 기반 운영 효율화 대시보드 설계](https://cdn.slidesharecdn.com/ss_thumbnails/3-1boaz23rdconferencemboax-260203102709-9d519923-thumbnail.jpg?width=640&height=640&fit=bounds)


