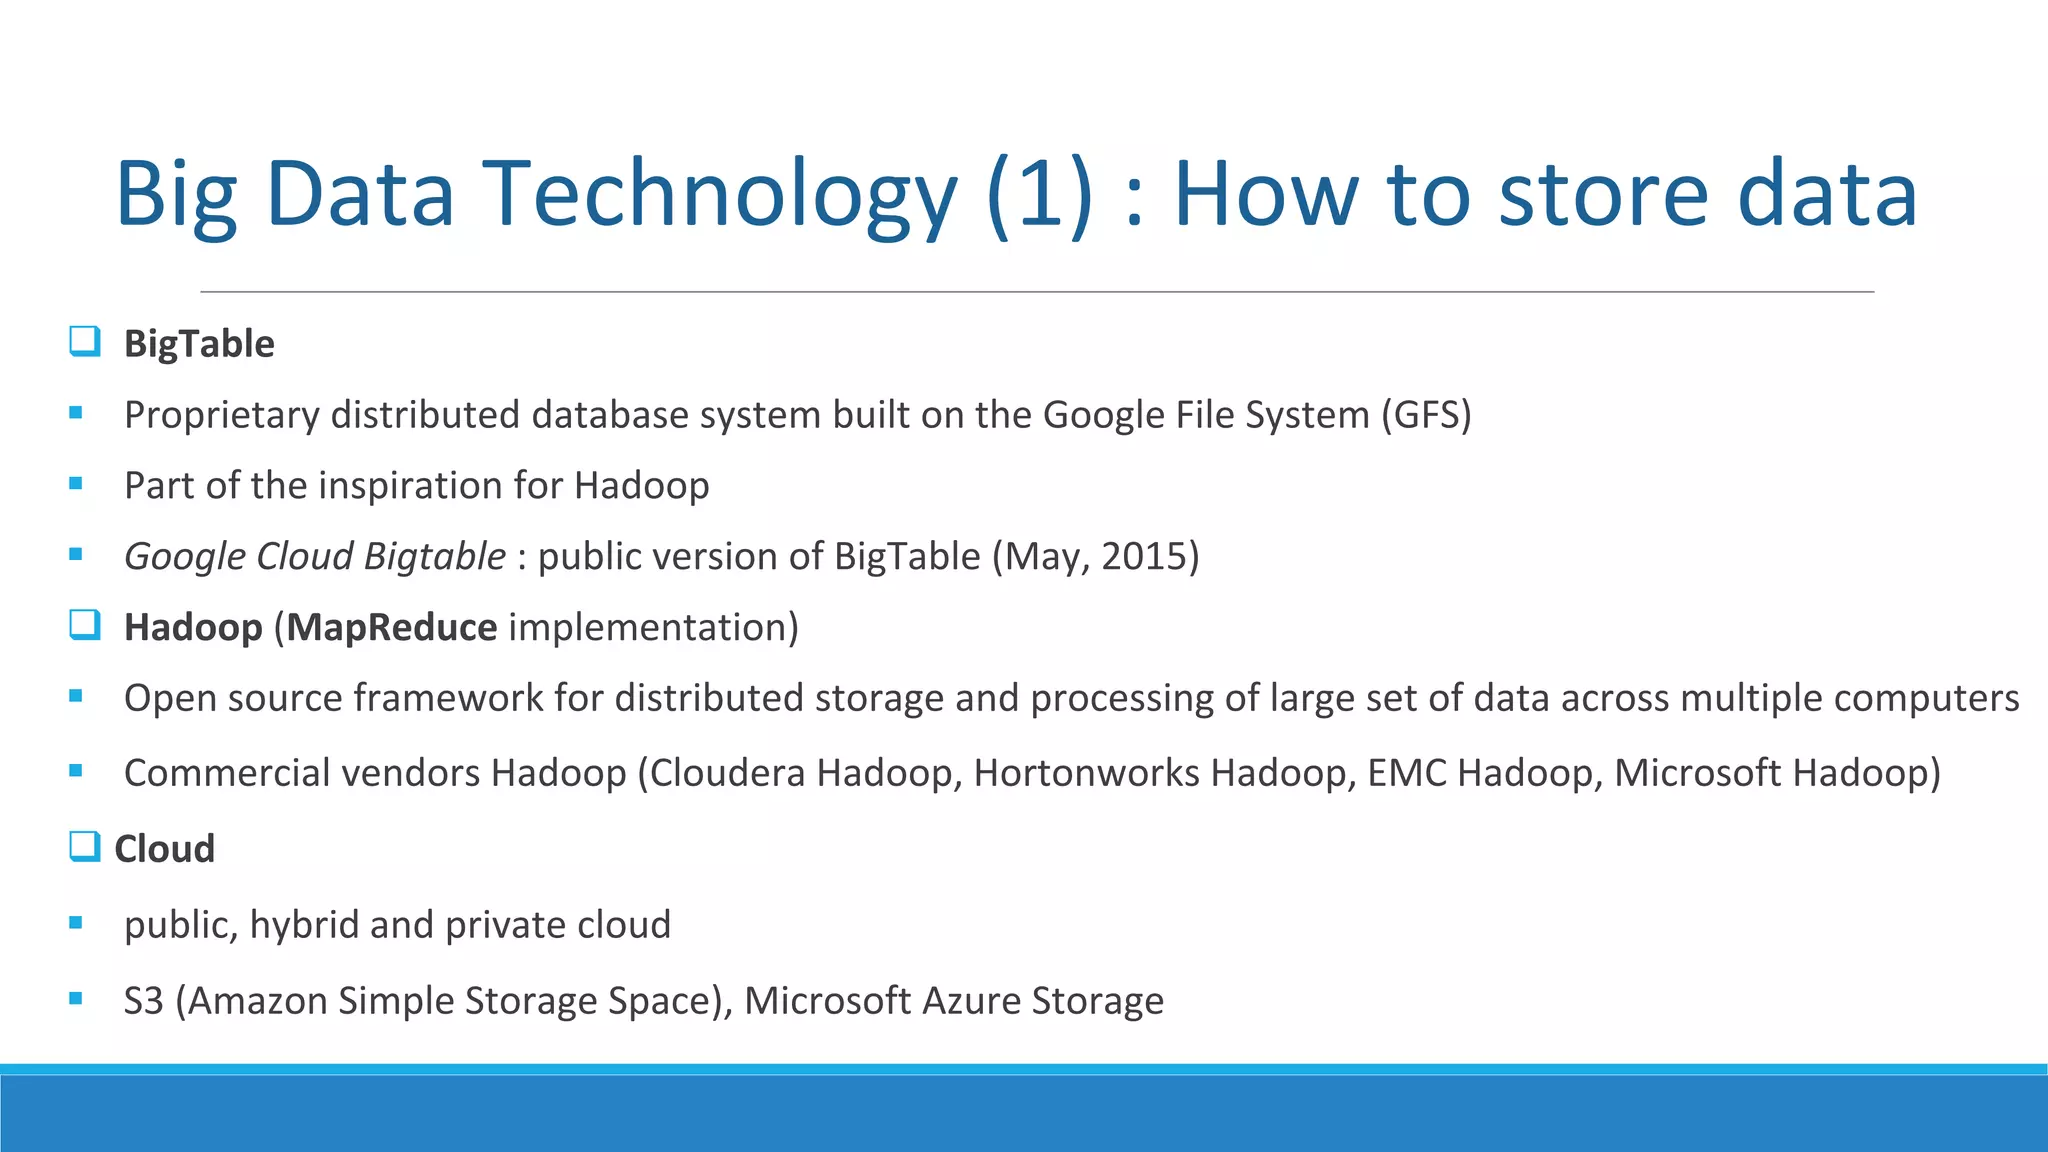
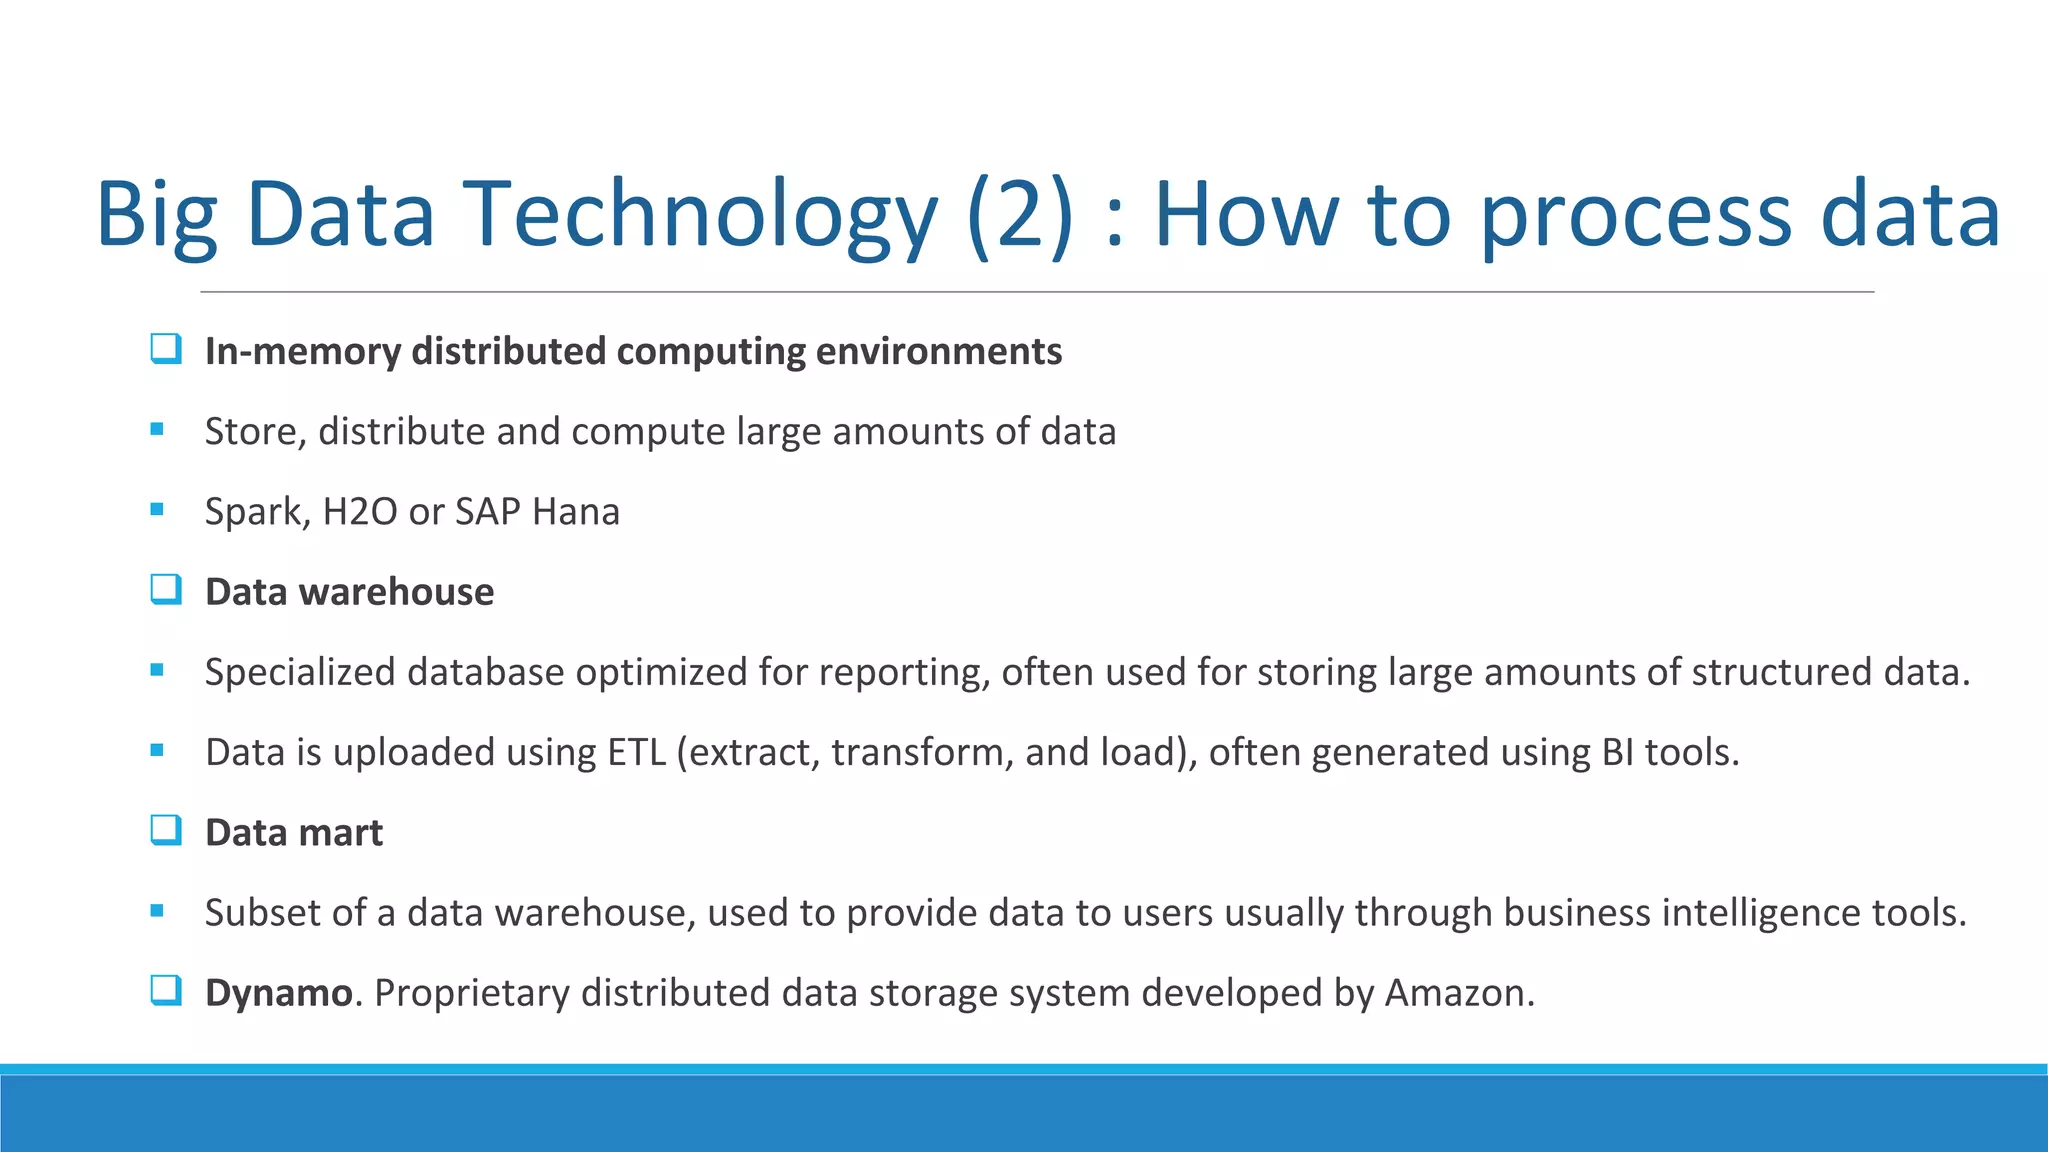
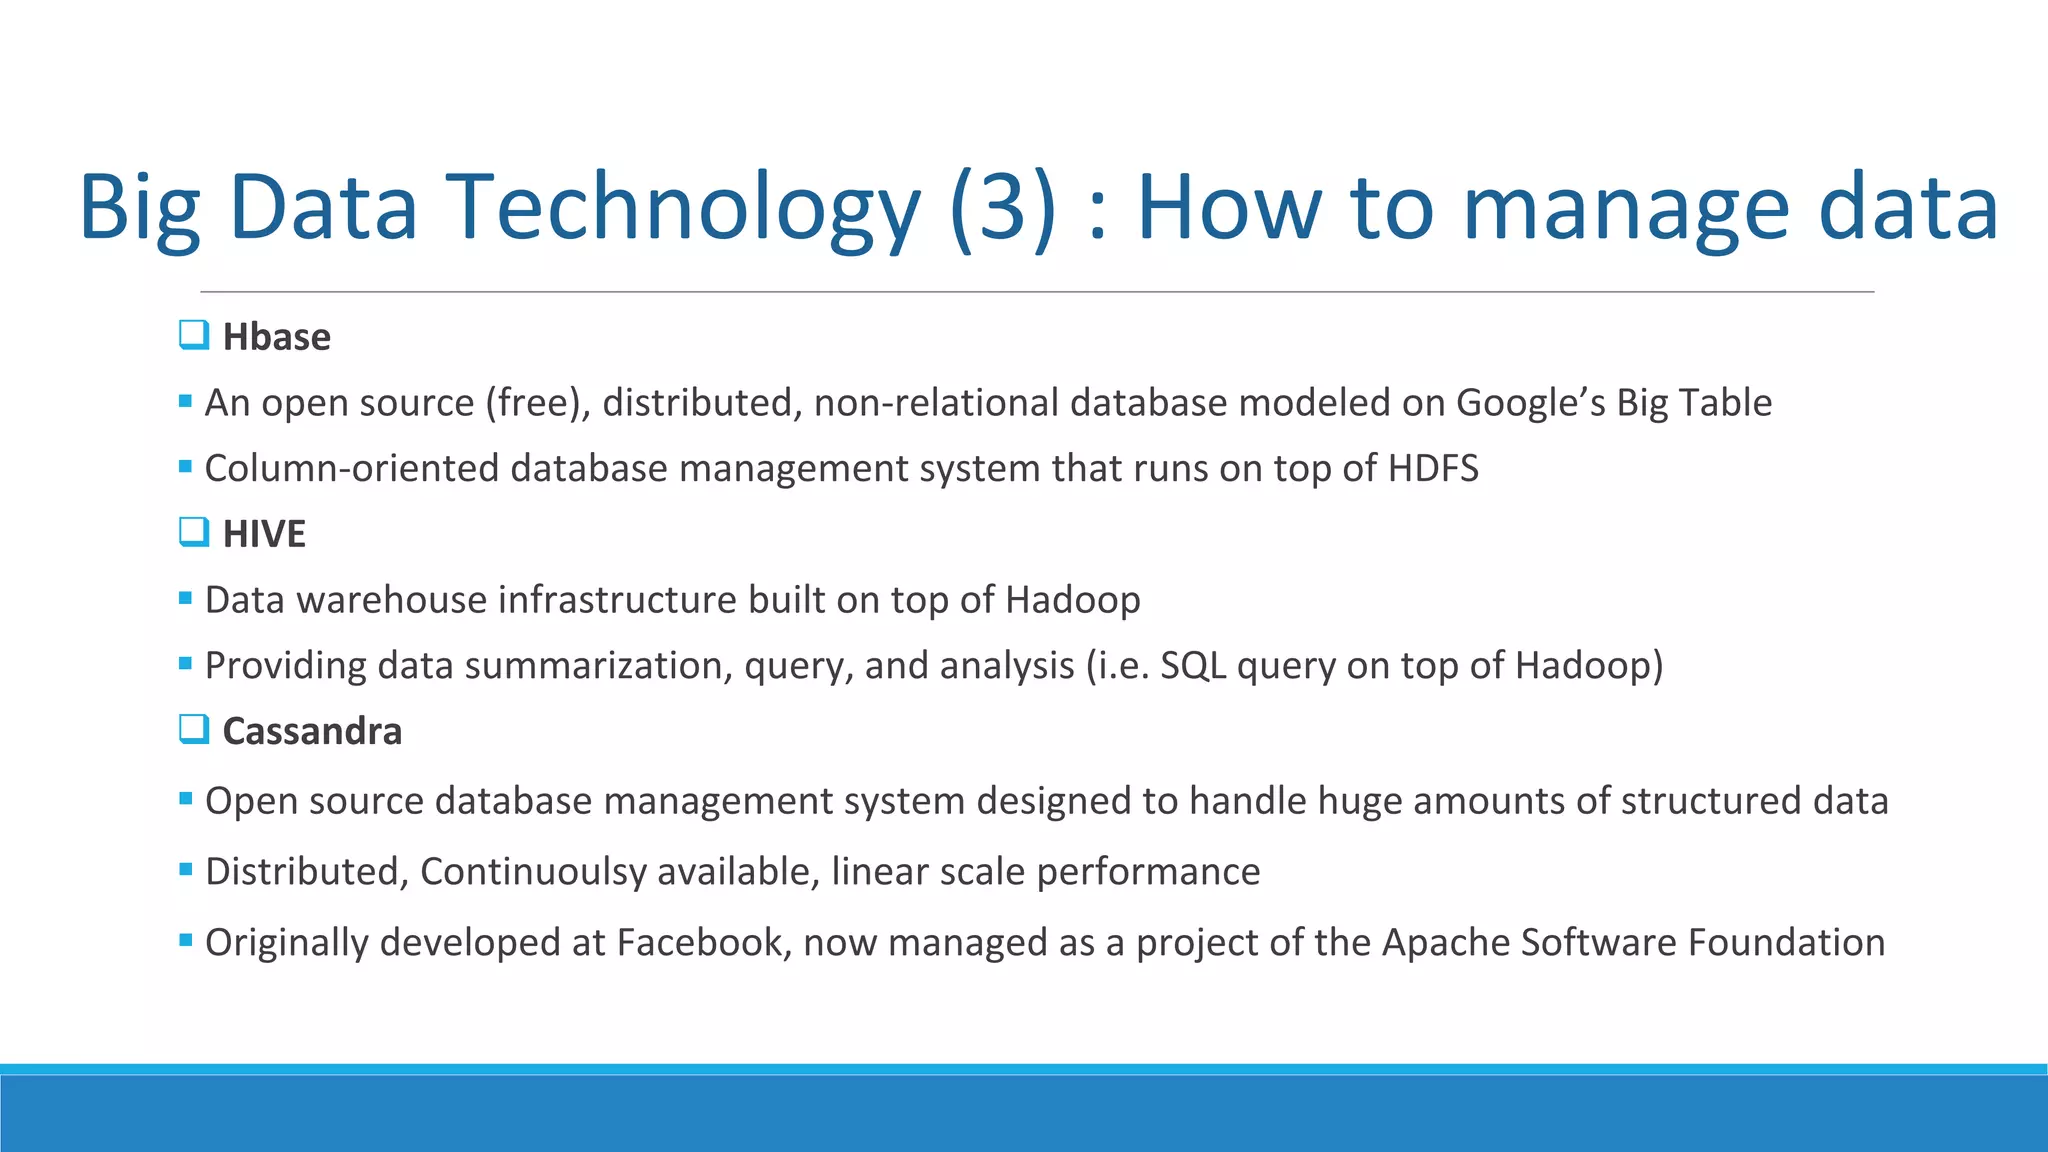
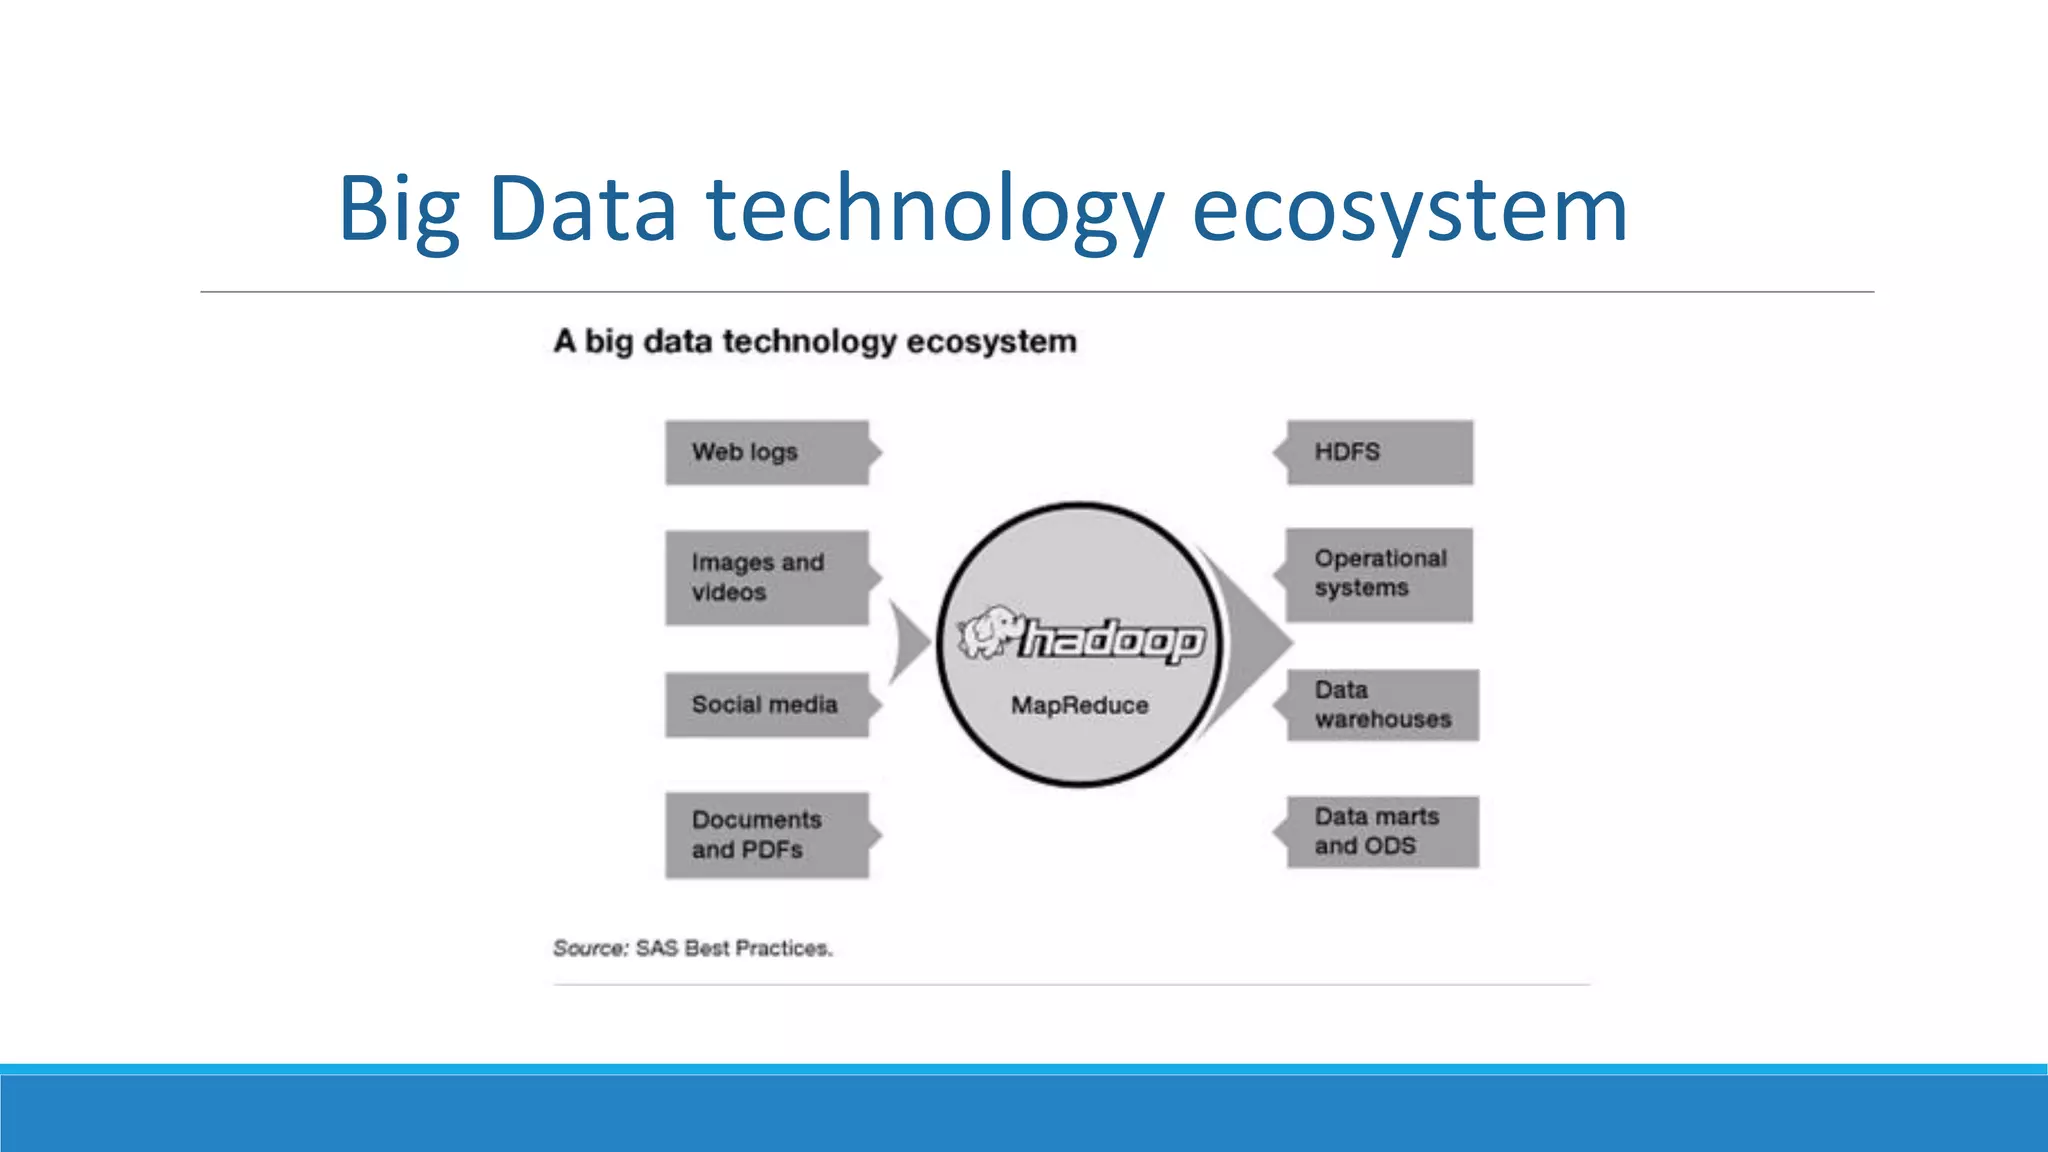
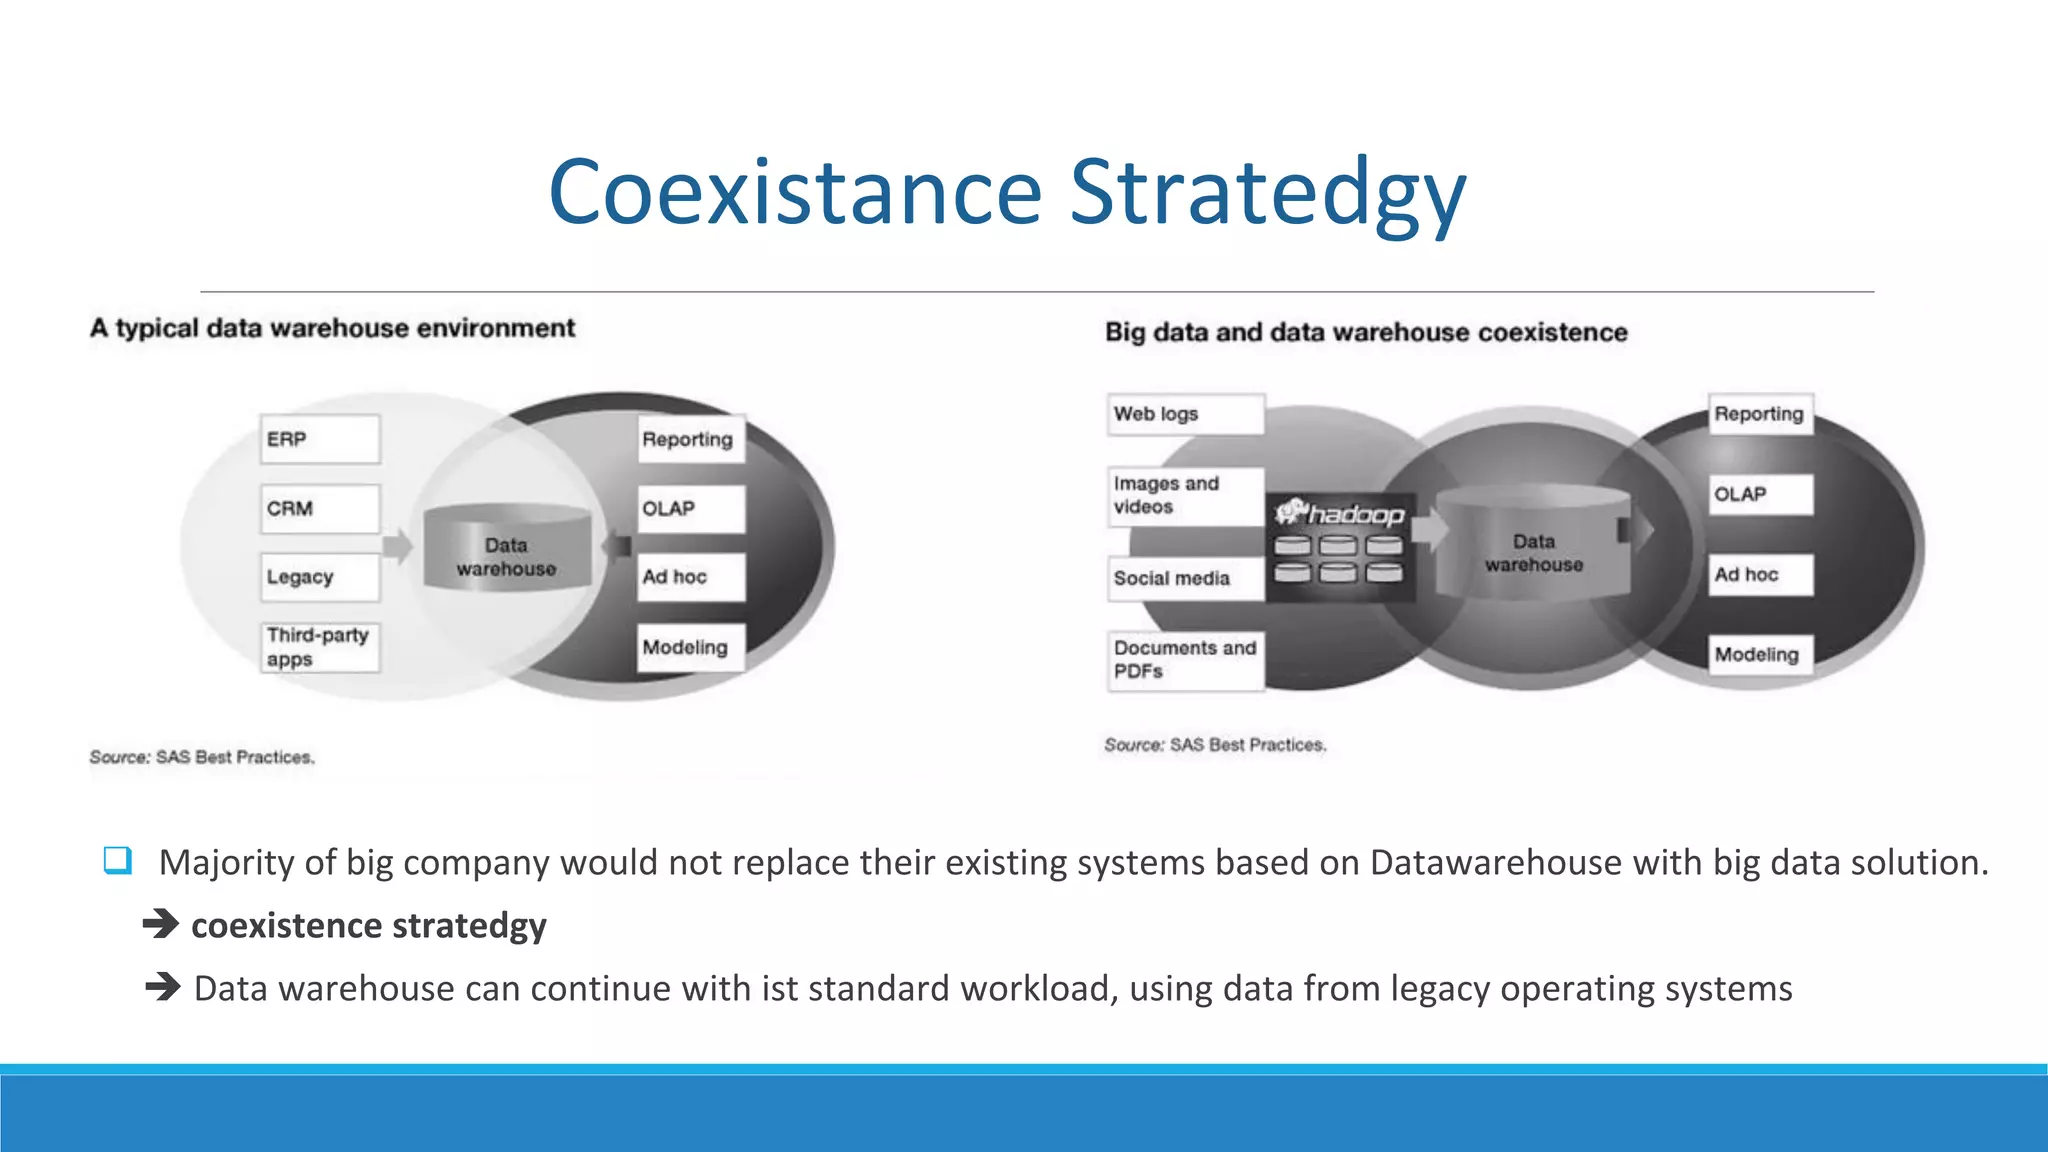
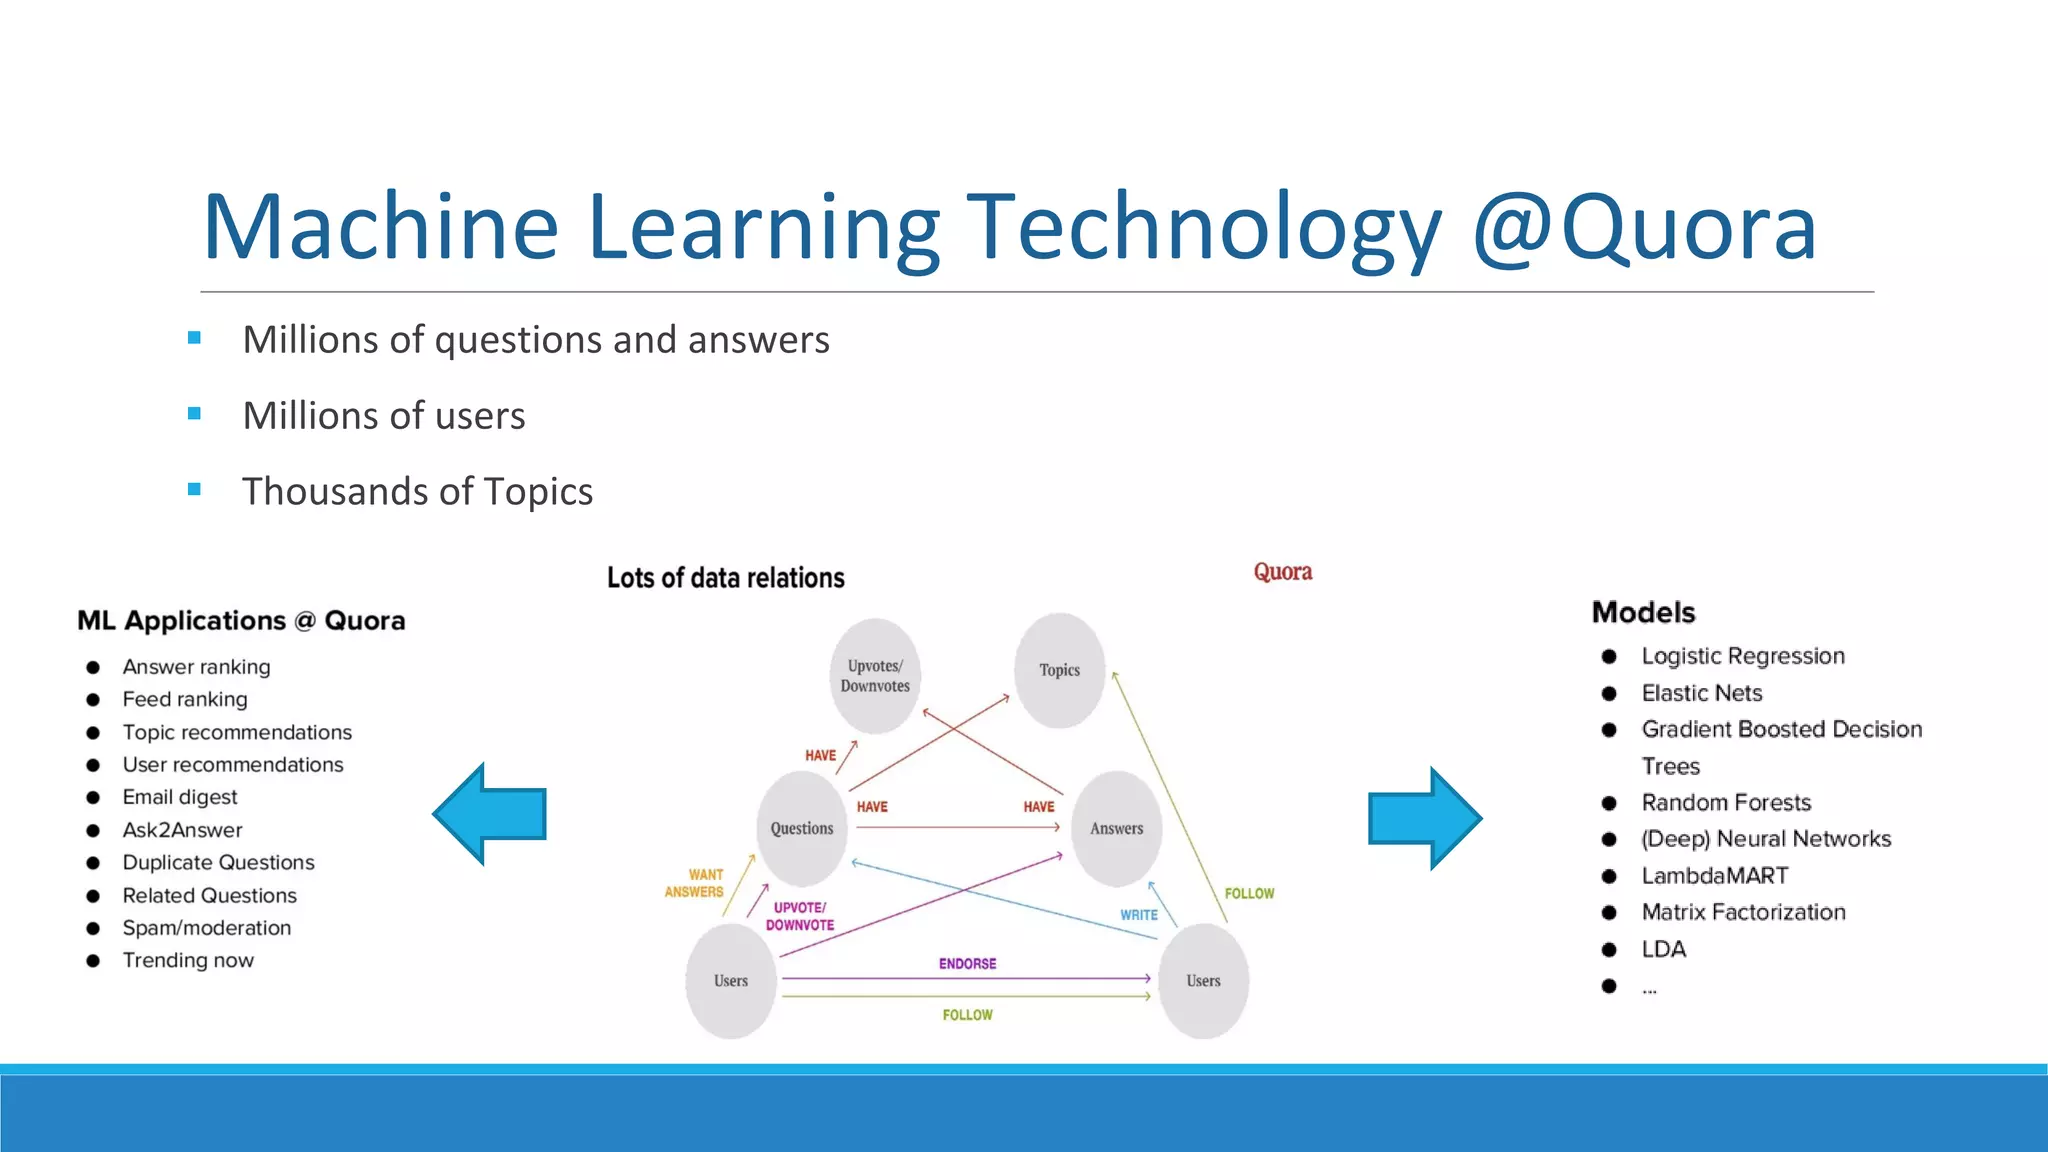
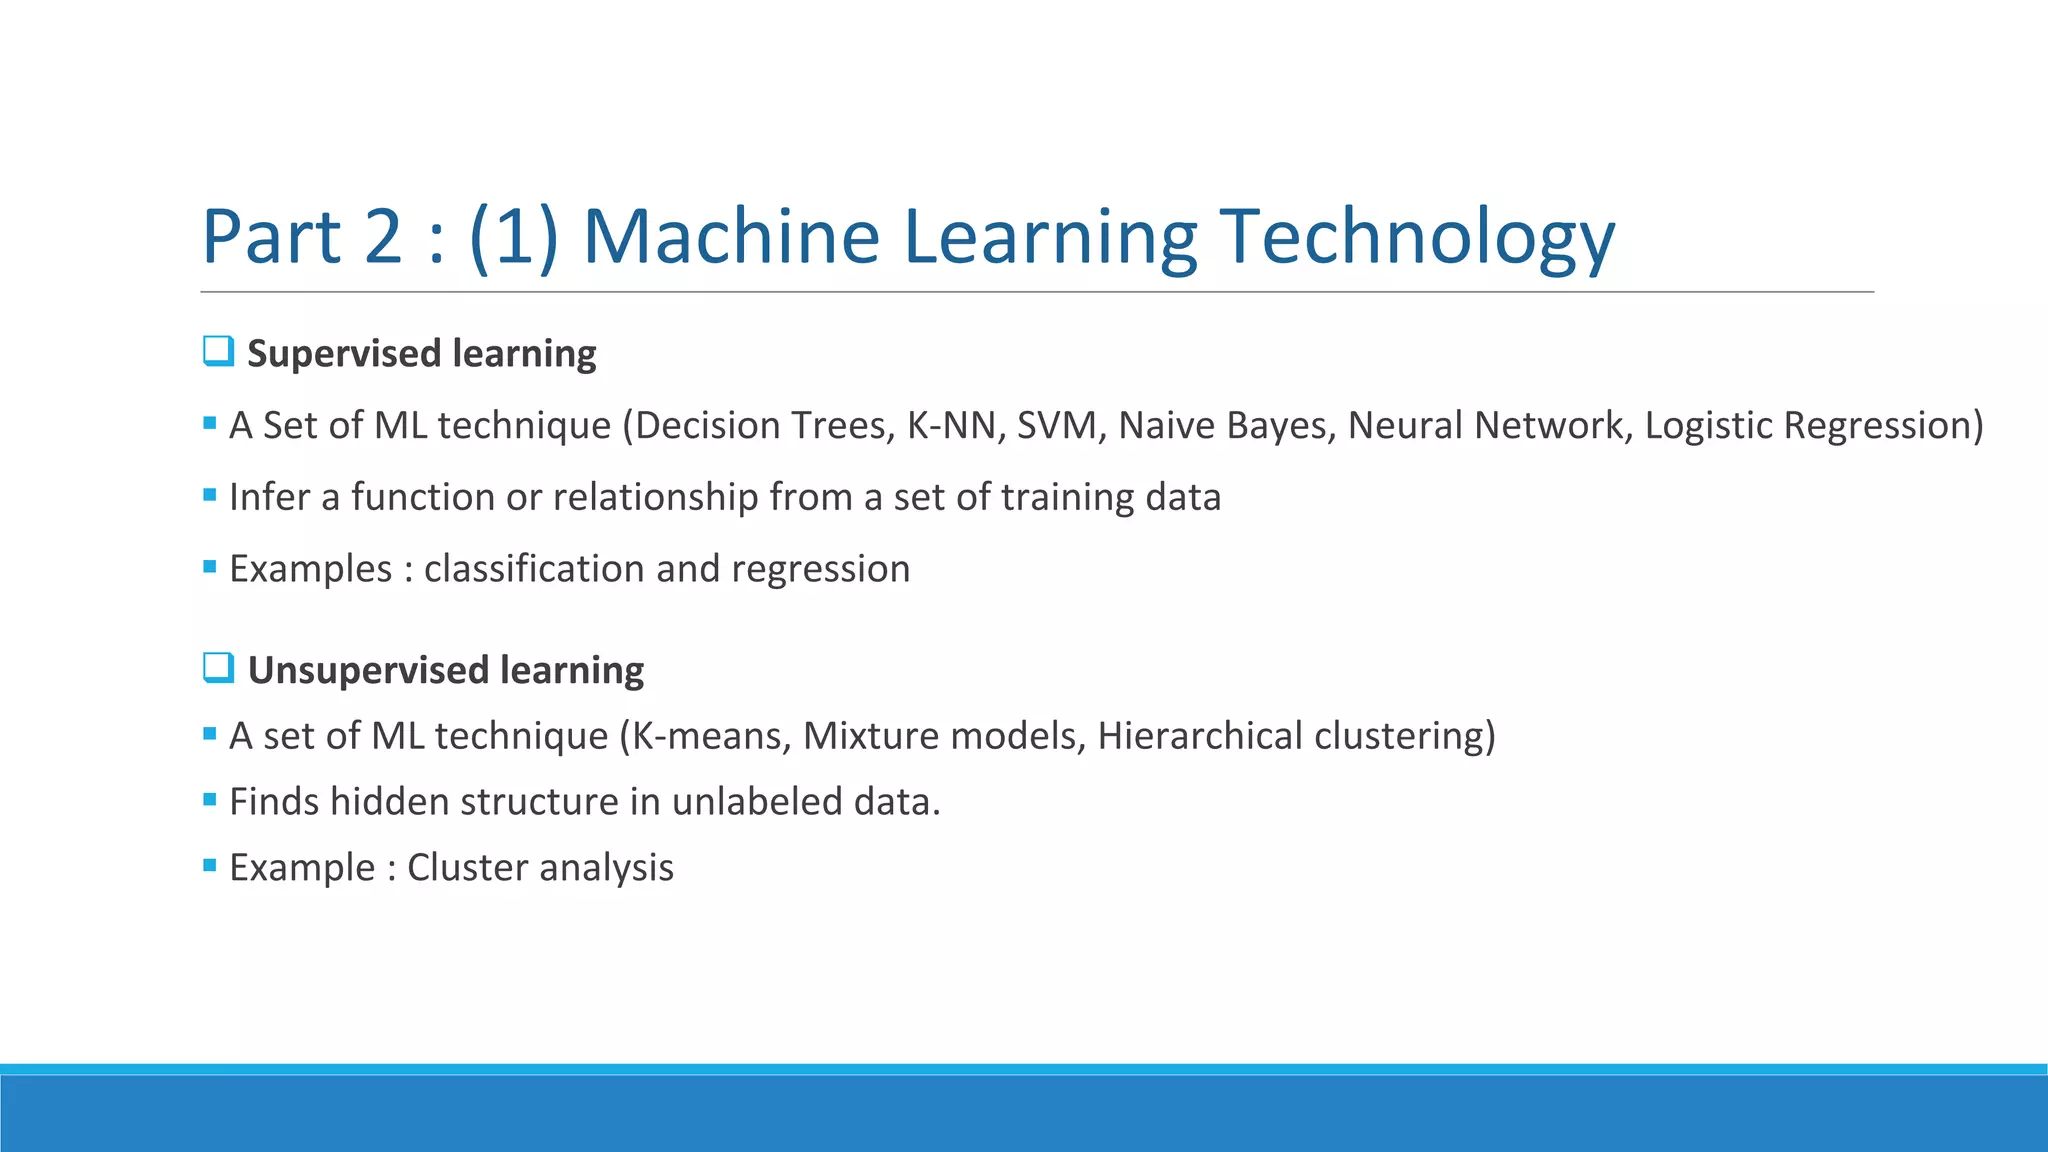
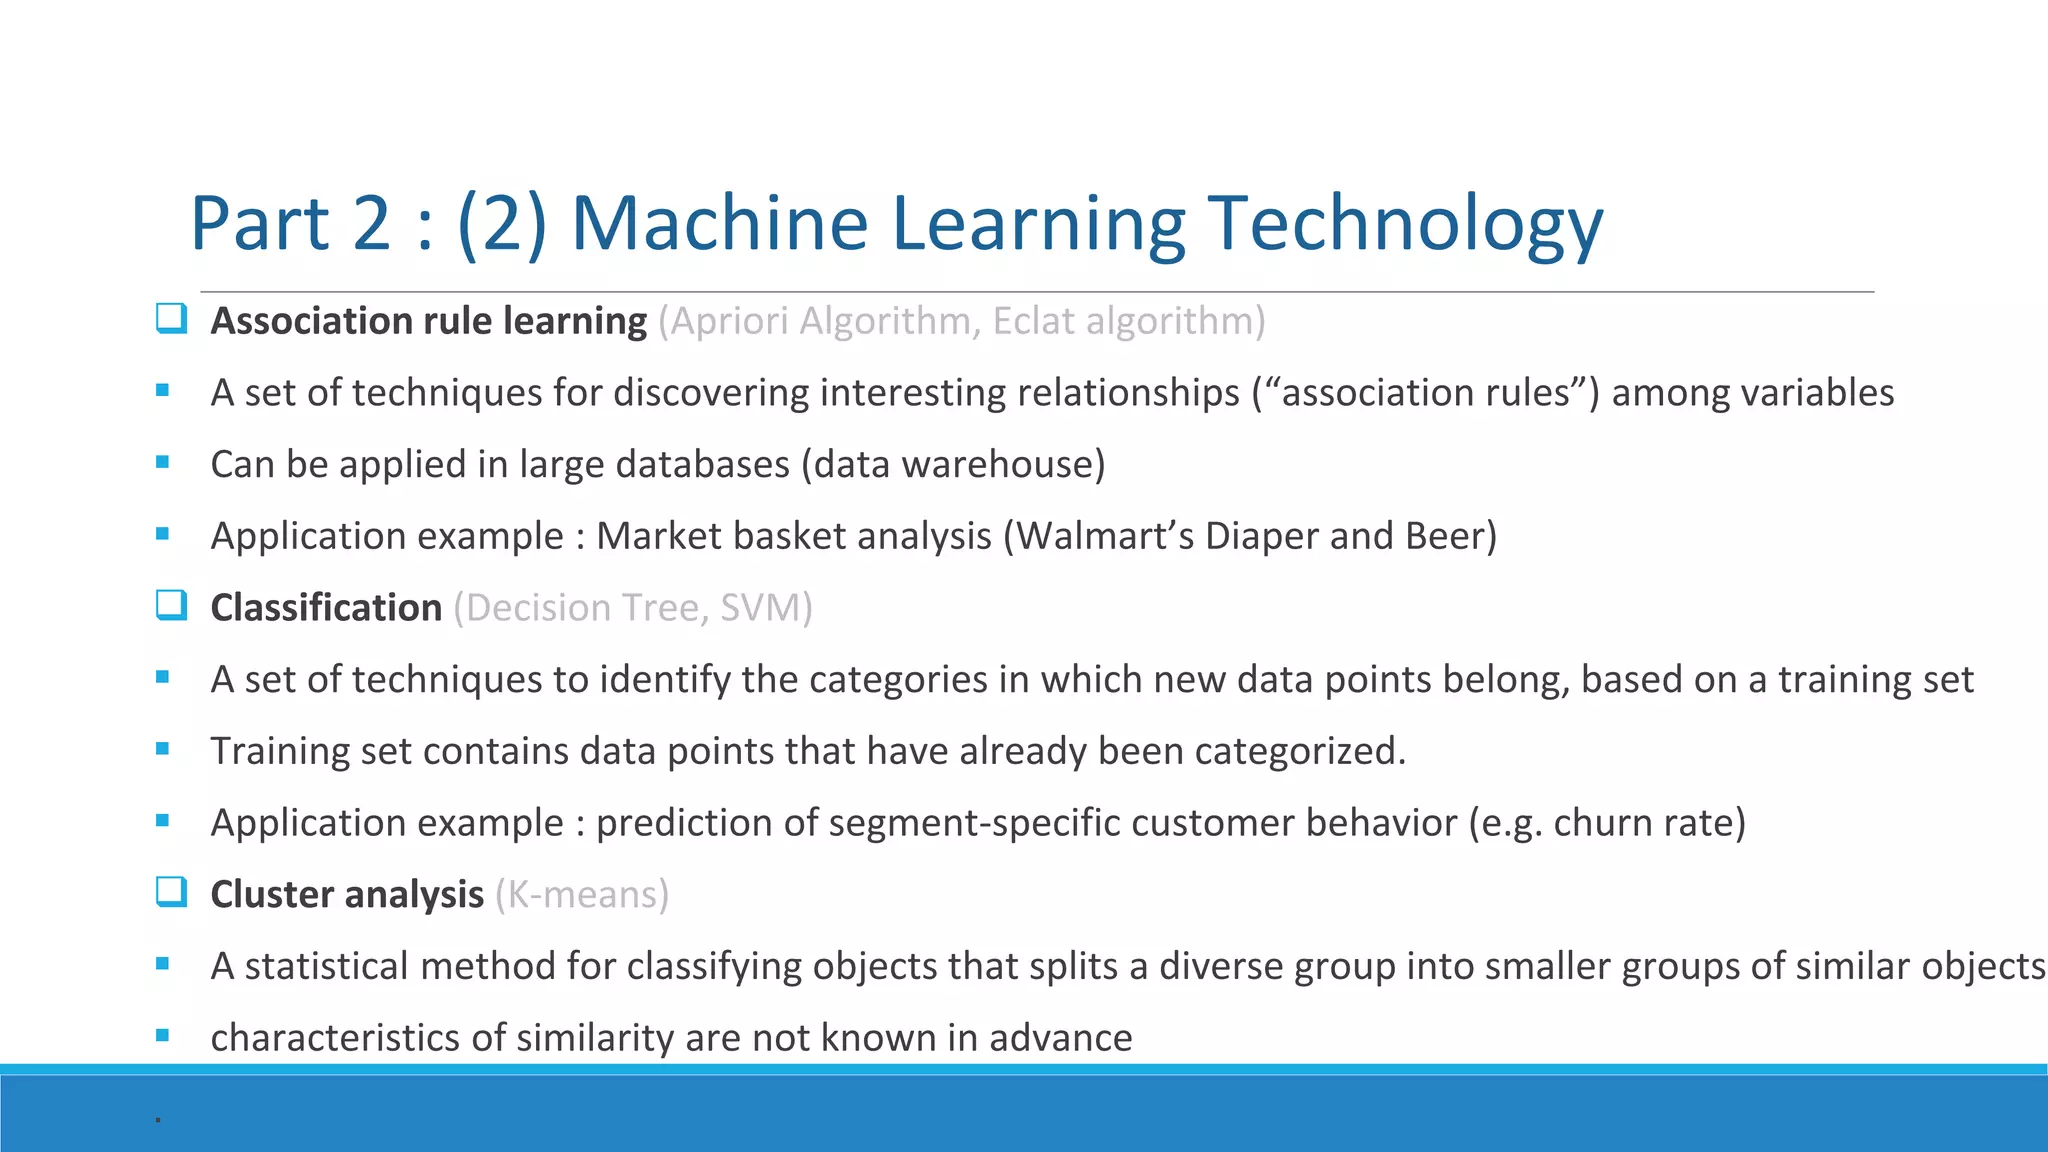
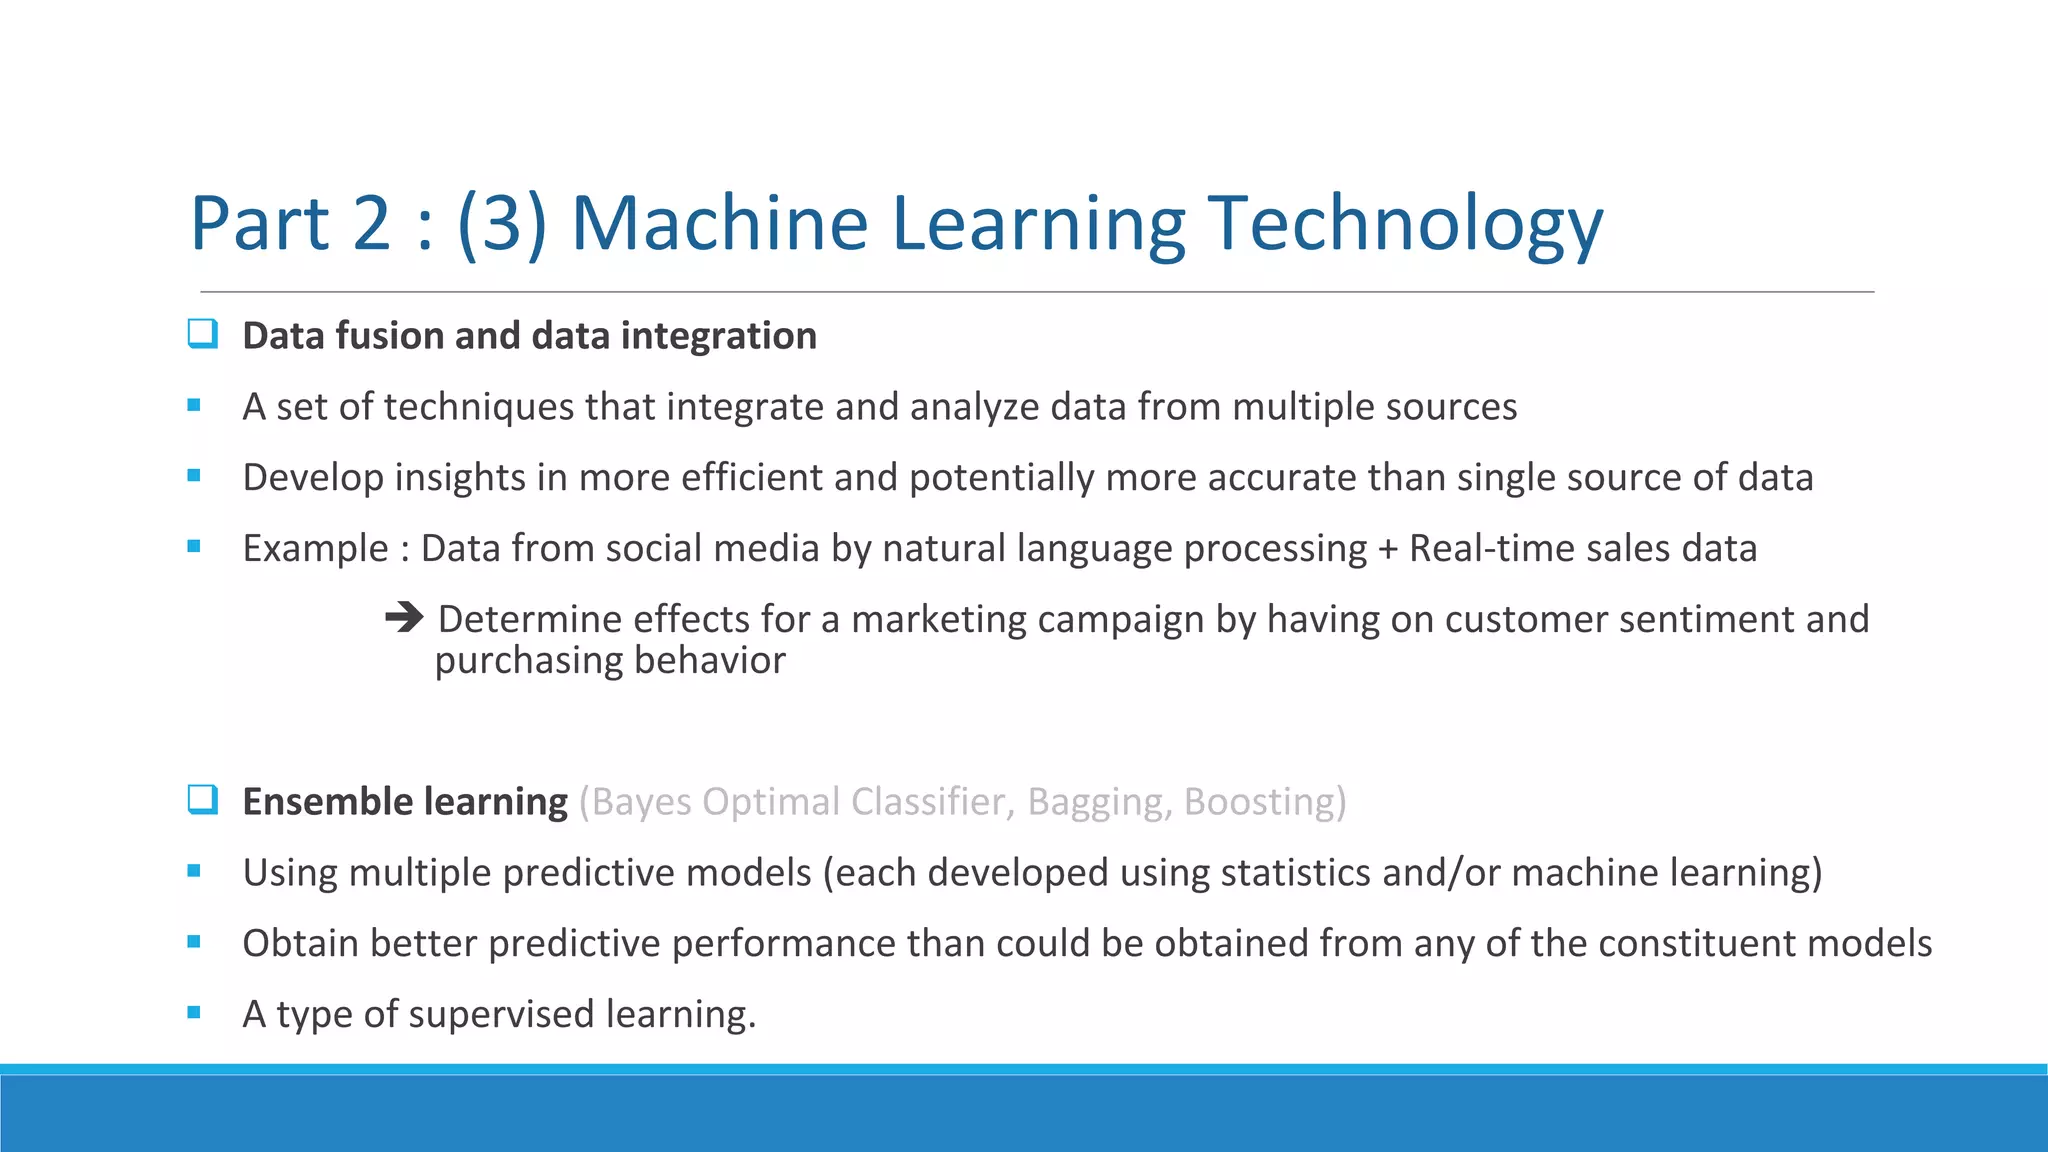
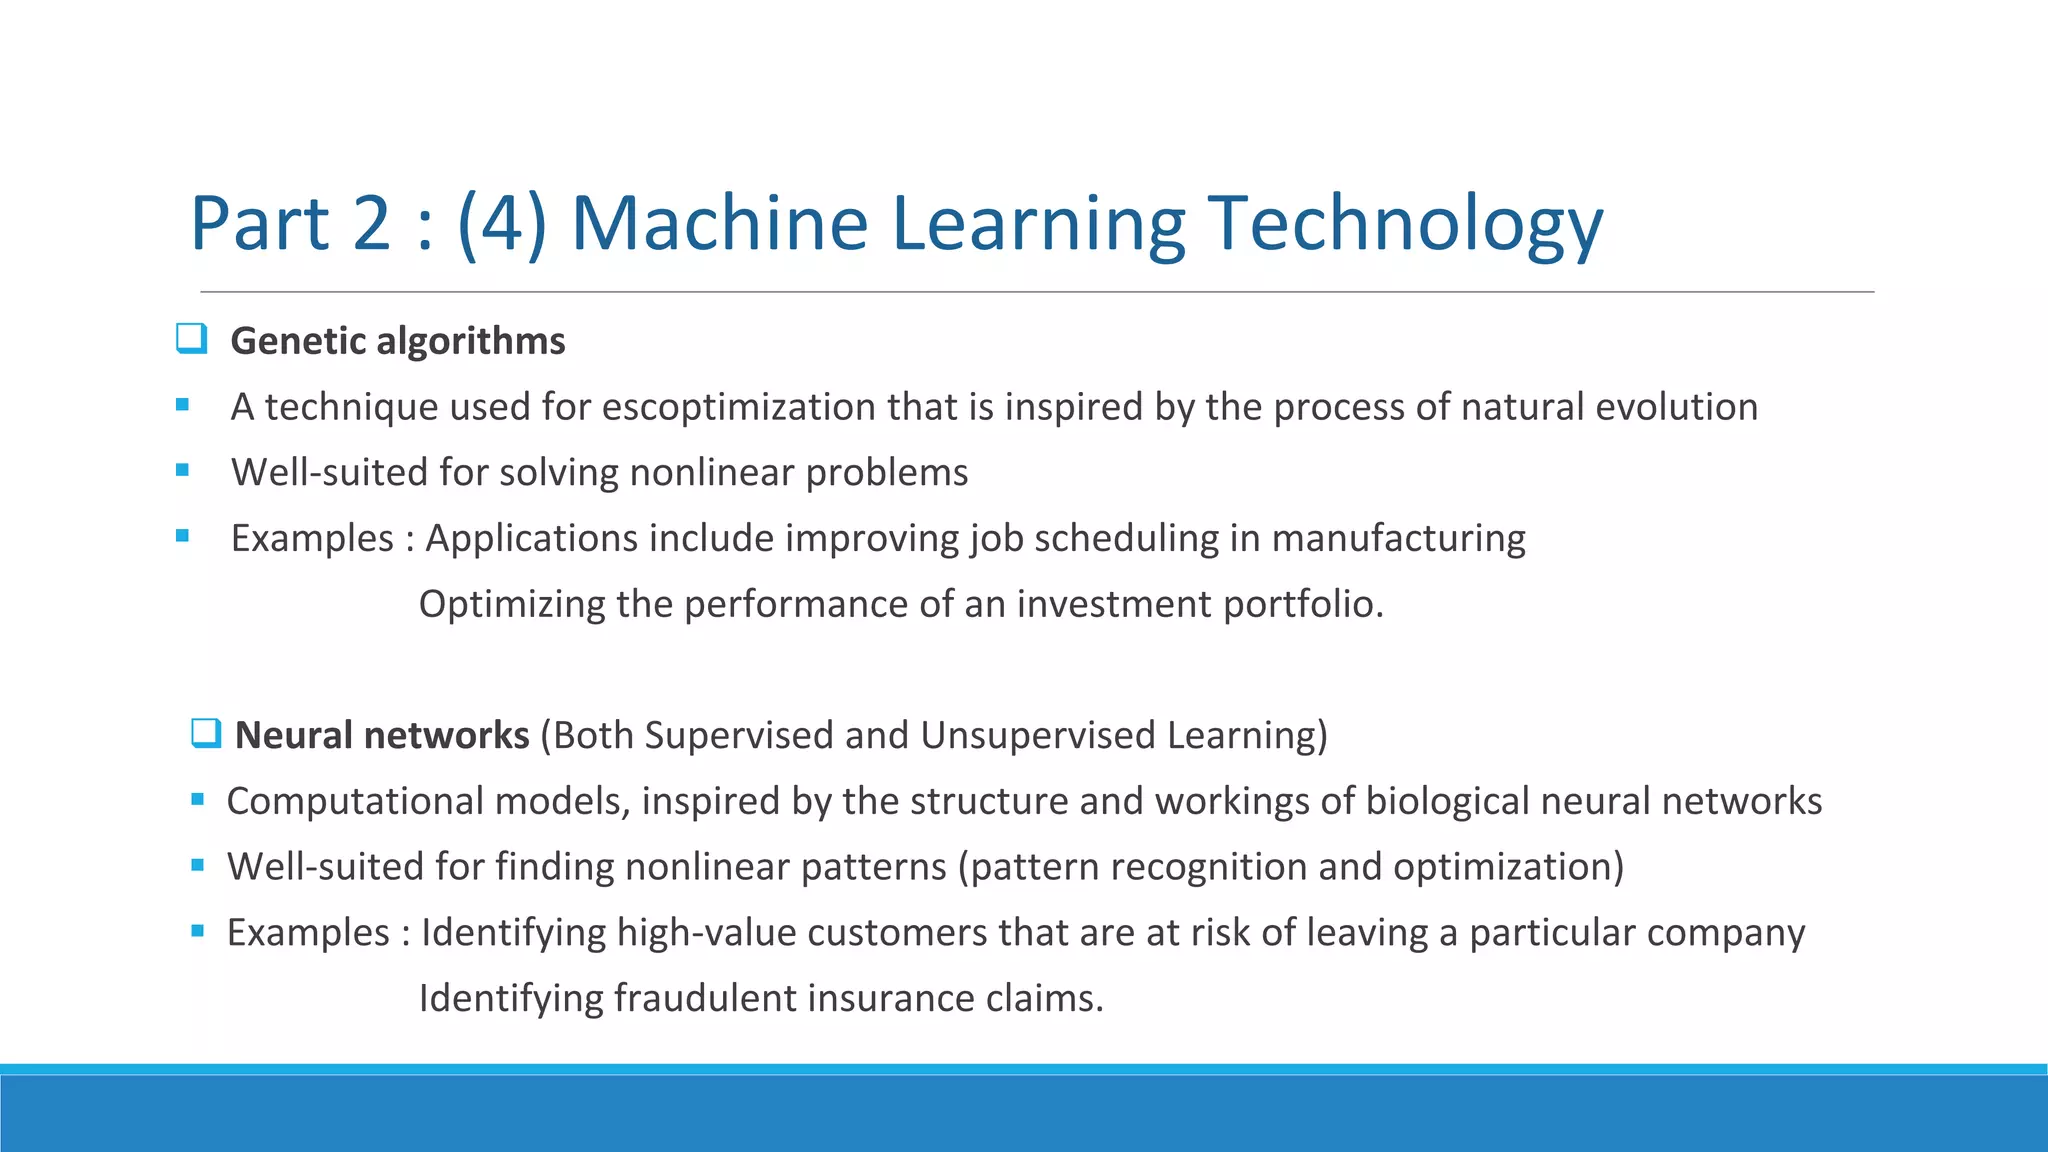
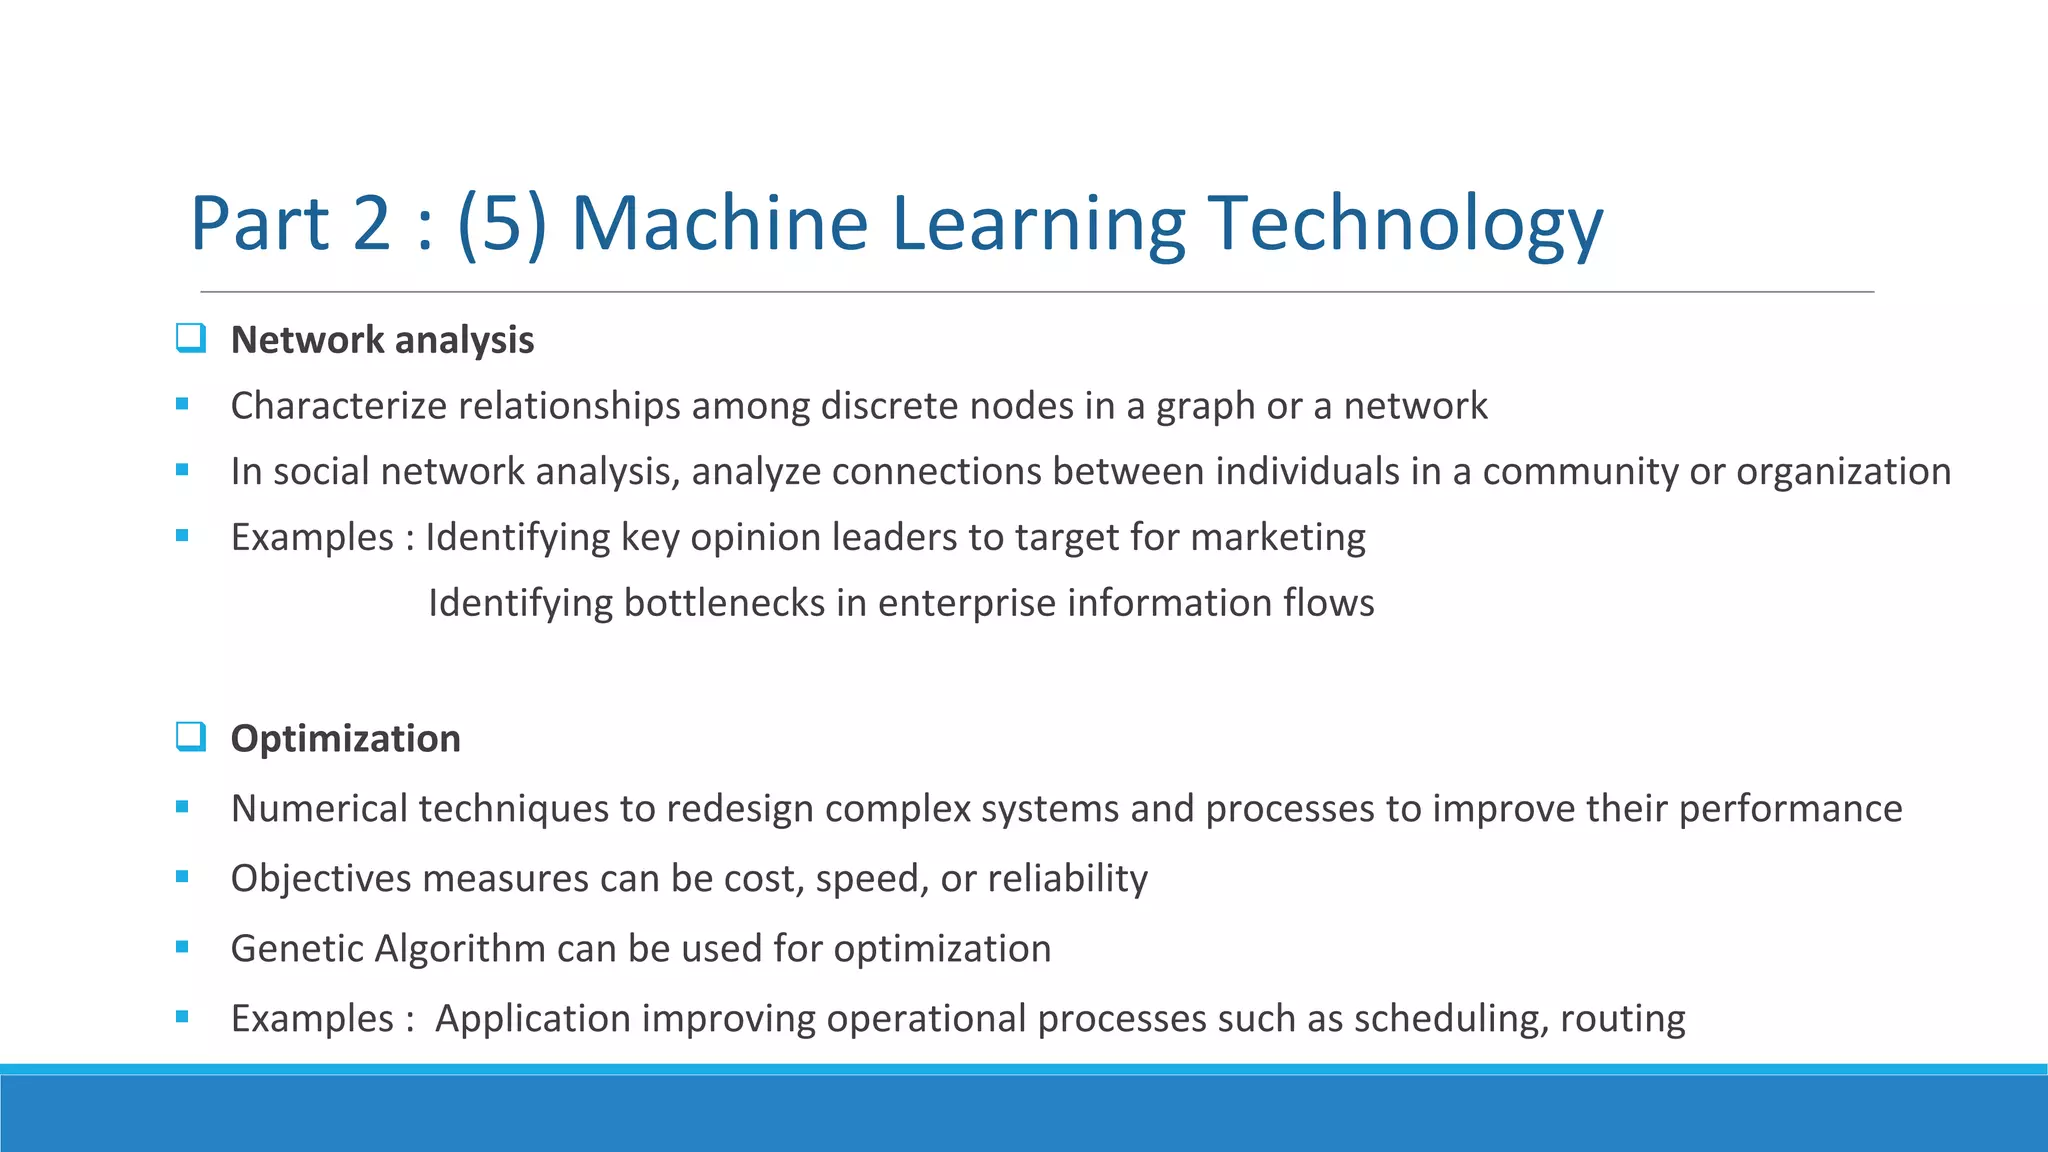
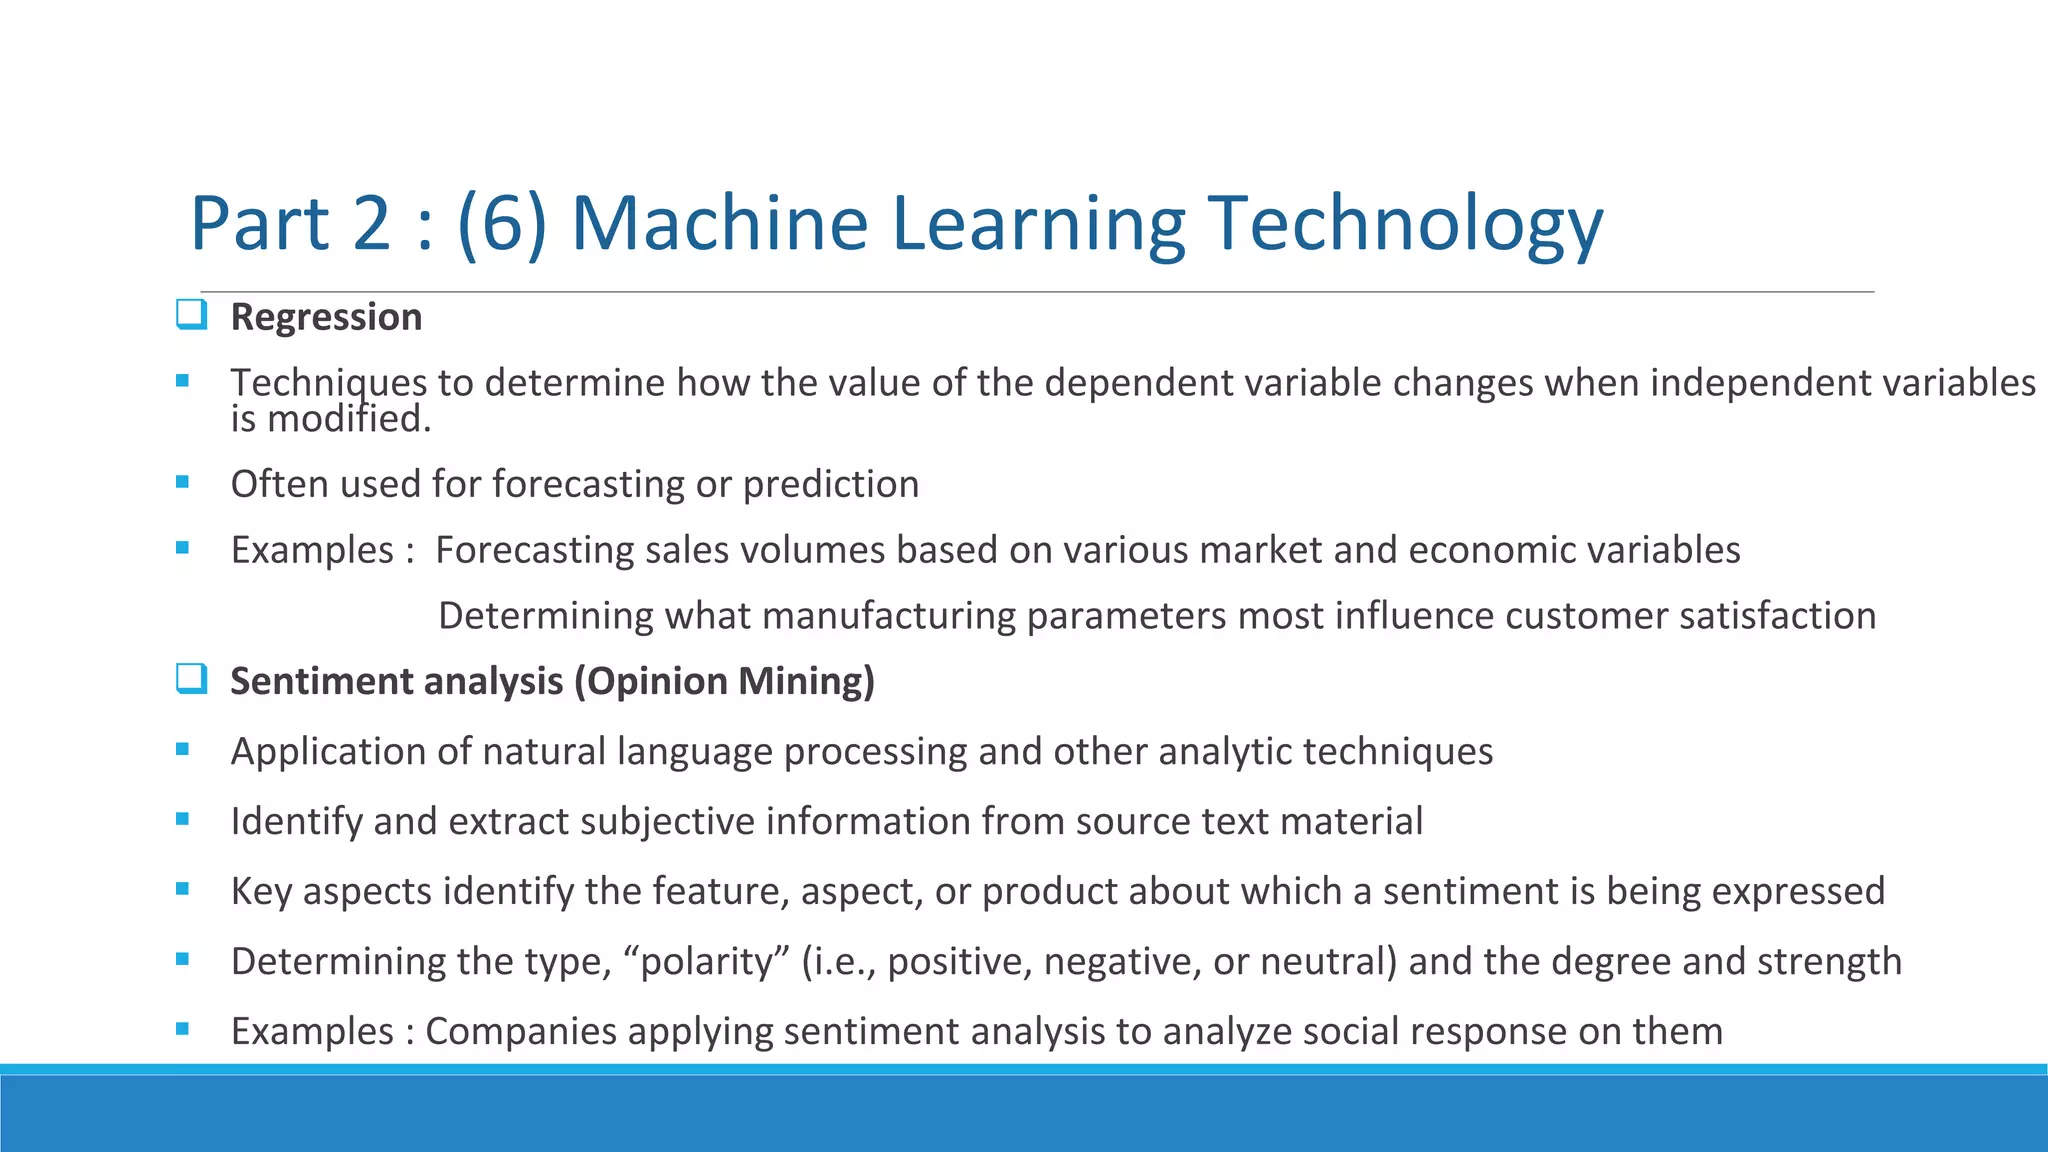
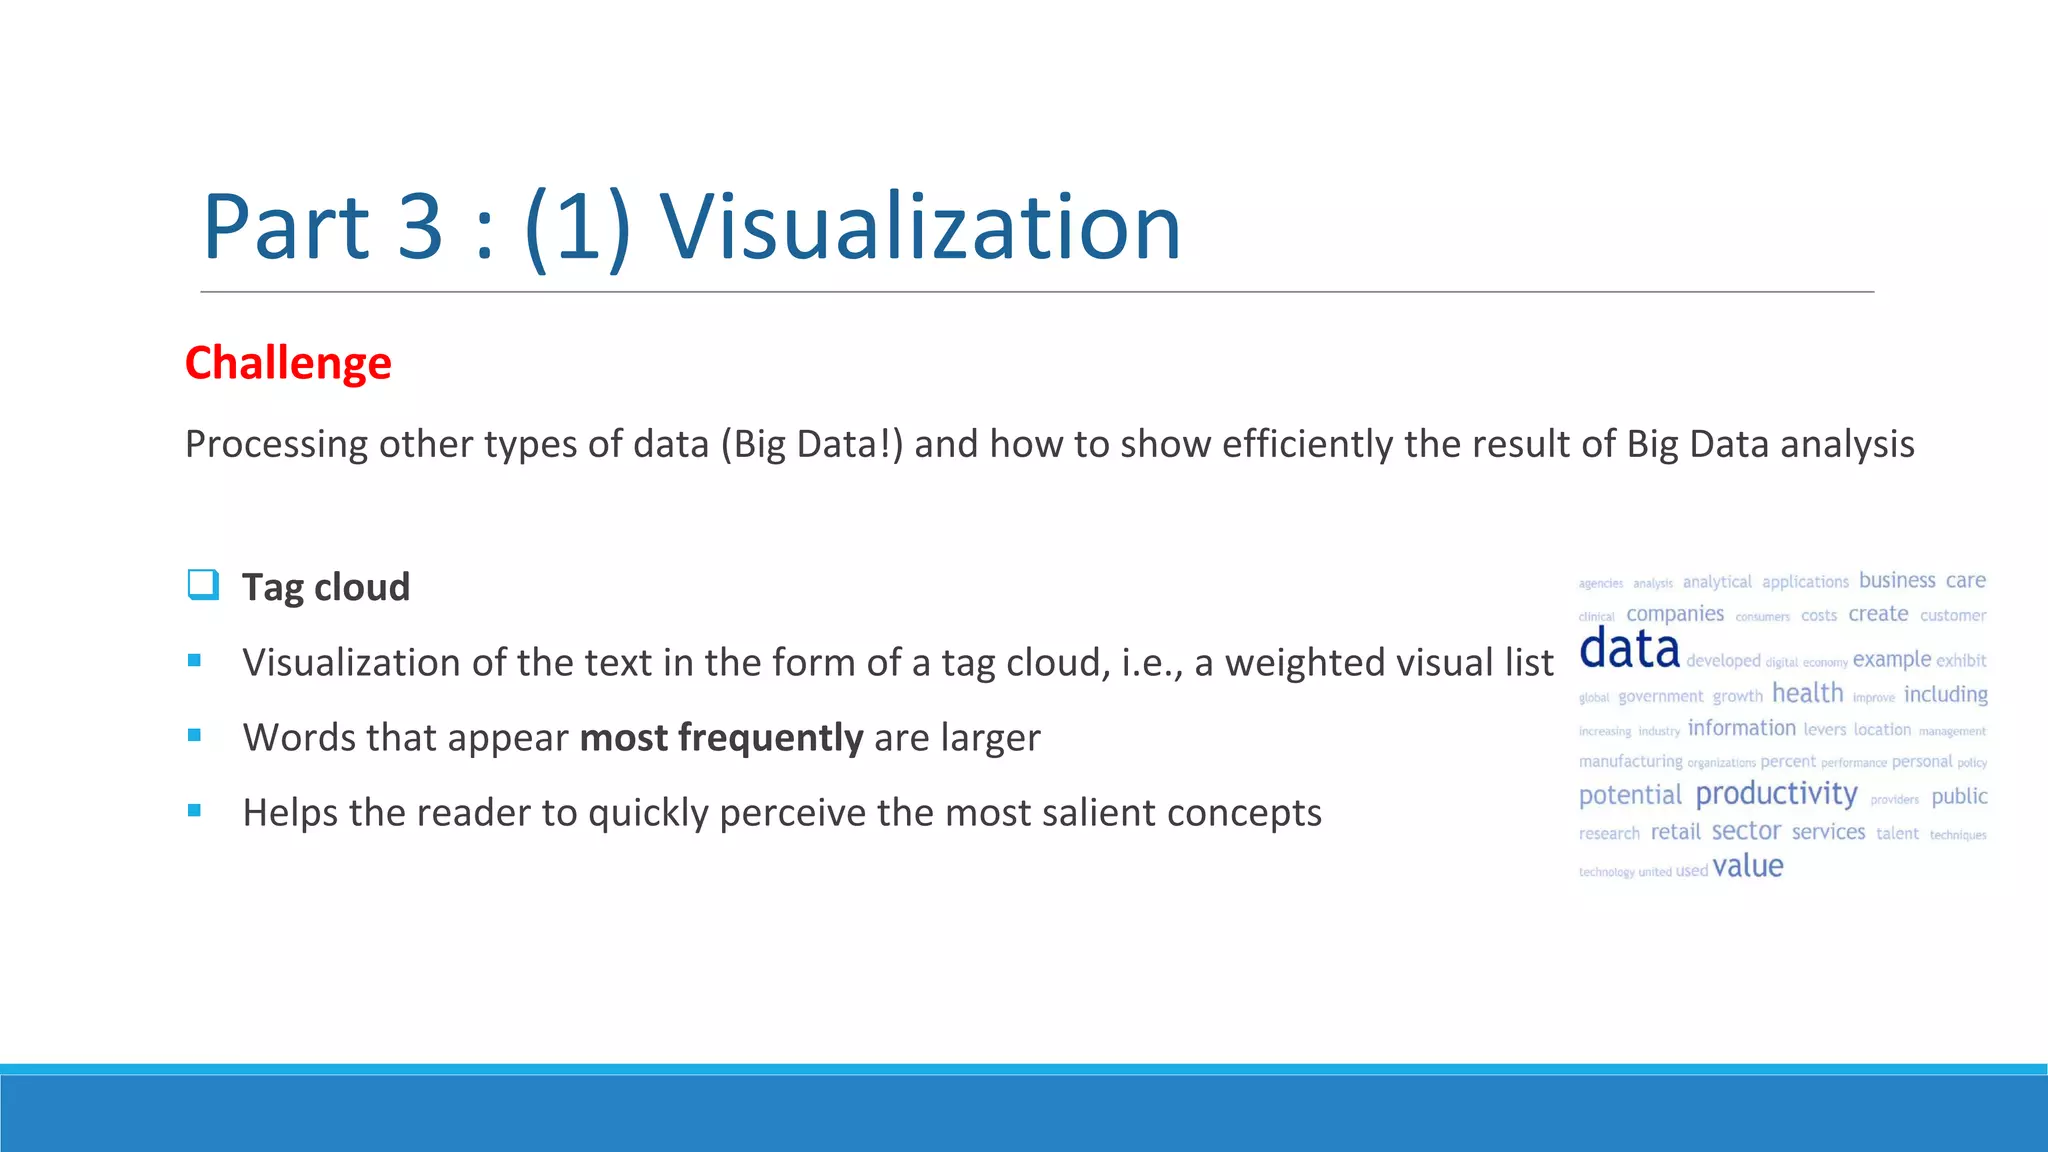
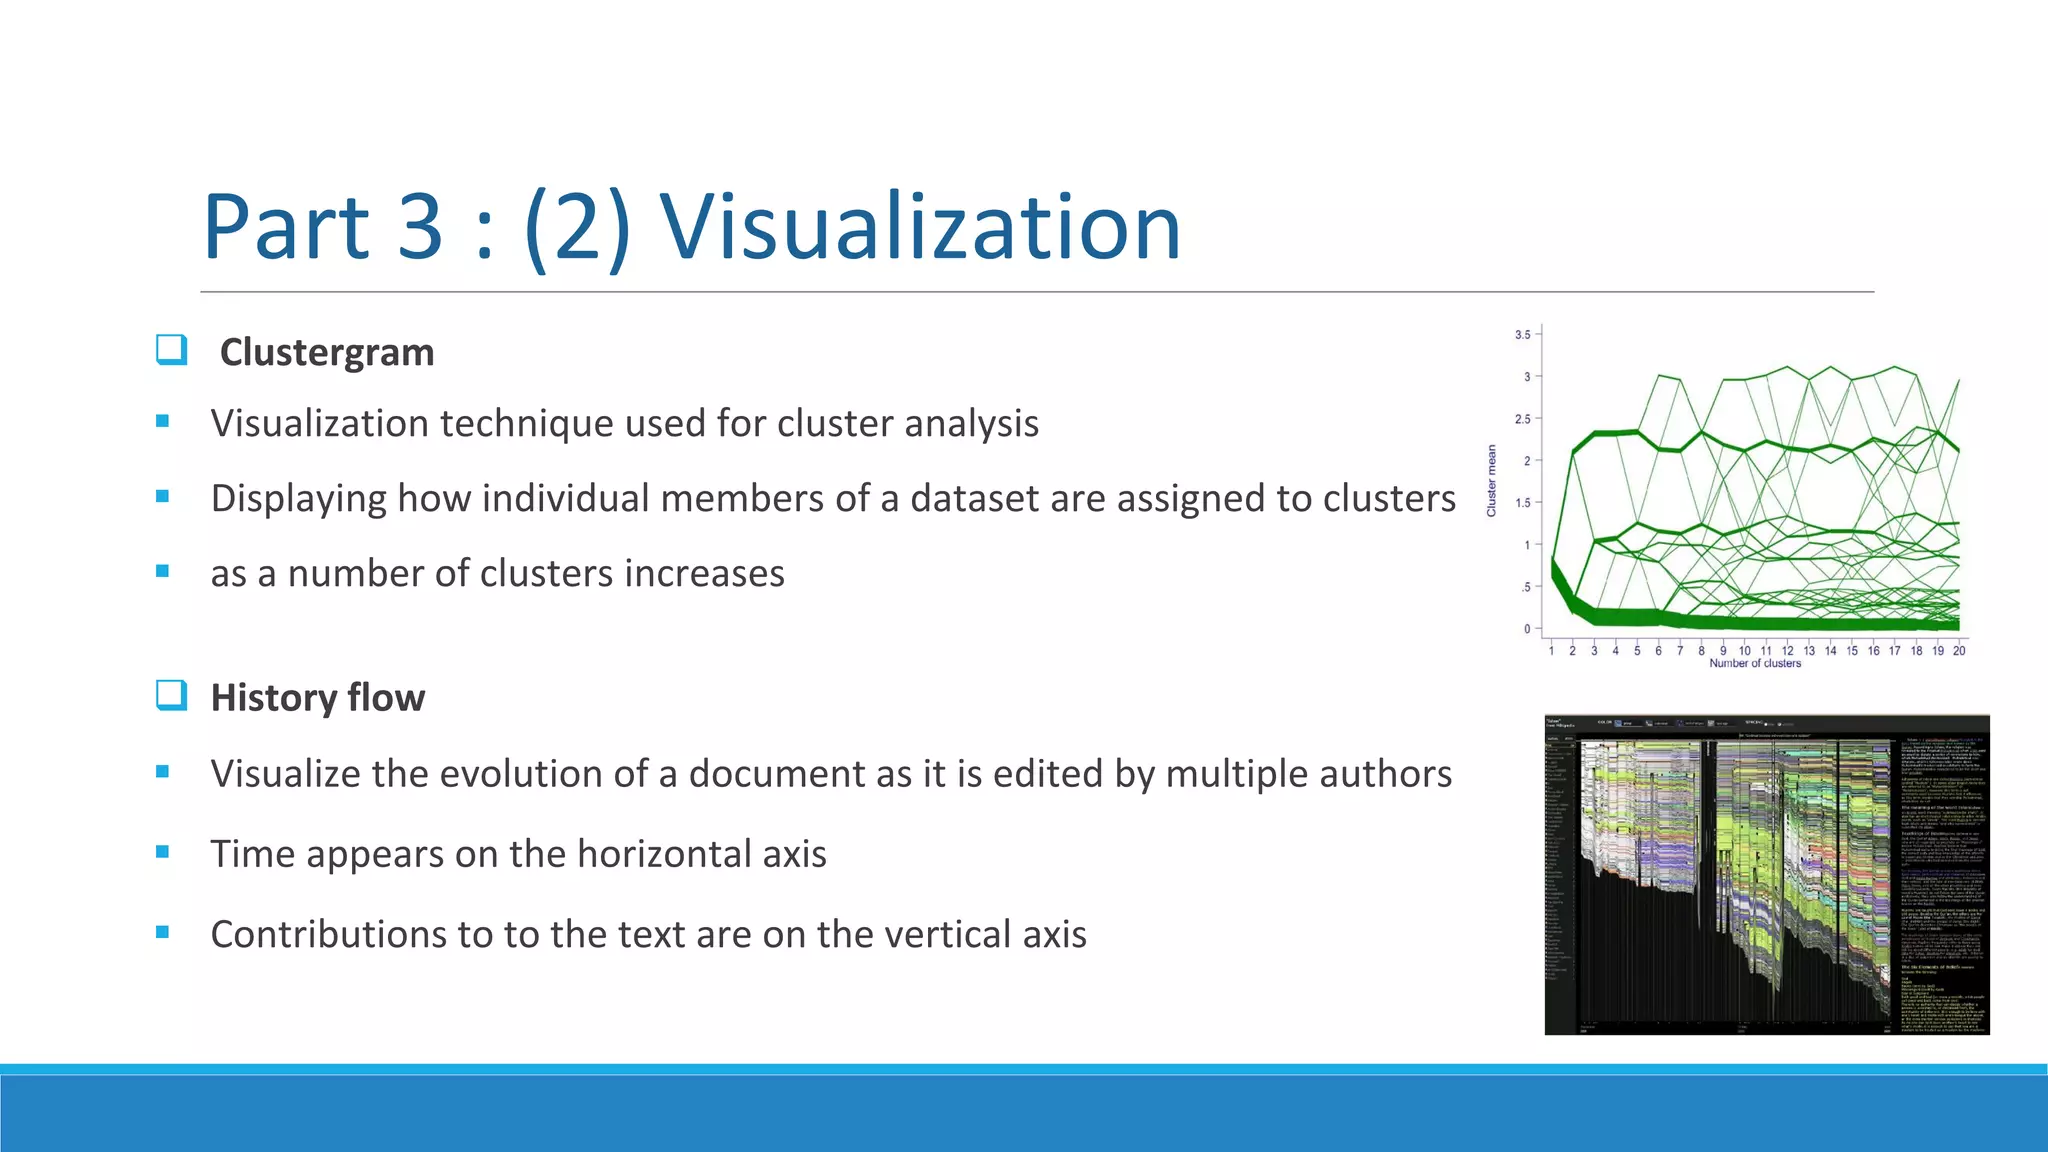
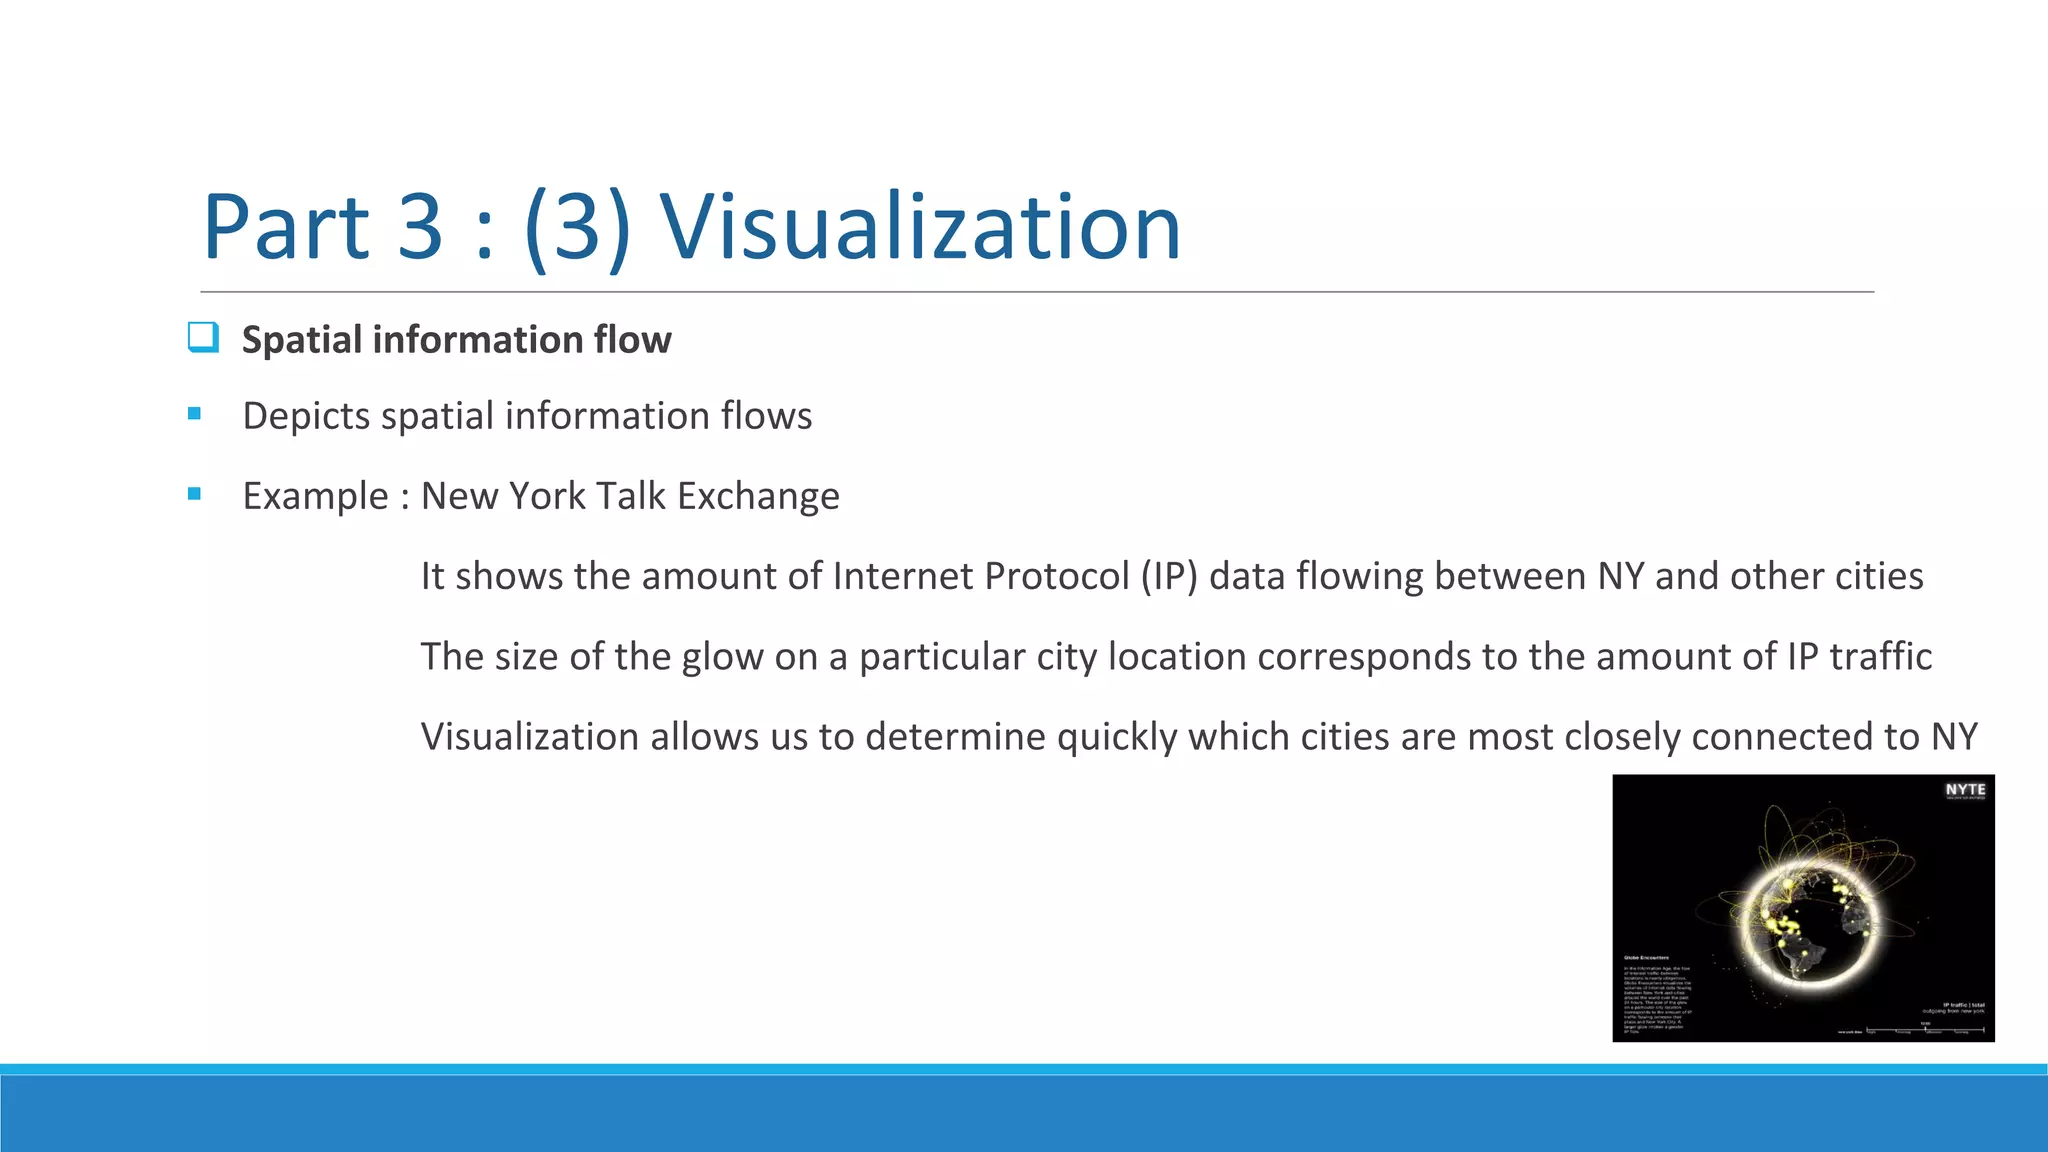
Data Science Technology Overview
SOOJUNG HONG (DEC 3. 2015)
Main Reference :
1. Big Data : The next frontier for innovation, competetion and productivity (Mckinsey Global Institute Report)
2. Big Data at Work (Harvard Business Review Press)
3. And many other Machine Learning literatures
Data Analytics Application Spectrum
Data
Model and Algorithm
Analytic Insight
(Big Data Technology)
(Machine Learning Technology)
(Visualization Technology)
Source : Analytics Driven Organization : Atos white paper
Source : Gartner, August 2014
Data Science Innovation Funnel
 Define the different part of innovation funnel
Part 1 : Data researech & Hypothesis building
 Data Science
Part 2 : ML solution building & implementation
 ML Engineering
Part 3 : A/B Testing (if Web app) and Analysis
 Data Science
Source : http://www.slideshare.net/xamat/10-more-lessons-learned-from-building-machine-learning-systems
Data Analytics Applications
Right Technology
Each analytics application typically differs in data inputs
 Technologies required for processing can vary significantly
Storing and dynamically Analysing
Vast amount of unstructured data
Web and Social Media
Capture and Analysis
High Volume & Velocity
Telecommunication network signals
or
IT infrastructure systems logs
Task
Data Type
Source
Example A Example B
Part 1 : Big Data Technology
1. Data Source
 Multiple source : image, sound, context
 Internal data sources (financial performance data, ERP, PLM, CRM, GPS data etc.)
 External data sources (like social media, video, voice and plain text, biz-sector studies)
(ex) Data Example : Stream processing. Large real-time streams of event data for algorithmic trading in financial services,
RFID event processing applications, fraud detection, process monitoring, Location-based services in telco
2. Scalability
 Scale up
 Scale out
* 150 Exabyte of data in Healthcare (1 Exabyte =1,152,921,504,606,846,976 bytes)
* New York Stock Exchange capture 1 TB of trade information during each trading session
 BigTable
 Proprietary distributed database system built on the Google File System (GFS)
 Part of the inspiration for Hadoop
 Google Cloud Bigtable : public version of BigTable (May, 2015)
 Hadoop (MapReduce implementation)
 Open source framework for distributed storage and processing of large set of data across multiple computers
 Commercial vendors Hadoop (Cloudera Hadoop, Hortonworks Hadoop, EMC Hadoop, Microsoft Hadoop)
 Cloud
 public, hybrid and private cloud
 S3 (Amazon Simple Storage Space), Microsoft Azure Storage
Big Data Technology (1) : How to store data
Big Data Technology (2) : How to process data
 In-memory distributed computing environments
 Store, distribute and compute large amounts of data
 Spark, H2O or SAP Hana
 Data warehouse
 Specialized database optimized for reporting, often used for storing large amounts of structured data.
 Data is uploaded using ETL (extract, transform, and load), often generated using BI tools.
 Data mart
 Subset of a data warehouse, used to provide data to users usually through business intelligence tools.
 Dynamo. Proprietary distributed data storage system developed by Amazon.
Big Data Technology (3) : How to manage data
 Hbase
 An open source (free), distributed, non-relational database modeled on Google’s Big Table
 Column-oriented database management system that runs on top of HDFS
 HIVE
 Data warehouse infrastructure built on top of Hadoop
 Providing data summarization, query, and analysis (i.e. SQL query on top of Hadoop)
 Cassandra
 Open source database management system designed to handle huge amounts of structured data
 Distributed, Continuoulsy available, linear scale performance
 Originally developed at Facebook, now managed as a project of the Apache Software Foundation
Hadoop
MapReduce Example
Big Data technology ecosystem
Coexistance Stratedgy
 Majority of big company would not replace their existing systems based on Datawarehouse with big data solution.
 coexistence stratedgy
 Data warehouse can continue with ist standard workload, using data from legacy operating systems
Big Data Technology : Data Format
Non-Relational database (NoSQL Database)
 In contrast to relational database (which based on Table, Record, Column, Row)
 A database that does not store data in tables (rows and columns)
 Semi-structured data (NoSQL)
 Data do not conform to fixed fields but contain tags and other markers to separate data elements
 CSV, XML, HTML-tagged text and JSON documents are semi structured documents
 Unstructured data
 Data do not conform to fixed fields
 Free-form text (e.g., books, articles, body of e-mail messages)
 Untagged audio, image and video data
Part 2 : Machine Learning Technology
Algorithms : TECHNIQUES FOR ANALYZING BIG DATA
 All of the techniques we list here can be applied to Big Data
 In general, larger and more diverse datasets can be used to generate more numerous and insightful
results than smaller, less diverse ones
Lessons Learned : More data beats a clever algorithm!
- ‘A Few Useful Things to Know about Machine Learning’ by P. Domingos
Machine Learning Technology @Quora
 Millions of questions and answers
 Millions of users
 Thousands of Topics
Part 2 : (1) Machine Learning Technology
 Supervised learning
 A Set of ML technique (Decision Trees, K-NN, SVM, Naive Bayes, Neural Network, Logistic Regression)
 Infer a function or relationship from a set of training data
 Examples : classification and regression
 Unsupervised learning
 A set of ML technique (K-means, Mixture models, Hierarchical clustering)
 Finds hidden structure in unlabeled data.
 Example : Cluster analysis
 Association rule learning (Apriori Algorithm, Eclat algorithm)
 A set of techniques for discovering interesting relationships (“association rules”) among variables
 Can be applied in large databases (data warehouse)
 Application example : Market basket analysis (Walmart’s Diaper and Beer)
 Classification (Decision Tree, SVM)
 A set of techniques to identify the categories in which new data points belong, based on a training set
 Training set contains data points that have already been categorized.
 Application example : prediction of segment-specific customer behavior (e.g. churn rate)
 Cluster analysis (K-means)
 A statistical method for classifying objects that splits a diverse group into smaller groups of similar objects
 characteristics of similarity are not known in advance
.
Part 2 : (2) Machine Learning Technology
 Data fusion and data integration
 A set of techniques that integrate and analyze data from multiple sources
 Develop insights in more efficient and potentially more accurate than single source of data
 Example : Data from social media by natural language processing + Real-time sales data
 Determine effects for a marketing campaign by having on customer sentiment and
purchasing behavior
 Ensemble learning (Bayes Optimal Classifier, Bagging, Boosting)
 Using multiple predictive models (each developed using statistics and/or machine learning)
 Obtain better predictive performance than could be obtained from any of the constituent models
 A type of supervised learning.
Part 2 : (3) Machine Learning Technology
 Genetic algorithms
 A technique used for escoptimization that is inspired by the process of natural evolution
 Well-suited for solving nonlinear problems
 Examples : Applications include improving job scheduling in manufacturing
Optimizing the performance of an investment portfolio.
 Neural networks (Both Supervised and Unsupervised Learning)
 Computational models, inspired by the structure and workings of biological neural networks
 Well-suited for finding nonlinear patterns (pattern recognition and optimization)
 Examples : Identifying high-value customers that are at risk of leaving a particular company
Identifying fraudulent insurance claims.
Part 2 : (4) Machine Learning Technology
 Network analysis
 Characterize relationships among discrete nodes in a graph or a network
 In social network analysis, analyze connections between individuals in a community or organization
 Examples : Identifying key opinion leaders to target for marketing
Identifying bottlenecks in enterprise information flows
 Optimization
 Numerical techniques to redesign complex systems and processes to improve their performance
 Objectives measures can be cost, speed, or reliability
 Genetic Algorithm can be used for optimization
 Examples : Application improving operational processes such as scheduling, routing
Part 2 : (5) Machine Learning Technology
 Regression
 Techniques to determine how the value of the dependent variable changes when independent variables
is modified.
 Often used for forecasting or prediction
 Examples : Forecasting sales volumes based on various market and economic variables
Determining what manufacturing parameters most influence customer satisfaction
 Sentiment analysis (Opinion Mining)
 Application of natural language processing and other analytic techniques
 Identify and extract subjective information from source text material
 Key aspects identify the feature, aspect, or product about which a sentiment is being expressed
 Determining the type, “polarity” (i.e., positive, negative, or neutral) and the degree and strength
 Examples : Companies applying sentiment analysis to analyze social response on them
Part 2 : (6) Machine Learning Technology
Example : Sentiment Classification Technique
 Spatial analysis (Multilayer Perceptron, Mixture of Experts, Support Vector Regression)
 Using location information
 Example : Manufacturing supply chain network performance analysis
 Simulation
 Modeling the behavior of complex systems used for forecasting, predicting and scenario planning
 Repeated random sampling, i.e., running thousands of simulations, each based on different assumptions
 Example : Assessing the likelihood of meeting financial targets given uncertainties
 Time series analysis (Mixture of Expert Model)
 Statistical and signal processing for analyzing sequences of data points (values) at successive times
 Extract meaningful characteristics from the data.
 Examples : Hourly value of a stock market
Predicting the number of people who will be diagnosed with an infectious disease.
Part 2 : (7) Machine Learning Technology
Options : Experimentation vs Production
 Good intermediate option
1. ML Researcher experiment on iPython Notebooks using Python tools (scikit-learn, Theano)
2. Implement the optimized version
3. Implement the abstraction layer on top of optimized implementation so they can be accessed
from regular experimentation tools
 Must be aware of in Production
1. Value of Mode = Value it brings to the product
2. Bridge gap between the production design and ML algorithm
Machine Learning Infrastructure
ML Programming language & Tools
 R
 R Studio
 Popular package : dplyr, plyr, data.table, stringr, zoo, ggvis, caret (for machine learning)
 Python
 iPython Notebook, Spyder
 Popular package : pandas, SciPy, NumPy, scikit-learn (sklearn)
 Sklearn meet several of criteria such as speed, well-designed classes for handling data, models, and results
R vs. Python : http://blog.datacamp.com/r-or-python-for-data-analysis
Example :R library for Machine Learning
 Analyzing Data : mean, var, sd, min, max, sum, rowSum, colRum
 Prediction : predict
 Apriori : arules package, apriori
 Logistic Regression : glm
 K-Means clustering : kmeans
 K-Nearest Neighbor Classification : knn
 Naive Bayes : naiveBayes
 Decision Tree : rpart
 Support Vector Machine : svm
Challenge
Processing other types of data (Big Data!) and how to show efficiently the result of Big Data analysis
 Tag cloud
 Visualization of the text in the form of a tag cloud, i.e., a weighted visual list
 Words that appear most frequently are larger
 Helps the reader to quickly perceive the most salient concepts
Part 3 : (1) Visualization
 Clustergram
 Visualization technique used for cluster analysis
 Displaying how individual members of a dataset are assigned to clusters
 as a number of clusters increases
 History flow
 Visualize the evolution of a document as it is edited by multiple authors
 Time appears on the horizontal axis
 Contributions to to the text are on the vertical axis
Part 3 : (2) Visualization
 Spatial information flow
 Depicts spatial information flows
 Example : New York Talk Exchange
It shows the amount of Internet Protocol (IP) data flowing between NY and other cities
The size of the glow on a particular city location corresponds to the amount of IP traffic
Visualization allows us to determine quickly which cities are most closely connected to NY
Part 3 : (3) Visualization

Data science technology overview

  • 1.
    Data Science TechnologyOverview SOOJUNG HONG (DEC 3. 2015) Main Reference : 1. Big Data : The next frontier for innovation, competetion and productivity (Mckinsey Global Institute Report) 2. Big Data at Work (Harvard Business Review Press) 3. And many other Machine Learning literatures
  • 2.
    Data Analytics ApplicationSpectrum Data Model and Algorithm Analytic Insight (Big Data Technology) (Machine Learning Technology) (Visualization Technology) Source : Analytics Driven Organization : Atos white paper
  • 3.
    Source : Gartner,August 2014
  • 4.
    Data Science InnovationFunnel  Define the different part of innovation funnel Part 1 : Data researech & Hypothesis building  Data Science Part 2 : ML solution building & implementation  ML Engineering Part 3 : A/B Testing (if Web app) and Analysis  Data Science Source : http://www.slideshare.net/xamat/10-more-lessons-learned-from-building-machine-learning-systems Data Analytics Applications
  • 5.
    Right Technology Each analyticsapplication typically differs in data inputs  Technologies required for processing can vary significantly Storing and dynamically Analysing Vast amount of unstructured data Web and Social Media Capture and Analysis High Volume & Velocity Telecommunication network signals or IT infrastructure systems logs Task Data Type Source Example A Example B
  • 7.
    Part 1 :Big Data Technology 1. Data Source  Multiple source : image, sound, context  Internal data sources (financial performance data, ERP, PLM, CRM, GPS data etc.)  External data sources (like social media, video, voice and plain text, biz-sector studies) (ex) Data Example : Stream processing. Large real-time streams of event data for algorithmic trading in financial services, RFID event processing applications, fraud detection, process monitoring, Location-based services in telco 2. Scalability  Scale up  Scale out * 150 Exabyte of data in Healthcare (1 Exabyte =1,152,921,504,606,846,976 bytes) * New York Stock Exchange capture 1 TB of trade information during each trading session
  • 8.
     BigTable  Proprietarydistributed database system built on the Google File System (GFS)  Part of the inspiration for Hadoop  Google Cloud Bigtable : public version of BigTable (May, 2015)  Hadoop (MapReduce implementation)  Open source framework for distributed storage and processing of large set of data across multiple computers  Commercial vendors Hadoop (Cloudera Hadoop, Hortonworks Hadoop, EMC Hadoop, Microsoft Hadoop)  Cloud  public, hybrid and private cloud  S3 (Amazon Simple Storage Space), Microsoft Azure Storage Big Data Technology (1) : How to store data
  • 9.
    Big Data Technology(2) : How to process data  In-memory distributed computing environments  Store, distribute and compute large amounts of data  Spark, H2O or SAP Hana  Data warehouse  Specialized database optimized for reporting, often used for storing large amounts of structured data.  Data is uploaded using ETL (extract, transform, and load), often generated using BI tools.  Data mart  Subset of a data warehouse, used to provide data to users usually through business intelligence tools.  Dynamo. Proprietary distributed data storage system developed by Amazon.
  • 10.
    Big Data Technology(3) : How to manage data  Hbase  An open source (free), distributed, non-relational database modeled on Google’s Big Table  Column-oriented database management system that runs on top of HDFS  HIVE  Data warehouse infrastructure built on top of Hadoop  Providing data summarization, query, and analysis (i.e. SQL query on top of Hadoop)  Cassandra  Open source database management system designed to handle huge amounts of structured data  Distributed, Continuoulsy available, linear scale performance  Originally developed at Facebook, now managed as a project of the Apache Software Foundation
  • 11.
  • 12.
  • 13.
  • 14.
    Coexistance Stratedgy  Majorityof big company would not replace their existing systems based on Datawarehouse with big data solution.  coexistence stratedgy  Data warehouse can continue with ist standard workload, using data from legacy operating systems
  • 15.
    Big Data Technology: Data Format Non-Relational database (NoSQL Database)  In contrast to relational database (which based on Table, Record, Column, Row)  A database that does not store data in tables (rows and columns)  Semi-structured data (NoSQL)  Data do not conform to fixed fields but contain tags and other markers to separate data elements  CSV, XML, HTML-tagged text and JSON documents are semi structured documents  Unstructured data  Data do not conform to fixed fields  Free-form text (e.g., books, articles, body of e-mail messages)  Untagged audio, image and video data
  • 16.
    Part 2 :Machine Learning Technology Algorithms : TECHNIQUES FOR ANALYZING BIG DATA  All of the techniques we list here can be applied to Big Data  In general, larger and more diverse datasets can be used to generate more numerous and insightful results than smaller, less diverse ones Lessons Learned : More data beats a clever algorithm! - ‘A Few Useful Things to Know about Machine Learning’ by P. Domingos
  • 17.
    Machine Learning Technology@Quora  Millions of questions and answers  Millions of users  Thousands of Topics
  • 18.
    Part 2 :(1) Machine Learning Technology  Supervised learning  A Set of ML technique (Decision Trees, K-NN, SVM, Naive Bayes, Neural Network, Logistic Regression)  Infer a function or relationship from a set of training data  Examples : classification and regression  Unsupervised learning  A set of ML technique (K-means, Mixture models, Hierarchical clustering)  Finds hidden structure in unlabeled data.  Example : Cluster analysis
  • 19.
     Association rulelearning (Apriori Algorithm, Eclat algorithm)  A set of techniques for discovering interesting relationships (“association rules”) among variables  Can be applied in large databases (data warehouse)  Application example : Market basket analysis (Walmart’s Diaper and Beer)  Classification (Decision Tree, SVM)  A set of techniques to identify the categories in which new data points belong, based on a training set  Training set contains data points that have already been categorized.  Application example : prediction of segment-specific customer behavior (e.g. churn rate)  Cluster analysis (K-means)  A statistical method for classifying objects that splits a diverse group into smaller groups of similar objects  characteristics of similarity are not known in advance . Part 2 : (2) Machine Learning Technology
  • 20.
     Data fusionand data integration  A set of techniques that integrate and analyze data from multiple sources  Develop insights in more efficient and potentially more accurate than single source of data  Example : Data from social media by natural language processing + Real-time sales data  Determine effects for a marketing campaign by having on customer sentiment and purchasing behavior  Ensemble learning (Bayes Optimal Classifier, Bagging, Boosting)  Using multiple predictive models (each developed using statistics and/or machine learning)  Obtain better predictive performance than could be obtained from any of the constituent models  A type of supervised learning. Part 2 : (3) Machine Learning Technology
  • 21.
     Genetic algorithms A technique used for escoptimization that is inspired by the process of natural evolution  Well-suited for solving nonlinear problems  Examples : Applications include improving job scheduling in manufacturing Optimizing the performance of an investment portfolio.  Neural networks (Both Supervised and Unsupervised Learning)  Computational models, inspired by the structure and workings of biological neural networks  Well-suited for finding nonlinear patterns (pattern recognition and optimization)  Examples : Identifying high-value customers that are at risk of leaving a particular company Identifying fraudulent insurance claims. Part 2 : (4) Machine Learning Technology
  • 22.
     Network analysis Characterize relationships among discrete nodes in a graph or a network  In social network analysis, analyze connections between individuals in a community or organization  Examples : Identifying key opinion leaders to target for marketing Identifying bottlenecks in enterprise information flows  Optimization  Numerical techniques to redesign complex systems and processes to improve their performance  Objectives measures can be cost, speed, or reliability  Genetic Algorithm can be used for optimization  Examples : Application improving operational processes such as scheduling, routing Part 2 : (5) Machine Learning Technology
  • 23.
     Regression  Techniquesto determine how the value of the dependent variable changes when independent variables is modified.  Often used for forecasting or prediction  Examples : Forecasting sales volumes based on various market and economic variables Determining what manufacturing parameters most influence customer satisfaction  Sentiment analysis (Opinion Mining)  Application of natural language processing and other analytic techniques  Identify and extract subjective information from source text material  Key aspects identify the feature, aspect, or product about which a sentiment is being expressed  Determining the type, “polarity” (i.e., positive, negative, or neutral) and the degree and strength  Examples : Companies applying sentiment analysis to analyze social response on them Part 2 : (6) Machine Learning Technology
  • 24.
    Example : SentimentClassification Technique
  • 25.
     Spatial analysis(Multilayer Perceptron, Mixture of Experts, Support Vector Regression)  Using location information  Example : Manufacturing supply chain network performance analysis  Simulation  Modeling the behavior of complex systems used for forecasting, predicting and scenario planning  Repeated random sampling, i.e., running thousands of simulations, each based on different assumptions  Example : Assessing the likelihood of meeting financial targets given uncertainties  Time series analysis (Mixture of Expert Model)  Statistical and signal processing for analyzing sequences of data points (values) at successive times  Extract meaningful characteristics from the data.  Examples : Hourly value of a stock market Predicting the number of people who will be diagnosed with an infectious disease. Part 2 : (7) Machine Learning Technology
  • 26.
    Options : Experimentationvs Production  Good intermediate option 1. ML Researcher experiment on iPython Notebooks using Python tools (scikit-learn, Theano) 2. Implement the optimized version 3. Implement the abstraction layer on top of optimized implementation so they can be accessed from regular experimentation tools  Must be aware of in Production 1. Value of Mode = Value it brings to the product 2. Bridge gap between the production design and ML algorithm Machine Learning Infrastructure
  • 27.
    ML Programming language& Tools  R  R Studio  Popular package : dplyr, plyr, data.table, stringr, zoo, ggvis, caret (for machine learning)  Python  iPython Notebook, Spyder  Popular package : pandas, SciPy, NumPy, scikit-learn (sklearn)  Sklearn meet several of criteria such as speed, well-designed classes for handling data, models, and results R vs. Python : http://blog.datacamp.com/r-or-python-for-data-analysis
  • 28.
    Example :R libraryfor Machine Learning  Analyzing Data : mean, var, sd, min, max, sum, rowSum, colRum  Prediction : predict  Apriori : arules package, apriori  Logistic Regression : glm  K-Means clustering : kmeans  K-Nearest Neighbor Classification : knn  Naive Bayes : naiveBayes  Decision Tree : rpart  Support Vector Machine : svm
  • 29.
    Challenge Processing other typesof data (Big Data!) and how to show efficiently the result of Big Data analysis  Tag cloud  Visualization of the text in the form of a tag cloud, i.e., a weighted visual list  Words that appear most frequently are larger  Helps the reader to quickly perceive the most salient concepts Part 3 : (1) Visualization
  • 30.
     Clustergram  Visualizationtechnique used for cluster analysis  Displaying how individual members of a dataset are assigned to clusters  as a number of clusters increases  History flow  Visualize the evolution of a document as it is edited by multiple authors  Time appears on the horizontal axis  Contributions to to the text are on the vertical axis Part 3 : (2) Visualization
  • 31.
     Spatial informationflow  Depicts spatial information flows  Example : New York Talk Exchange It shows the amount of Internet Protocol (IP) data flowing between NY and other cities The size of the glow on a particular city location corresponds to the amount of IP traffic Visualization allows us to determine quickly which cities are most closely connected to NY Part 3 : (3) Visualization