Download to read offline


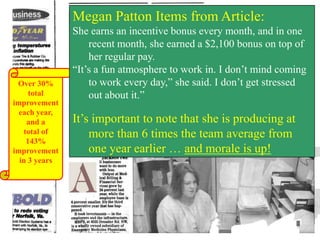
![The American Workforce
In the Entertainment / Entitlement Zone
– Tend to identify more with their own objectives than
those of the organization
– Are comfortable saying “My new dog has to get his
shots today, so I have to leave at 2:45,” [assume the
individual is behind on critical work]
– Perform at about 33% to 45% of potential (from
various studies)
– Focus on personal entitlements regardless of the
organization’s performance
– Spend a disproportionate amount of time on social and
entertainment factors as compared to performance
factors and the core work
– Especially struggle with linear work
© 1997-2013 Samuel H. Pratt / SHP Consulting Limited](https://image.slidesharecdn.com/wfi12sls-slidesforwfiwebsite-131027131315-phpapp01/85/Work-Focused-Improvement-24-320.jpg)

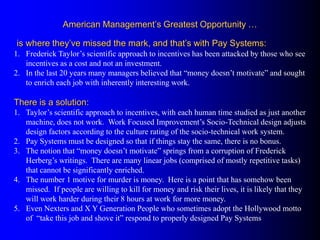
![Gain Share After Design & Kickoff
A Gain Share System is not crock pot chili that you can make
and then walk away
It requires stirring, tasting, seasoning, and Personal Attention
– Use walkabouts to send the message you care about performance
– Post KPIs on Scoreboards to share information and create the Hawthorne
Effect [Individual, Team & Organization Performance over time]
– Use Work Sampling as an enabling tool
– Focus on facts while giving Personal Attention
– Lead by example and be a visible, positive force
– Give Associates frequent performance data
– Pass the message “We can do it!”
– Secure all gains of the Advancement Process
– Instill everyone with a Continuous Improvement Mindset
– Listen, look, and Over-communicate
– Track Inventory
– Track Direct Incentive to Total Work Hour Ratio
– Monitor Tasks to Date Chart
© 1986-2007 Samuel H. Pratt / SHP Consulting Limited
Pay Systems](https://image.slidesharecdn.com/wfi12sls-slidesforwfiwebsite-131027131315-phpapp01/85/Work-Focused-Improvement-26-320.jpg)

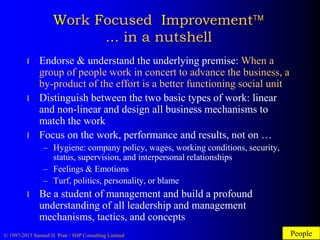
![Pragmatism, Culture, Reality, Etceteras
Summary
Don’t expect rapid changes of culture or values.
Never give up on changing culture over the long haul
Recognize that attempts to transform the culture overnight can
be counterproductive due to reality / perception / expectation
gaps [management can look incredibly naive]
Use multi-factored pay systems to change short-term conduct
and long-term culture
Use a wide variety of management tools & techniques to bring
about change
Manage with facts
Push for rapid changes in technology and conduct
Assure that culture is moving in the right direction, and worry
less about the rate of change
© 1997-2013 Samuel H. Pratt / SHP Consulting Limited
Organizational Dynamics](https://image.slidesharecdn.com/wfi12sls-slidesforwfiwebsite-131027131315-phpapp01/85/Work-Focused-Improvement-28-320.jpg)

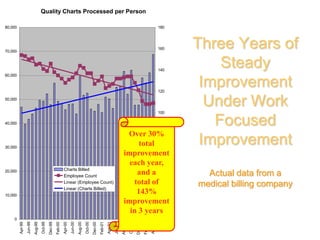


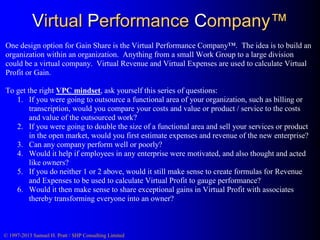
![Long Term Care Division
Close Files [inclusive]
Post EOBs [inclusive]
Issue Bill ( invoice) [inclusive]
Issue PO [inclusive]
Verify Order (Order Intake)
Verify Medicare #
450.00
400.00
40% Reduction In
Force after 9 work days
on Pay System
350.00
300.00
250.00
200.00
150.00
100.00
50.00
3/31/2004
3/30/2004
3/29/2004
3/28/2004
3/27/2004
3/26/2004
3/25/2004
3/24/2004
3/23/2004
3/22/2004
3/21/2004
3/20/2004
3/19/2004
3/18/2004
3/17/2004
3/16/2004
3/15/2004
3/14/2004
3/13/2004
3/12/2004
3/11/2004
3/10/2004
3/9/2004
3/8/2004
3/7/2004
3/6/2004
3/5/2004
3/4/2004
3/3/2004
3/2/2004
3/1/2004
0.00](https://image.slidesharecdn.com/wfi12sls-slidesforwfiwebsite-131027131315-phpapp01/85/Work-Focused-Improvement-35-320.jpg)


The document critiques current management pay systems, arguing that they often fail to recognize the motivational power of financial incentives and the distinction between linear and non-linear work. It advocates for the implementation of scientifically informed pay systems that reward individual and team performance to enhance organizational commitment and drive results. Additionally, it emphasizes the need for a thorough analysis and adaptation of pay structures to align with both organizational goals and employee motivations.