Download to read offline


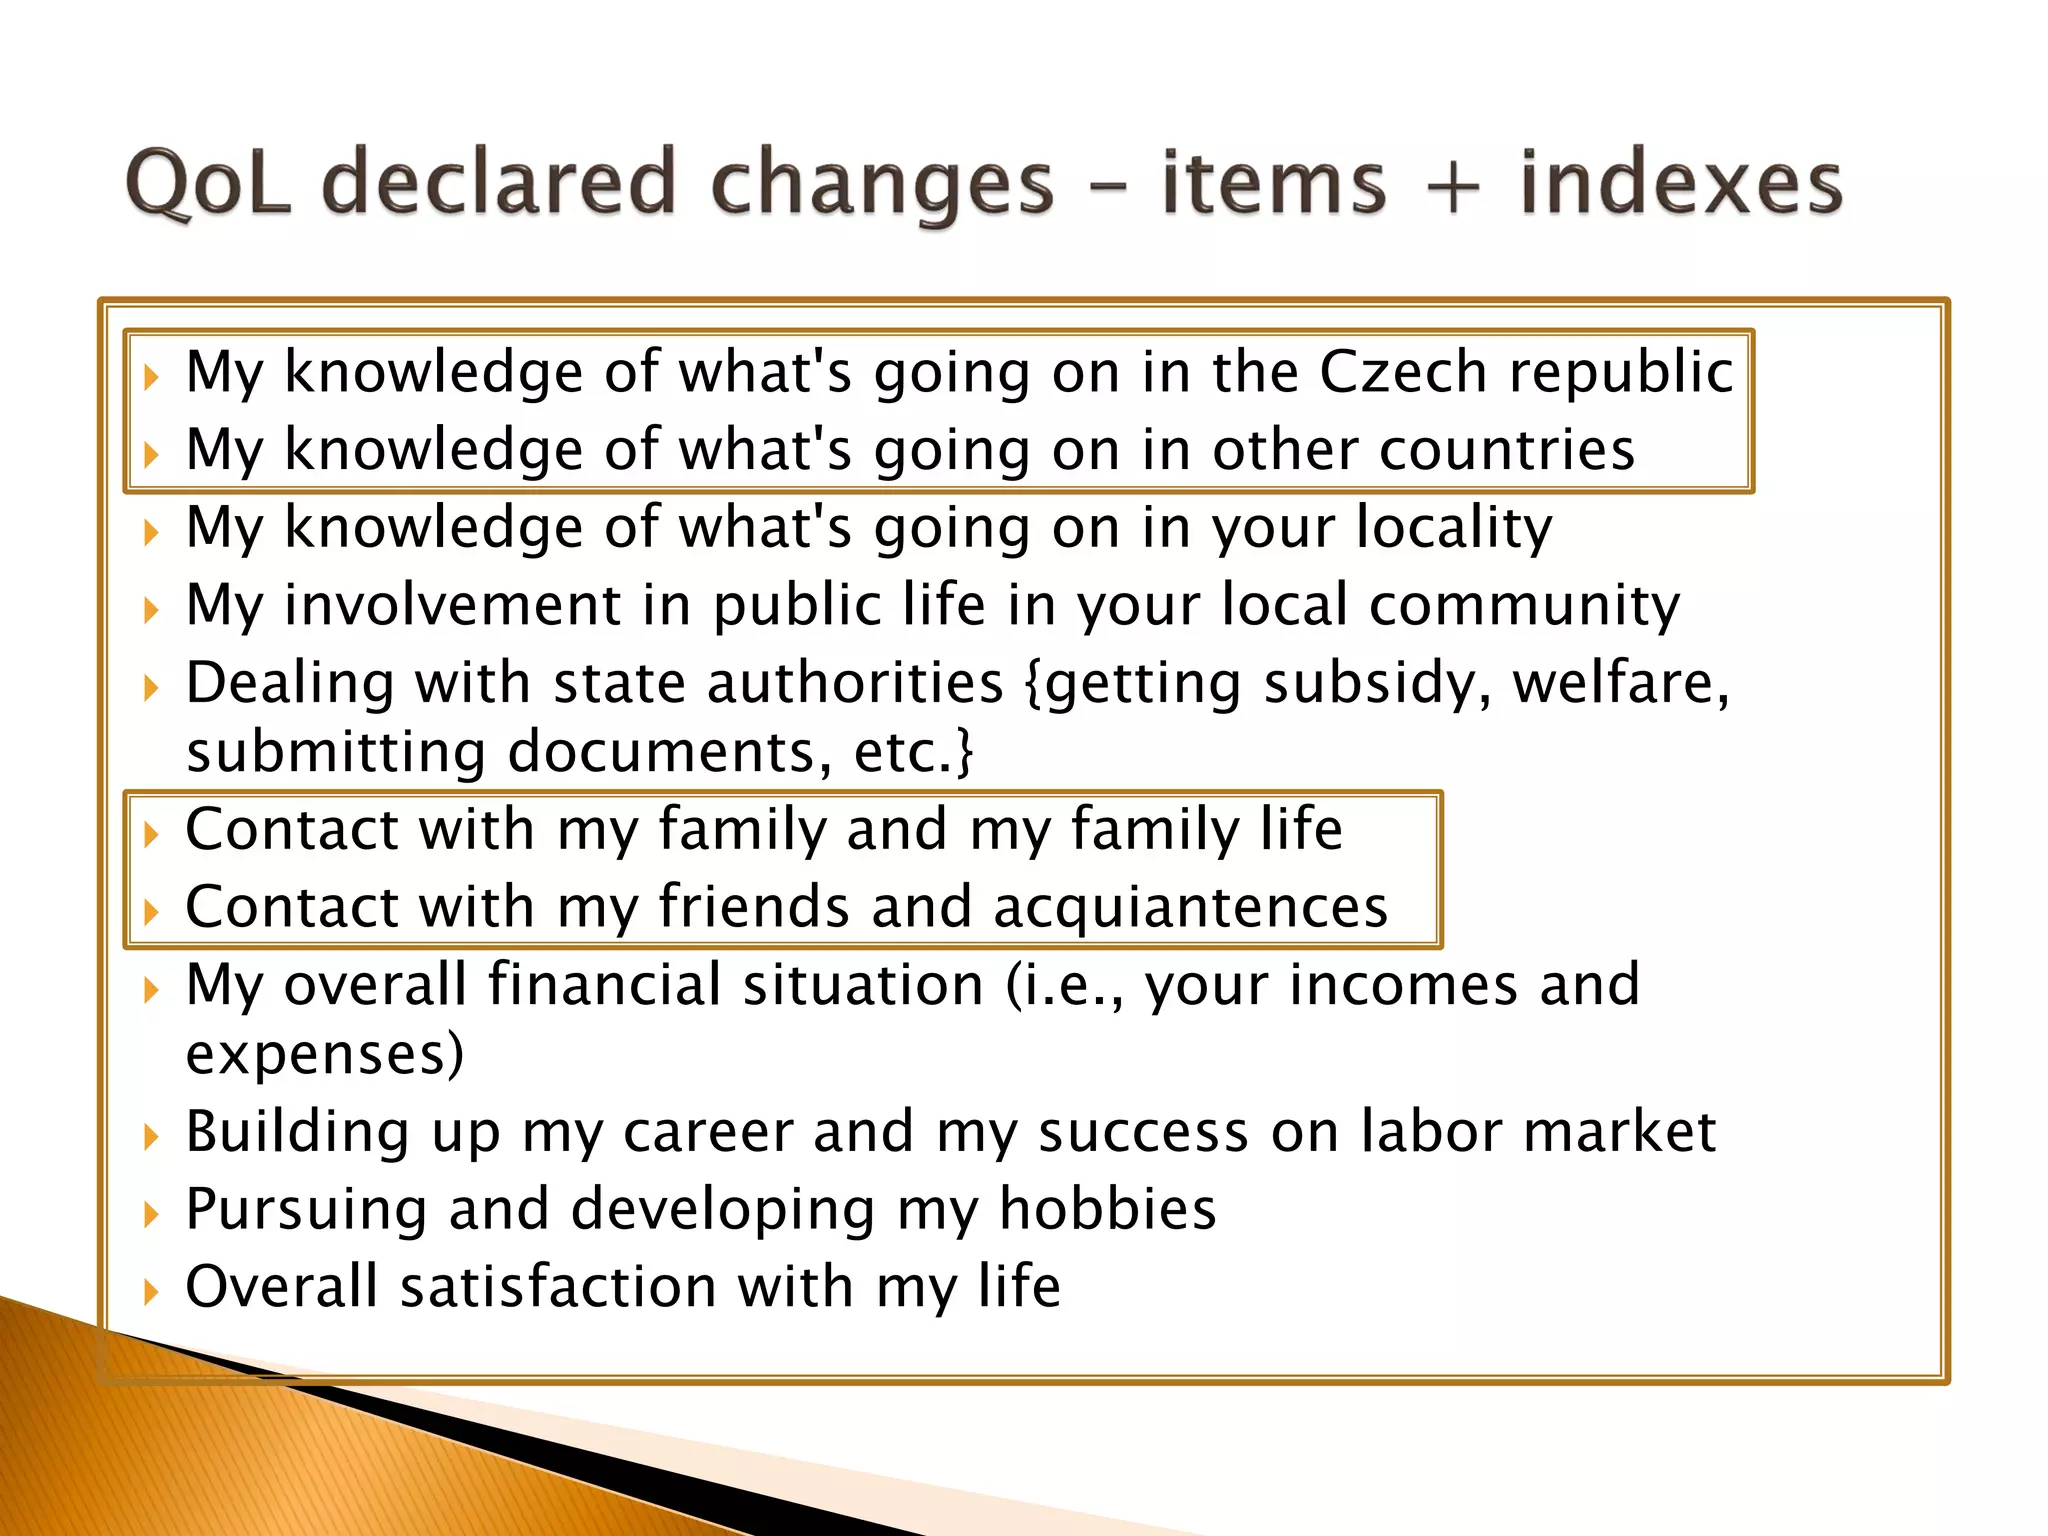
![Using the Internet can either improve or worsen people's
lifes. When you think about your personal experience in
the last years, how much influences your Internet use
following areas of your life? Please, answer with the help
of a scale, where -5 means significant worsening and +5
means significant improvement.
[Scale:]
-5 -4 -3 -2 -1 0 1 2 3 4 5
(-5=Significant worsening 5 = Significant improvement)](https://image.slidesharecdn.com/wipiipresentationtoronto-150228063841-conversion-gate01/75/Presentation-at-Social-Media-Society-2014-conference-Toronto-4-2048.jpg)

![ Core questions
◦ Frequencies of 35 online activities
◦ Places of use, connection devices
◦ Self-disclosure and privacy behavior and attitudes
◦ Importance of the Internet as a source of entertainment and information
Digital skills
◦ Operational, information, [strategic]
Social capital
◦ proxy use, binding, bridging, network, structural holes, self-reported sociability
Cultural capital
◦ Emerging, high-brow, reading books, active foreign language use
Political capital and behavior
Innovativeness
Internet indispensability
Time online weekly
Preference of online communication
Experience with the Internet use/nonuse affecting quality of life in 7
dimensions](https://image.slidesharecdn.com/wipiipresentationtoronto-150228063841-conversion-gate01/75/Presentation-at-Social-Media-Society-2014-conference-Toronto-12-2048.jpg)


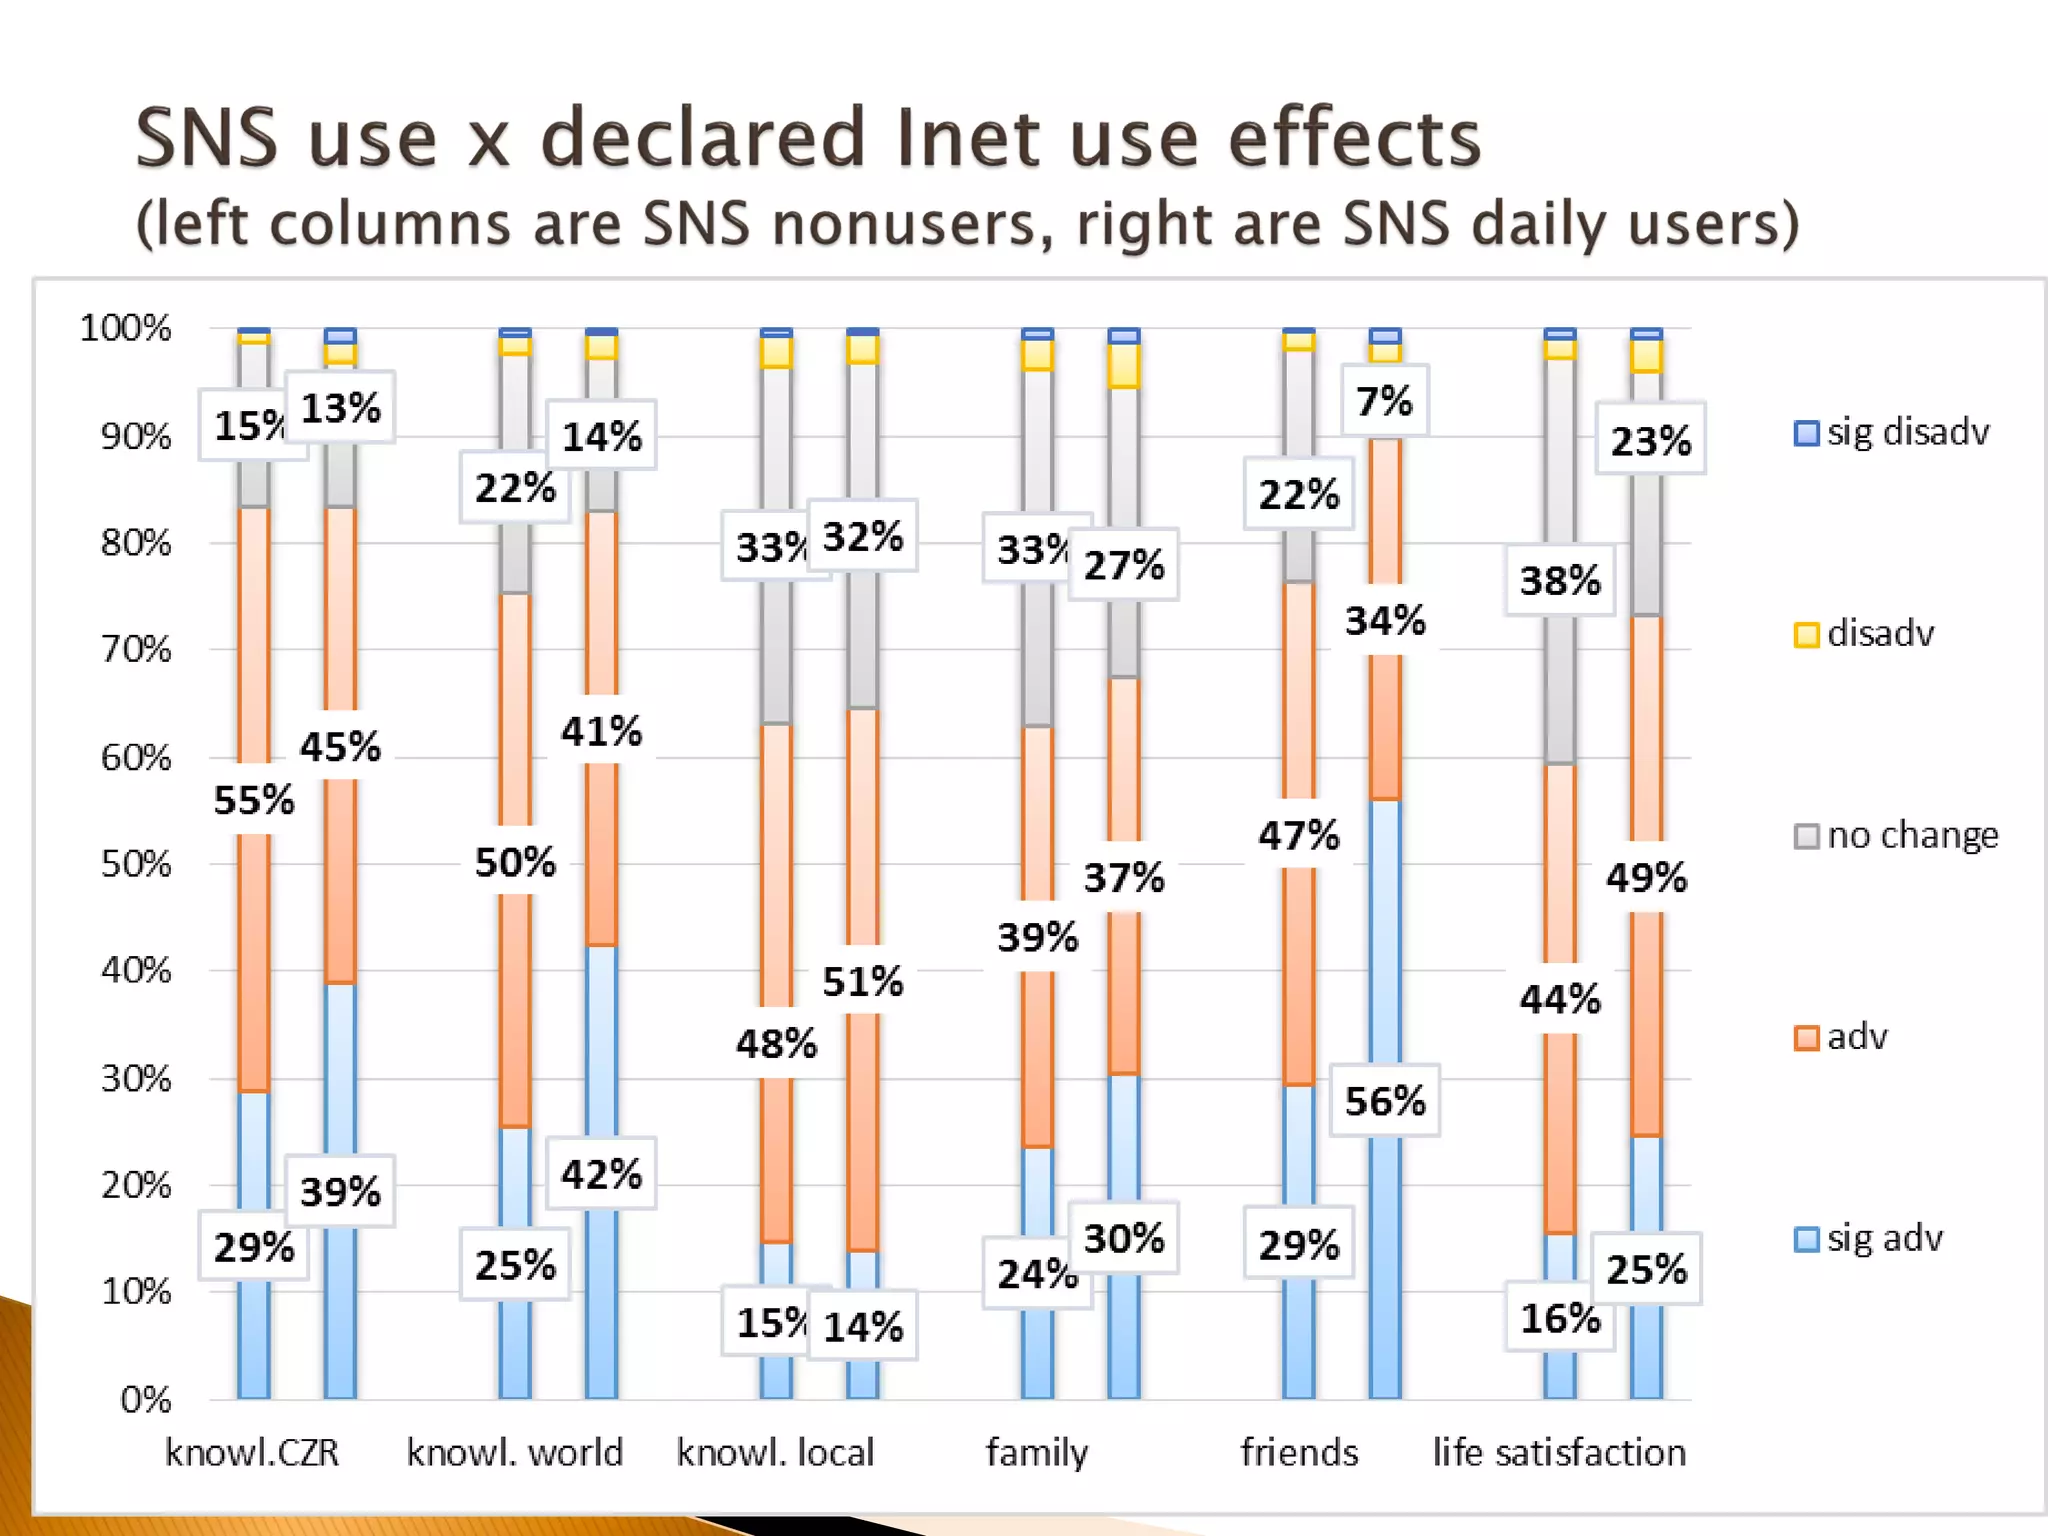

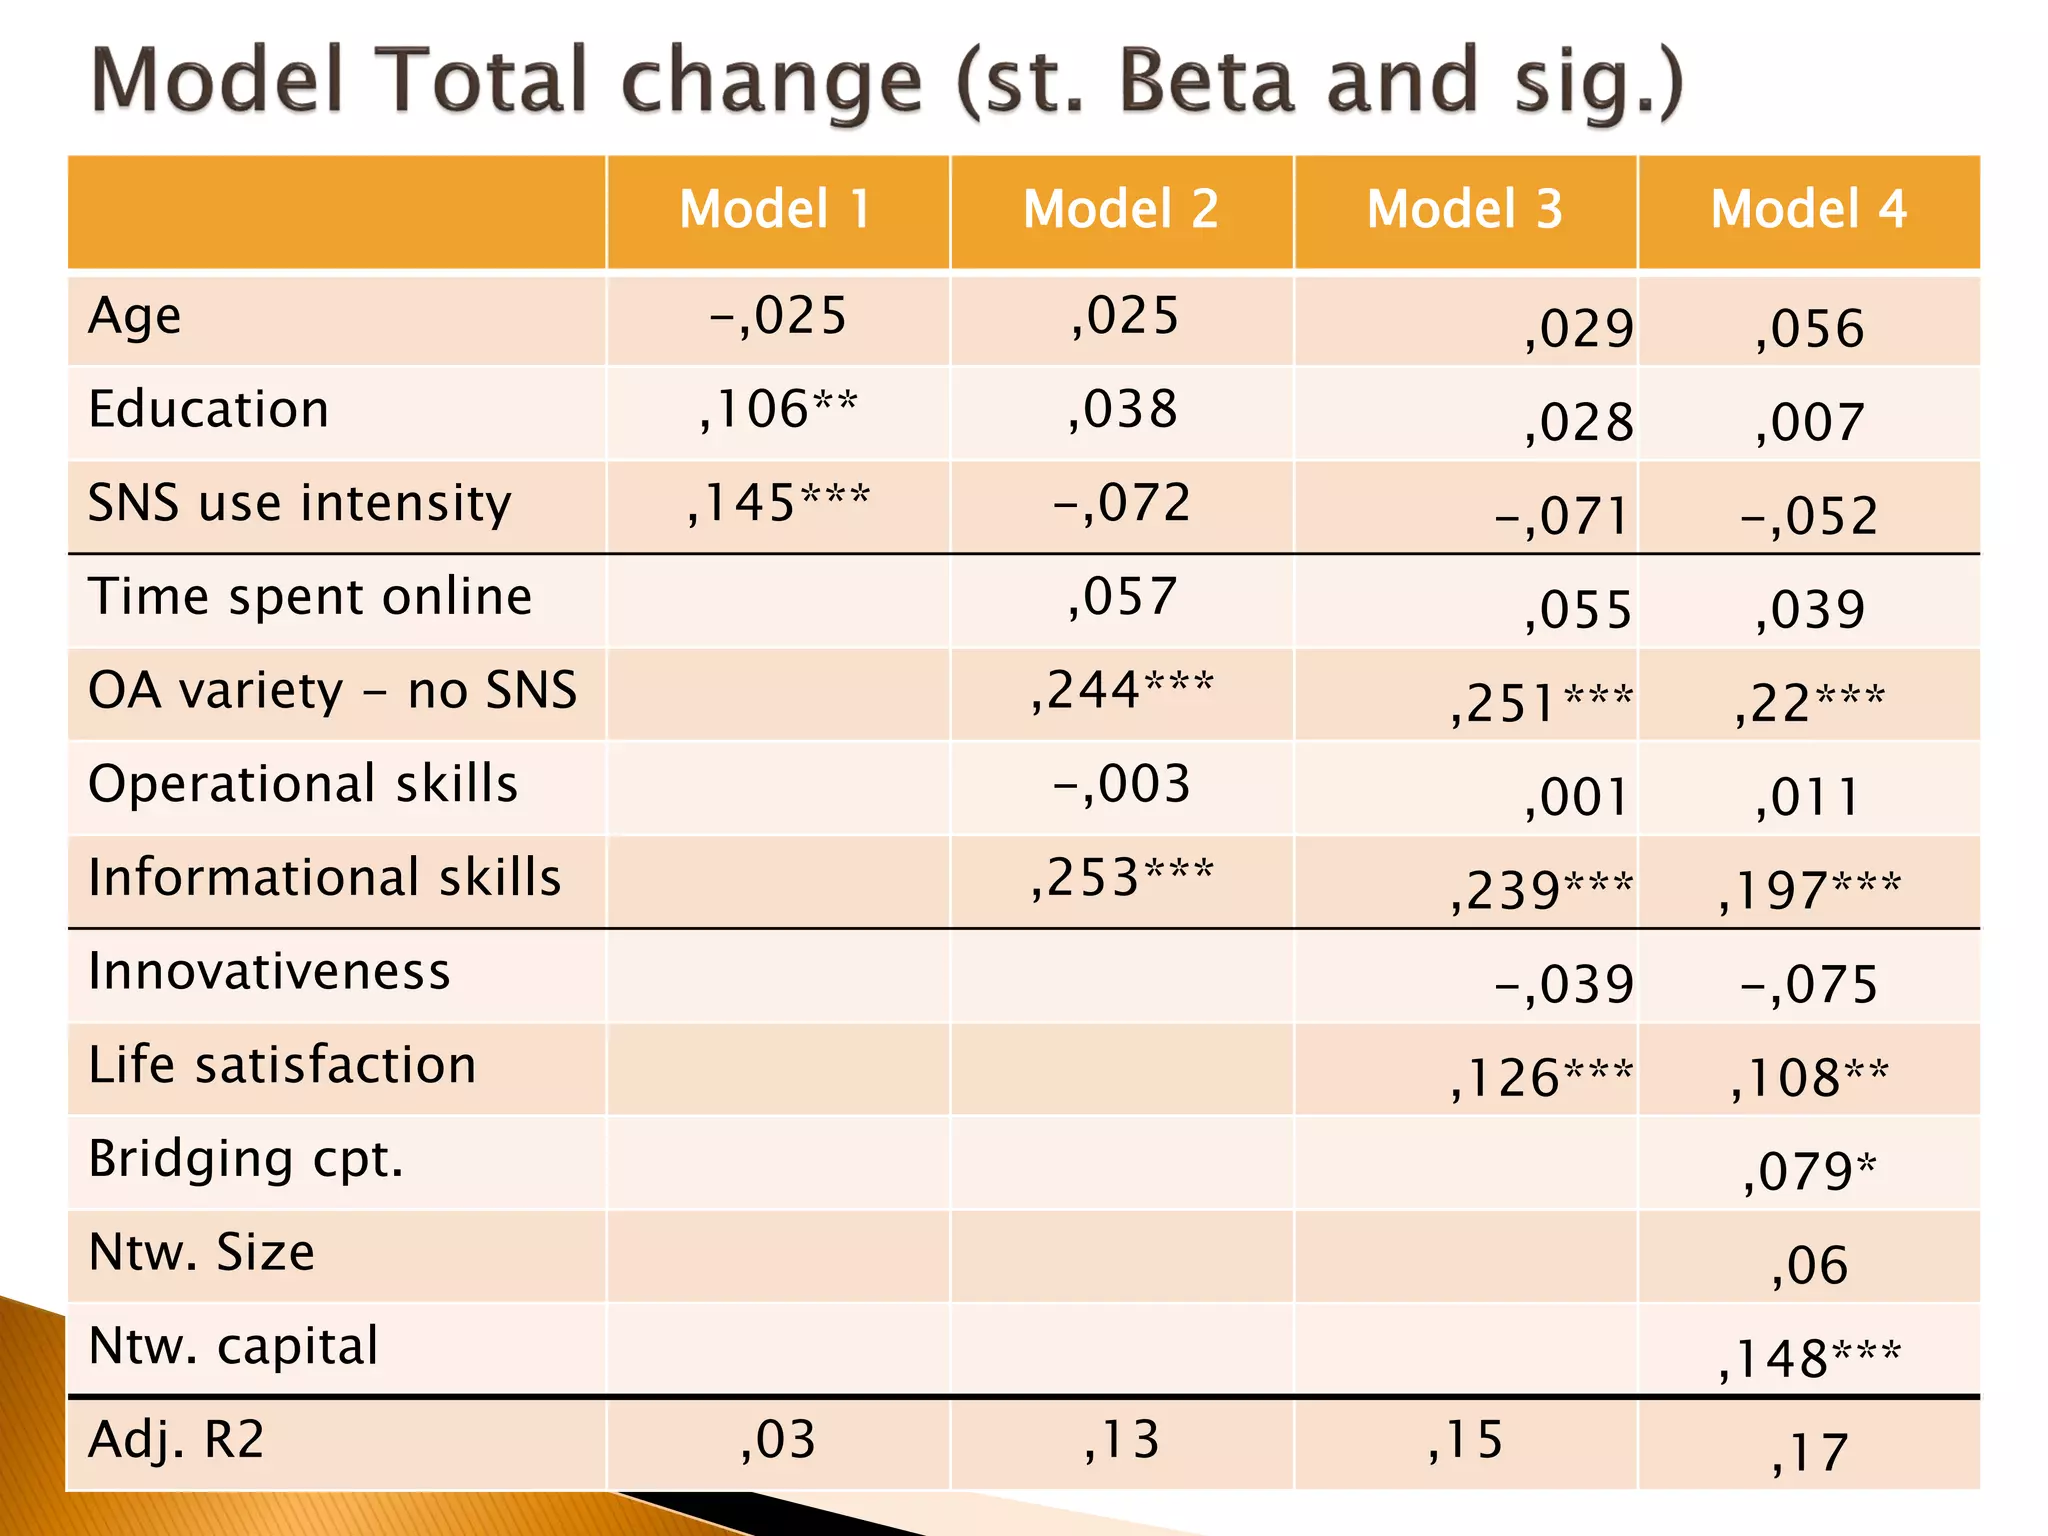
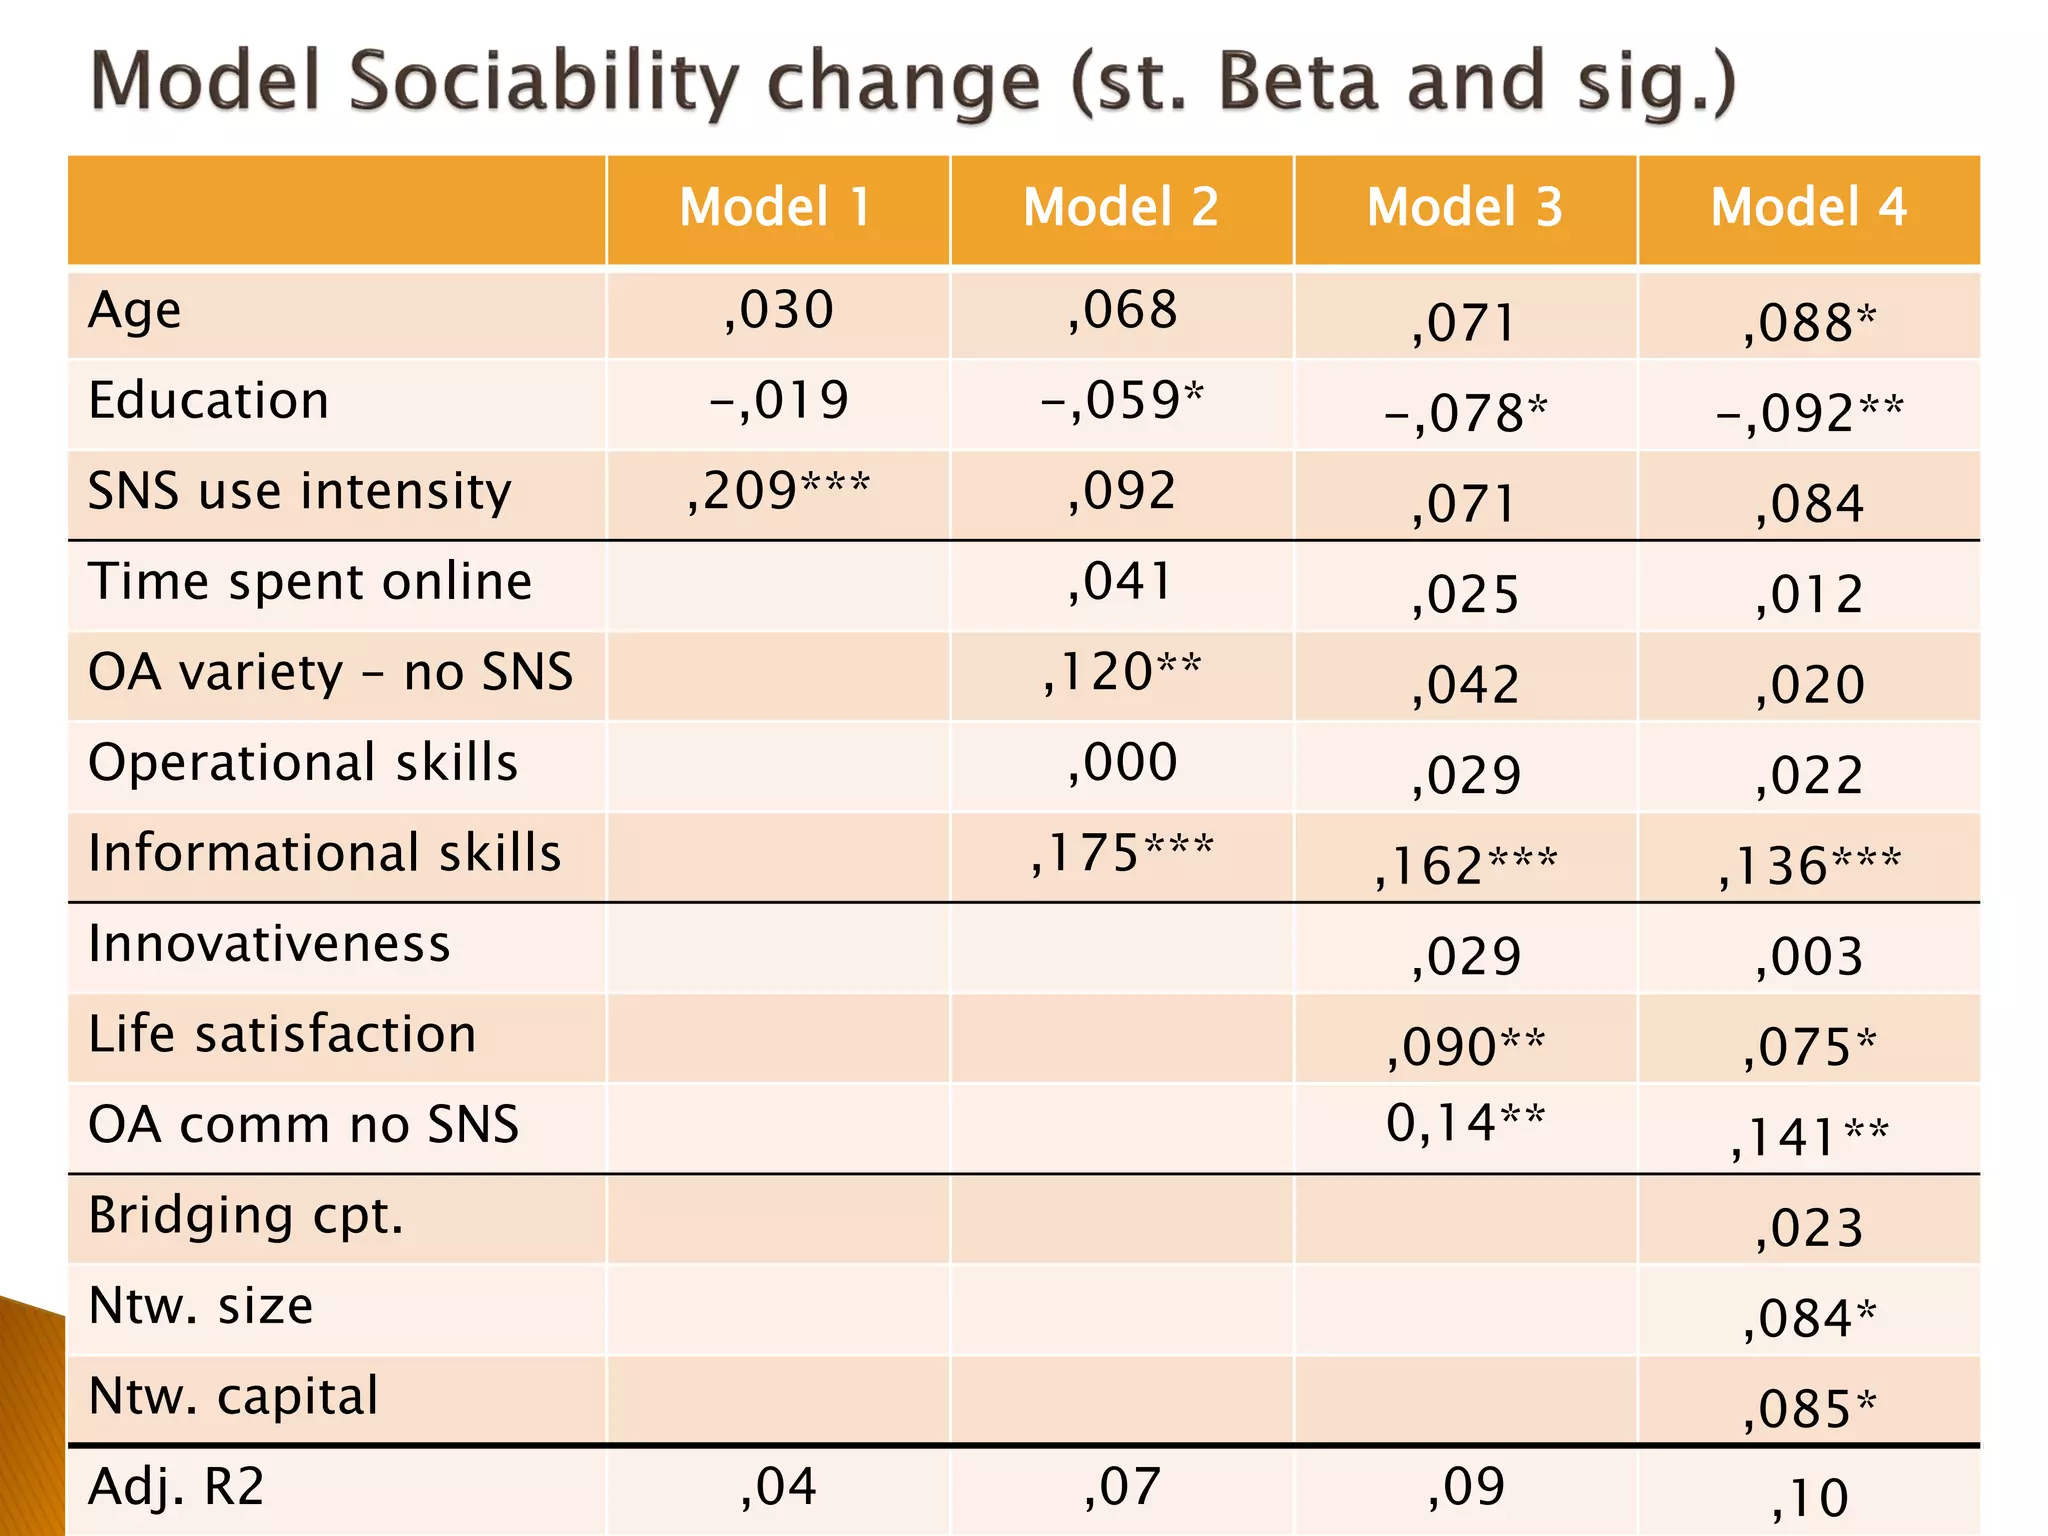
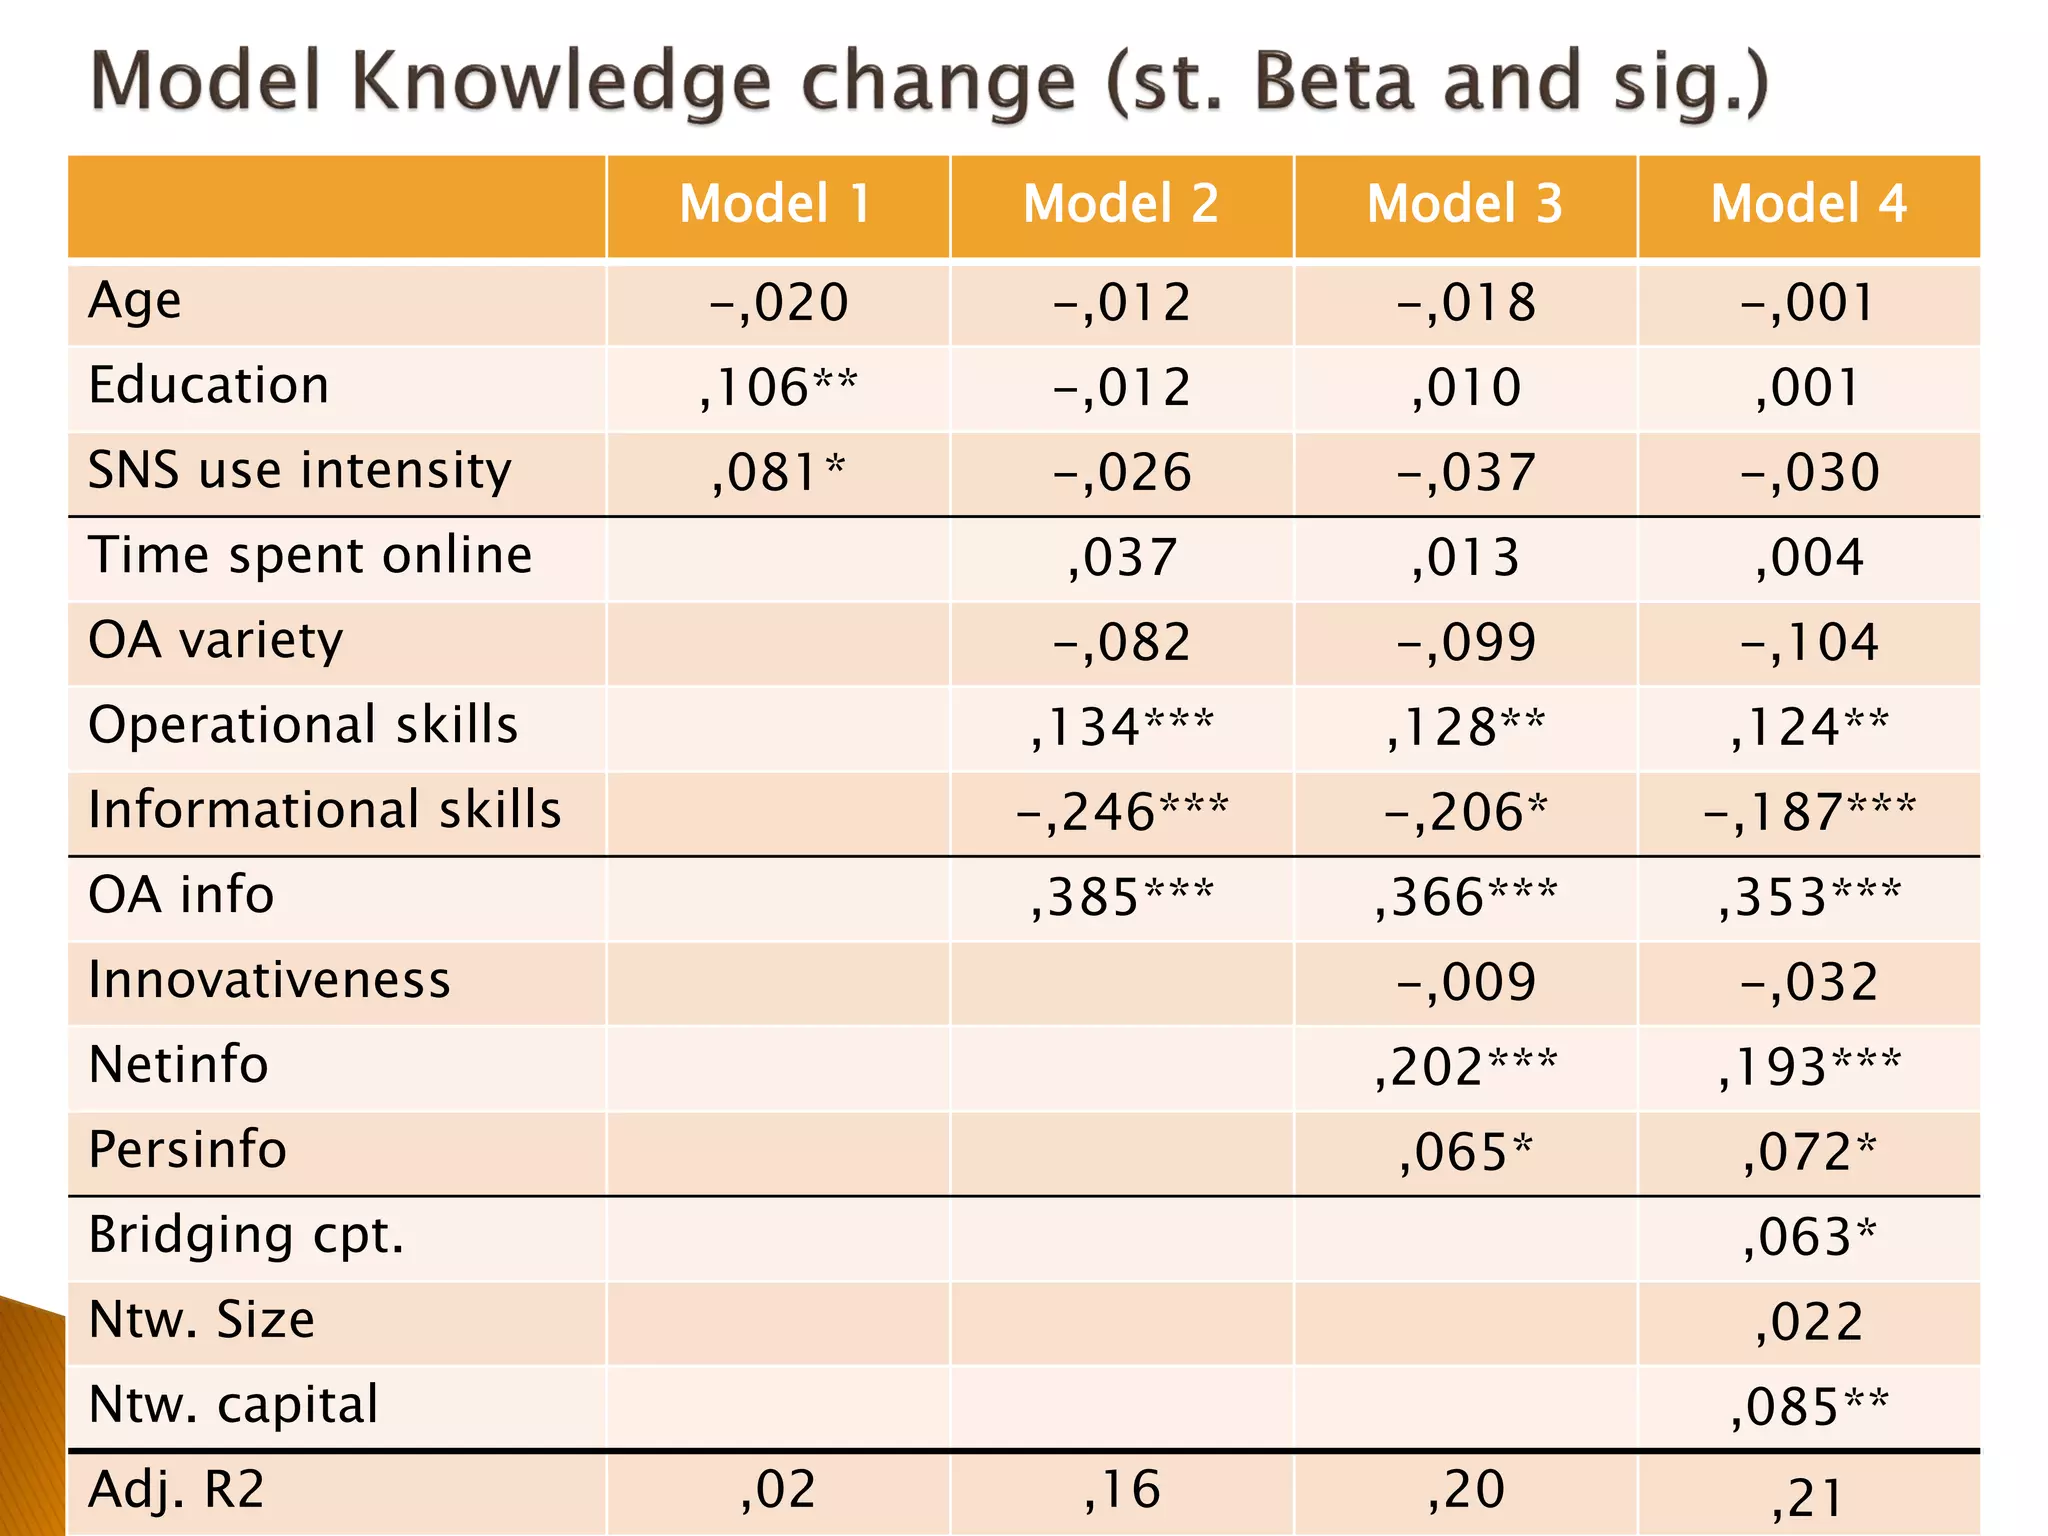
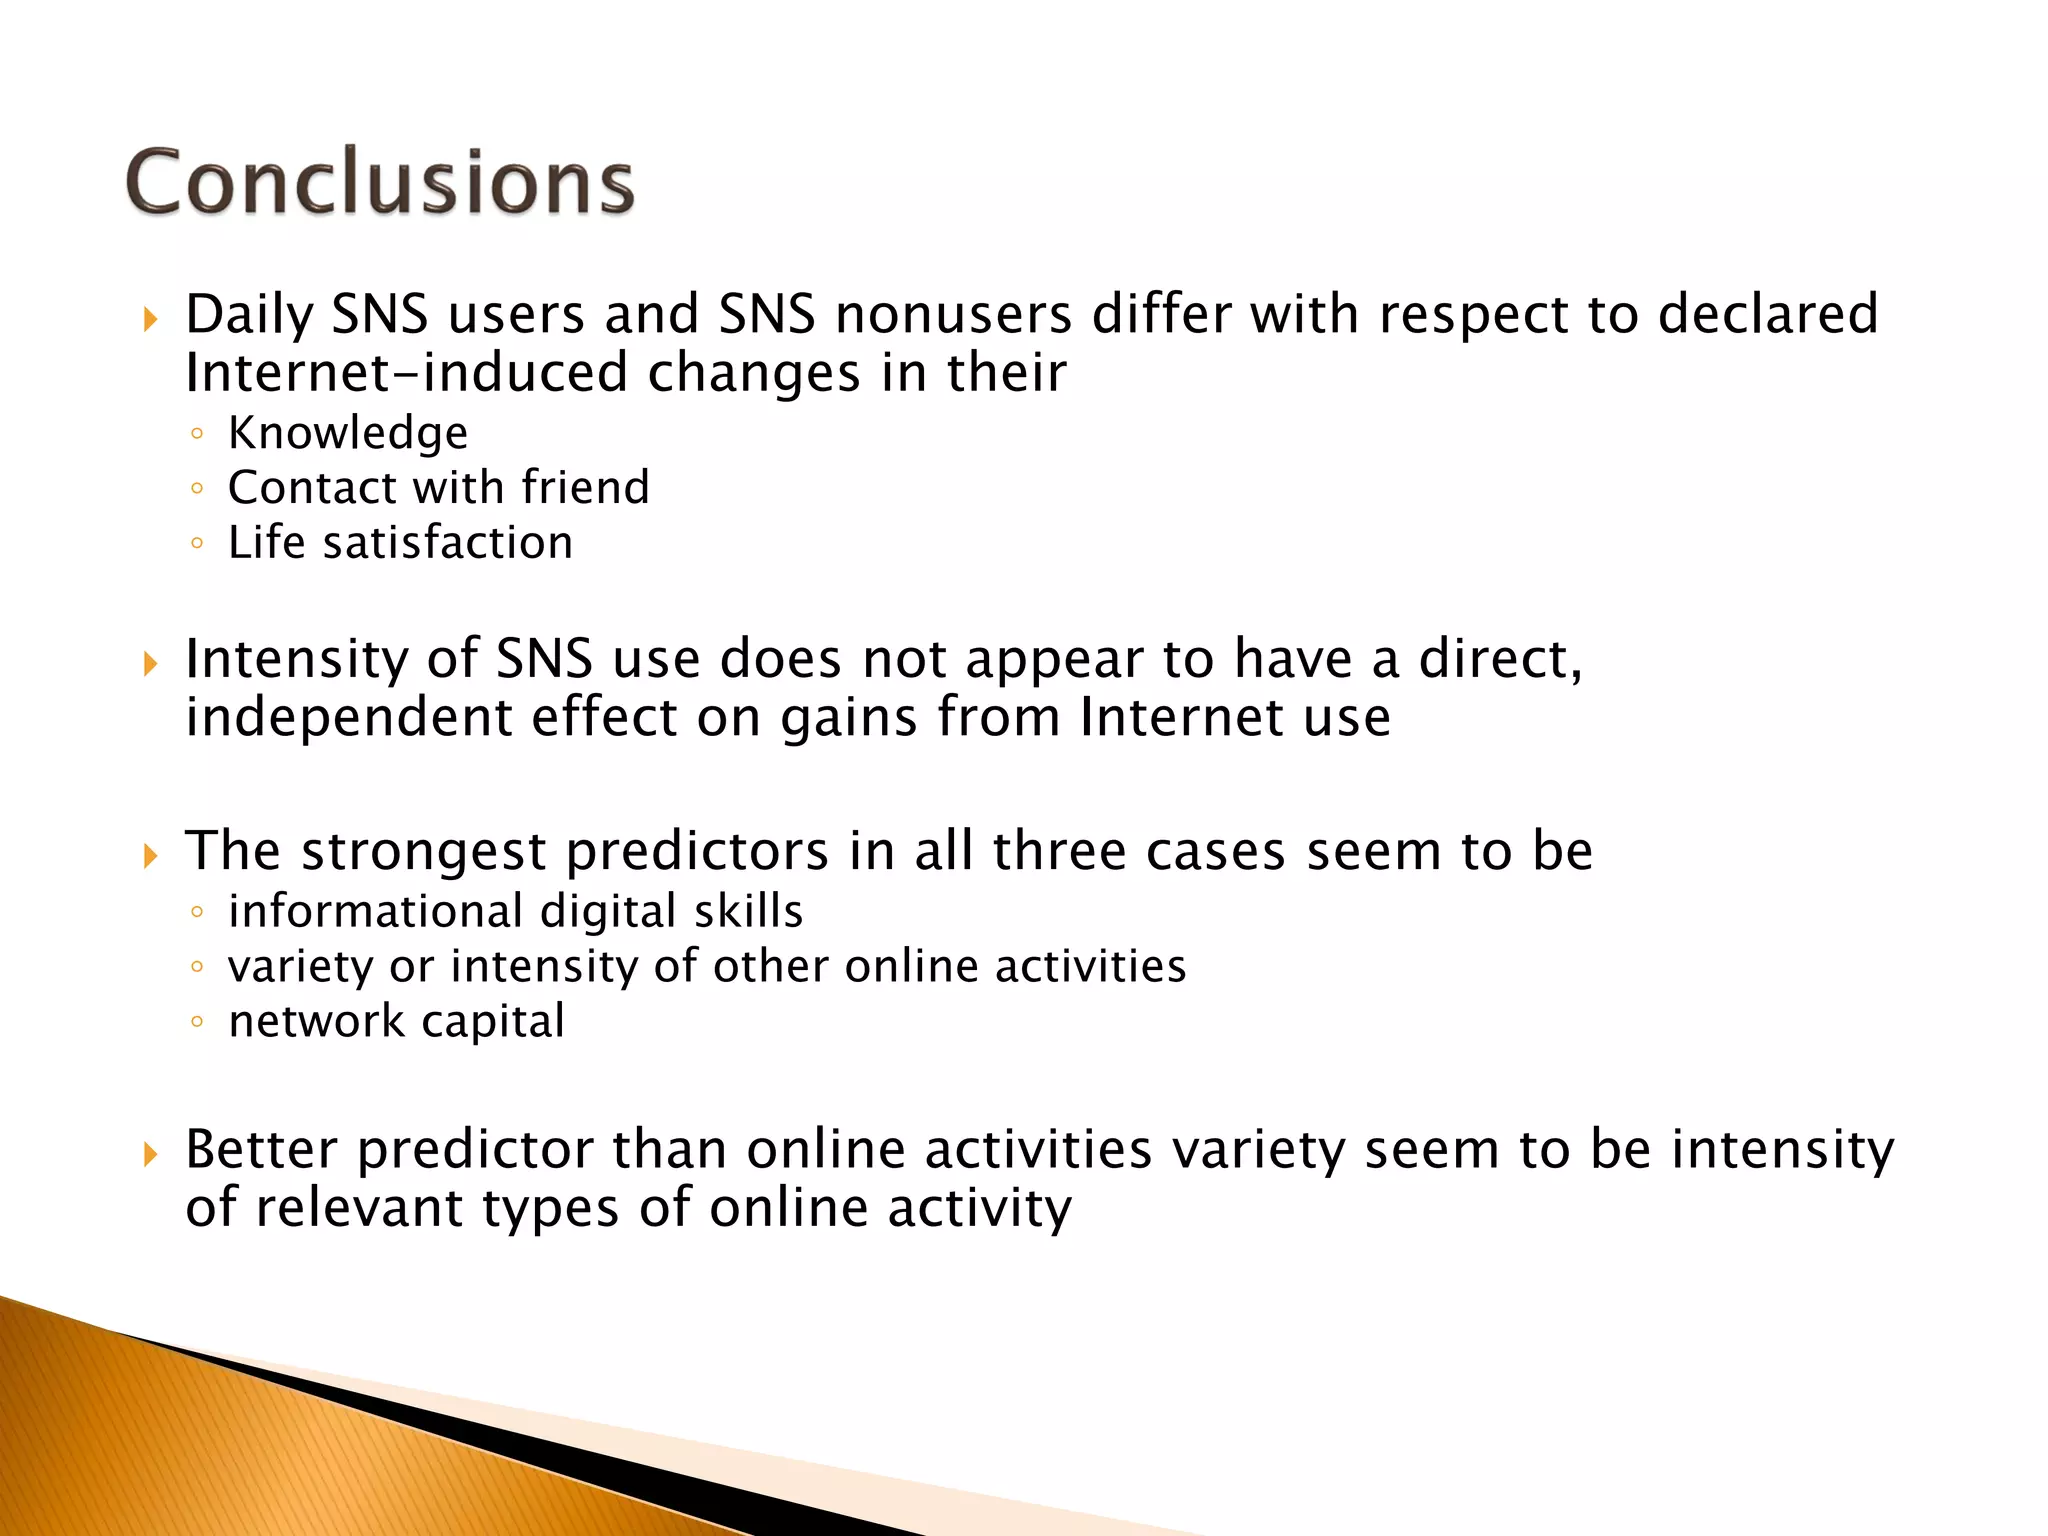


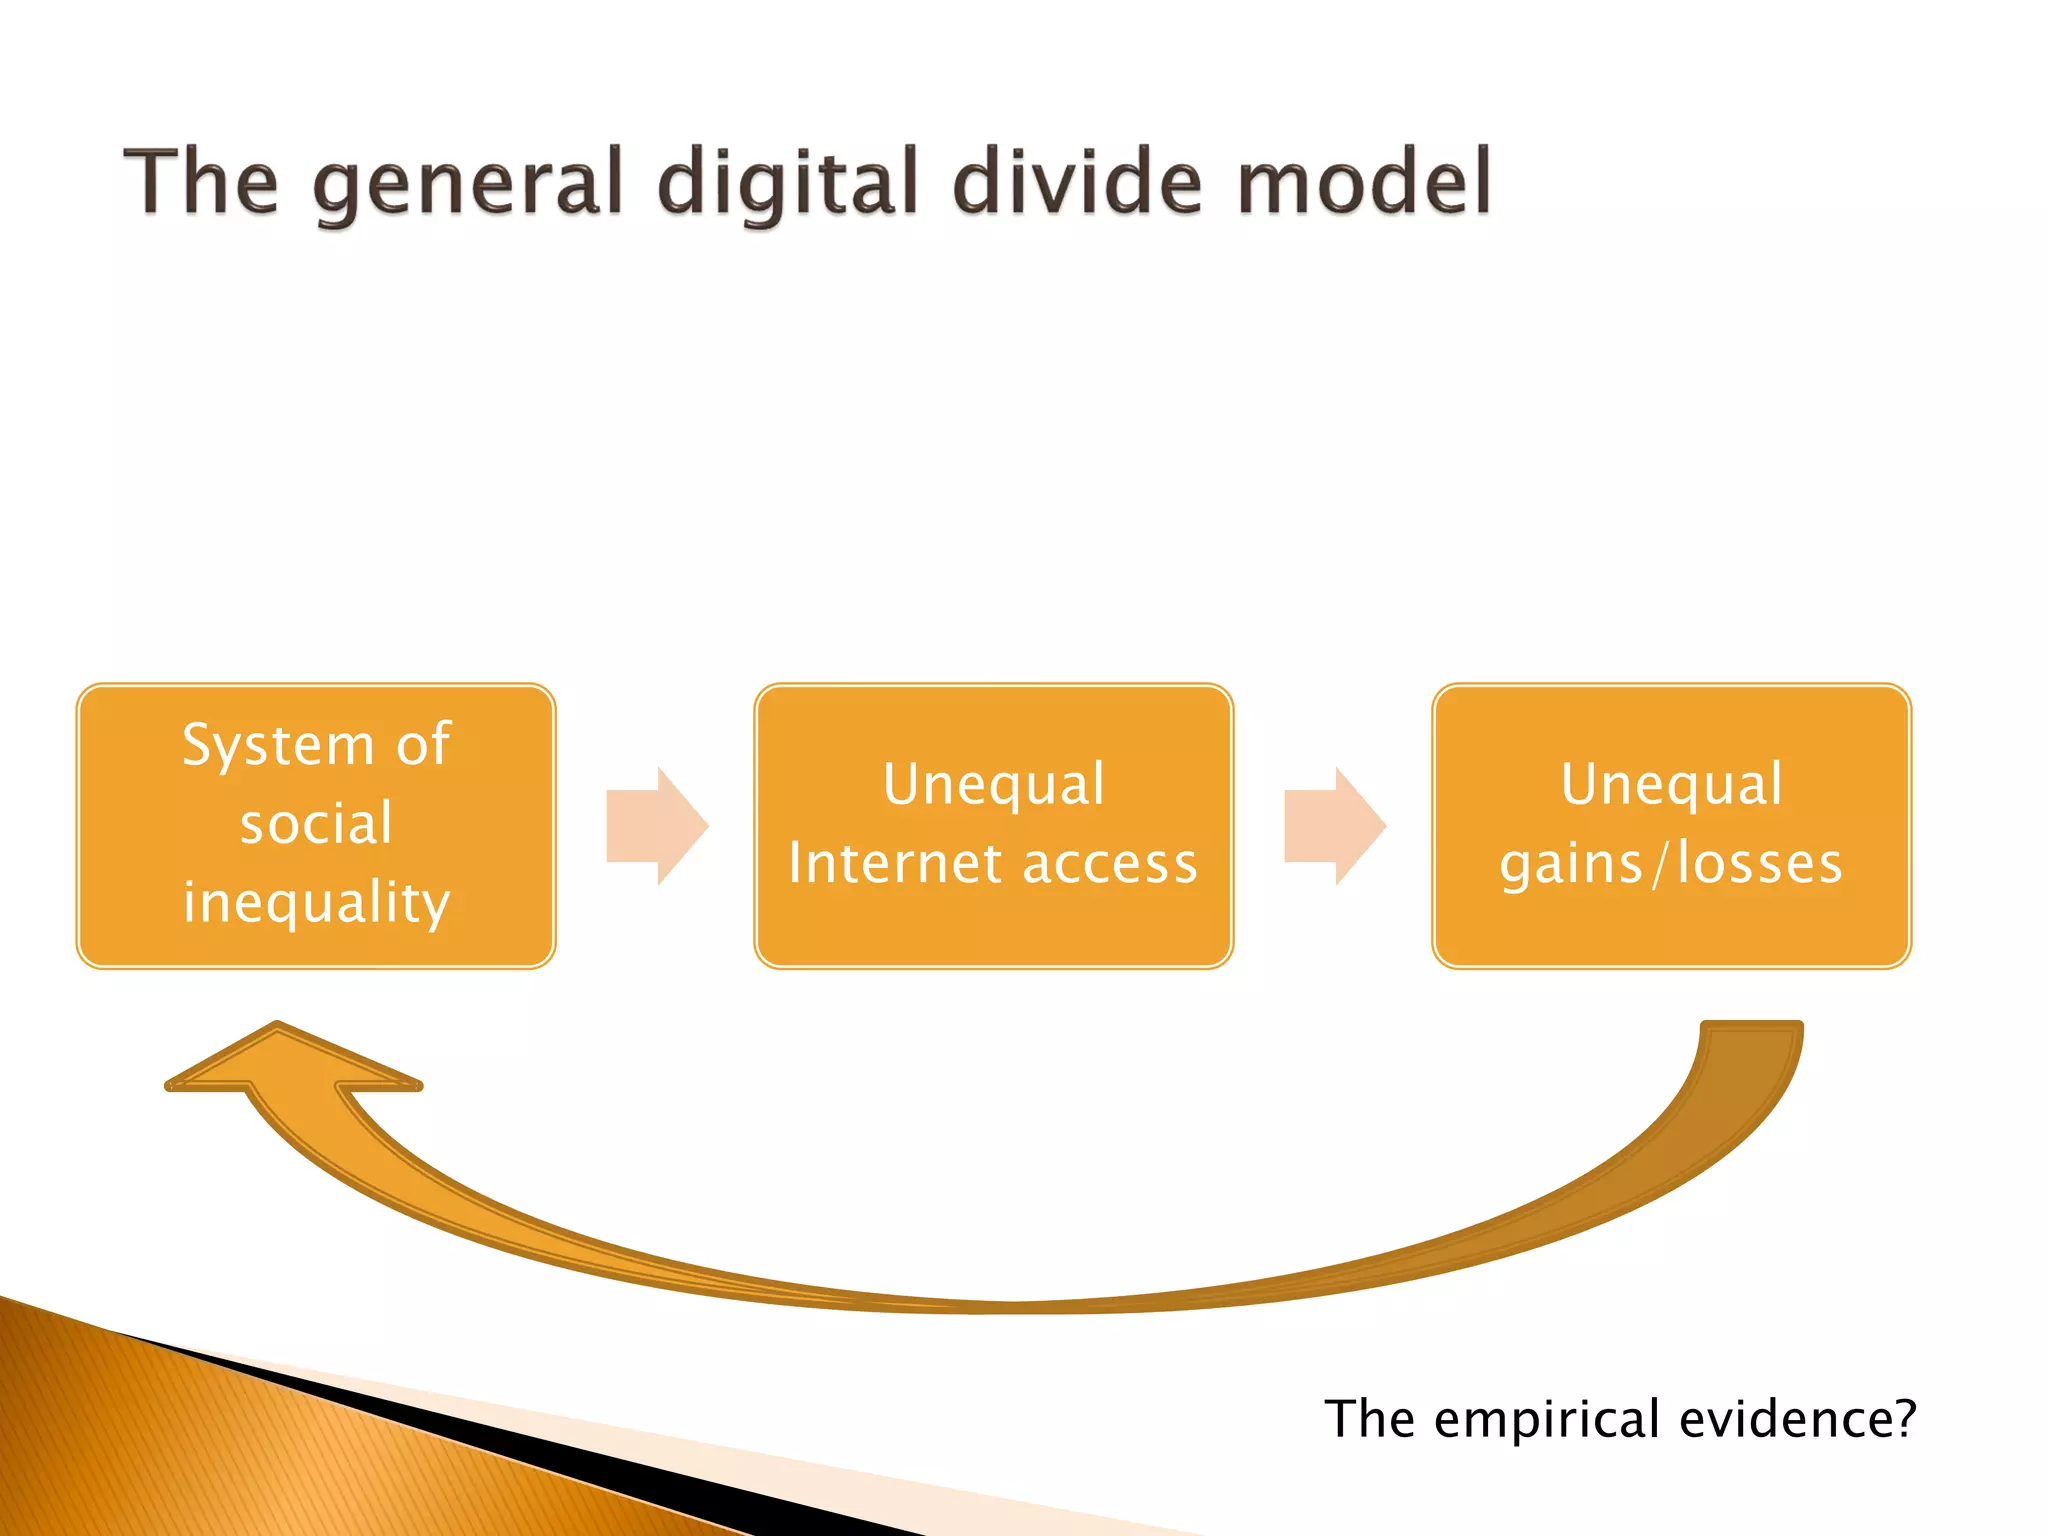
This document summarizes a study on social media use and its impact on gains from internet use in the Czech Republic. It found that daily social media users and non-users differed in their declared knowledge gains, contact with friends, and life satisfaction from internet use. However, the intensity of social media use itself did not seem to have a direct effect on gains. Instead, informational digital skills, variety of other online activities, and network capital were stronger predictors of gains from internet use.


![Executive Guide to Networked Societies [UPDATED Jan 2014]](https://cdn.slidesharecdn.com/ss_thumbnails/executiveguidetonetworkedsocietiesjuly2013-130702015901-phpapp01-thumbnail.jpg?width=640&height=640&fit=bounds)


