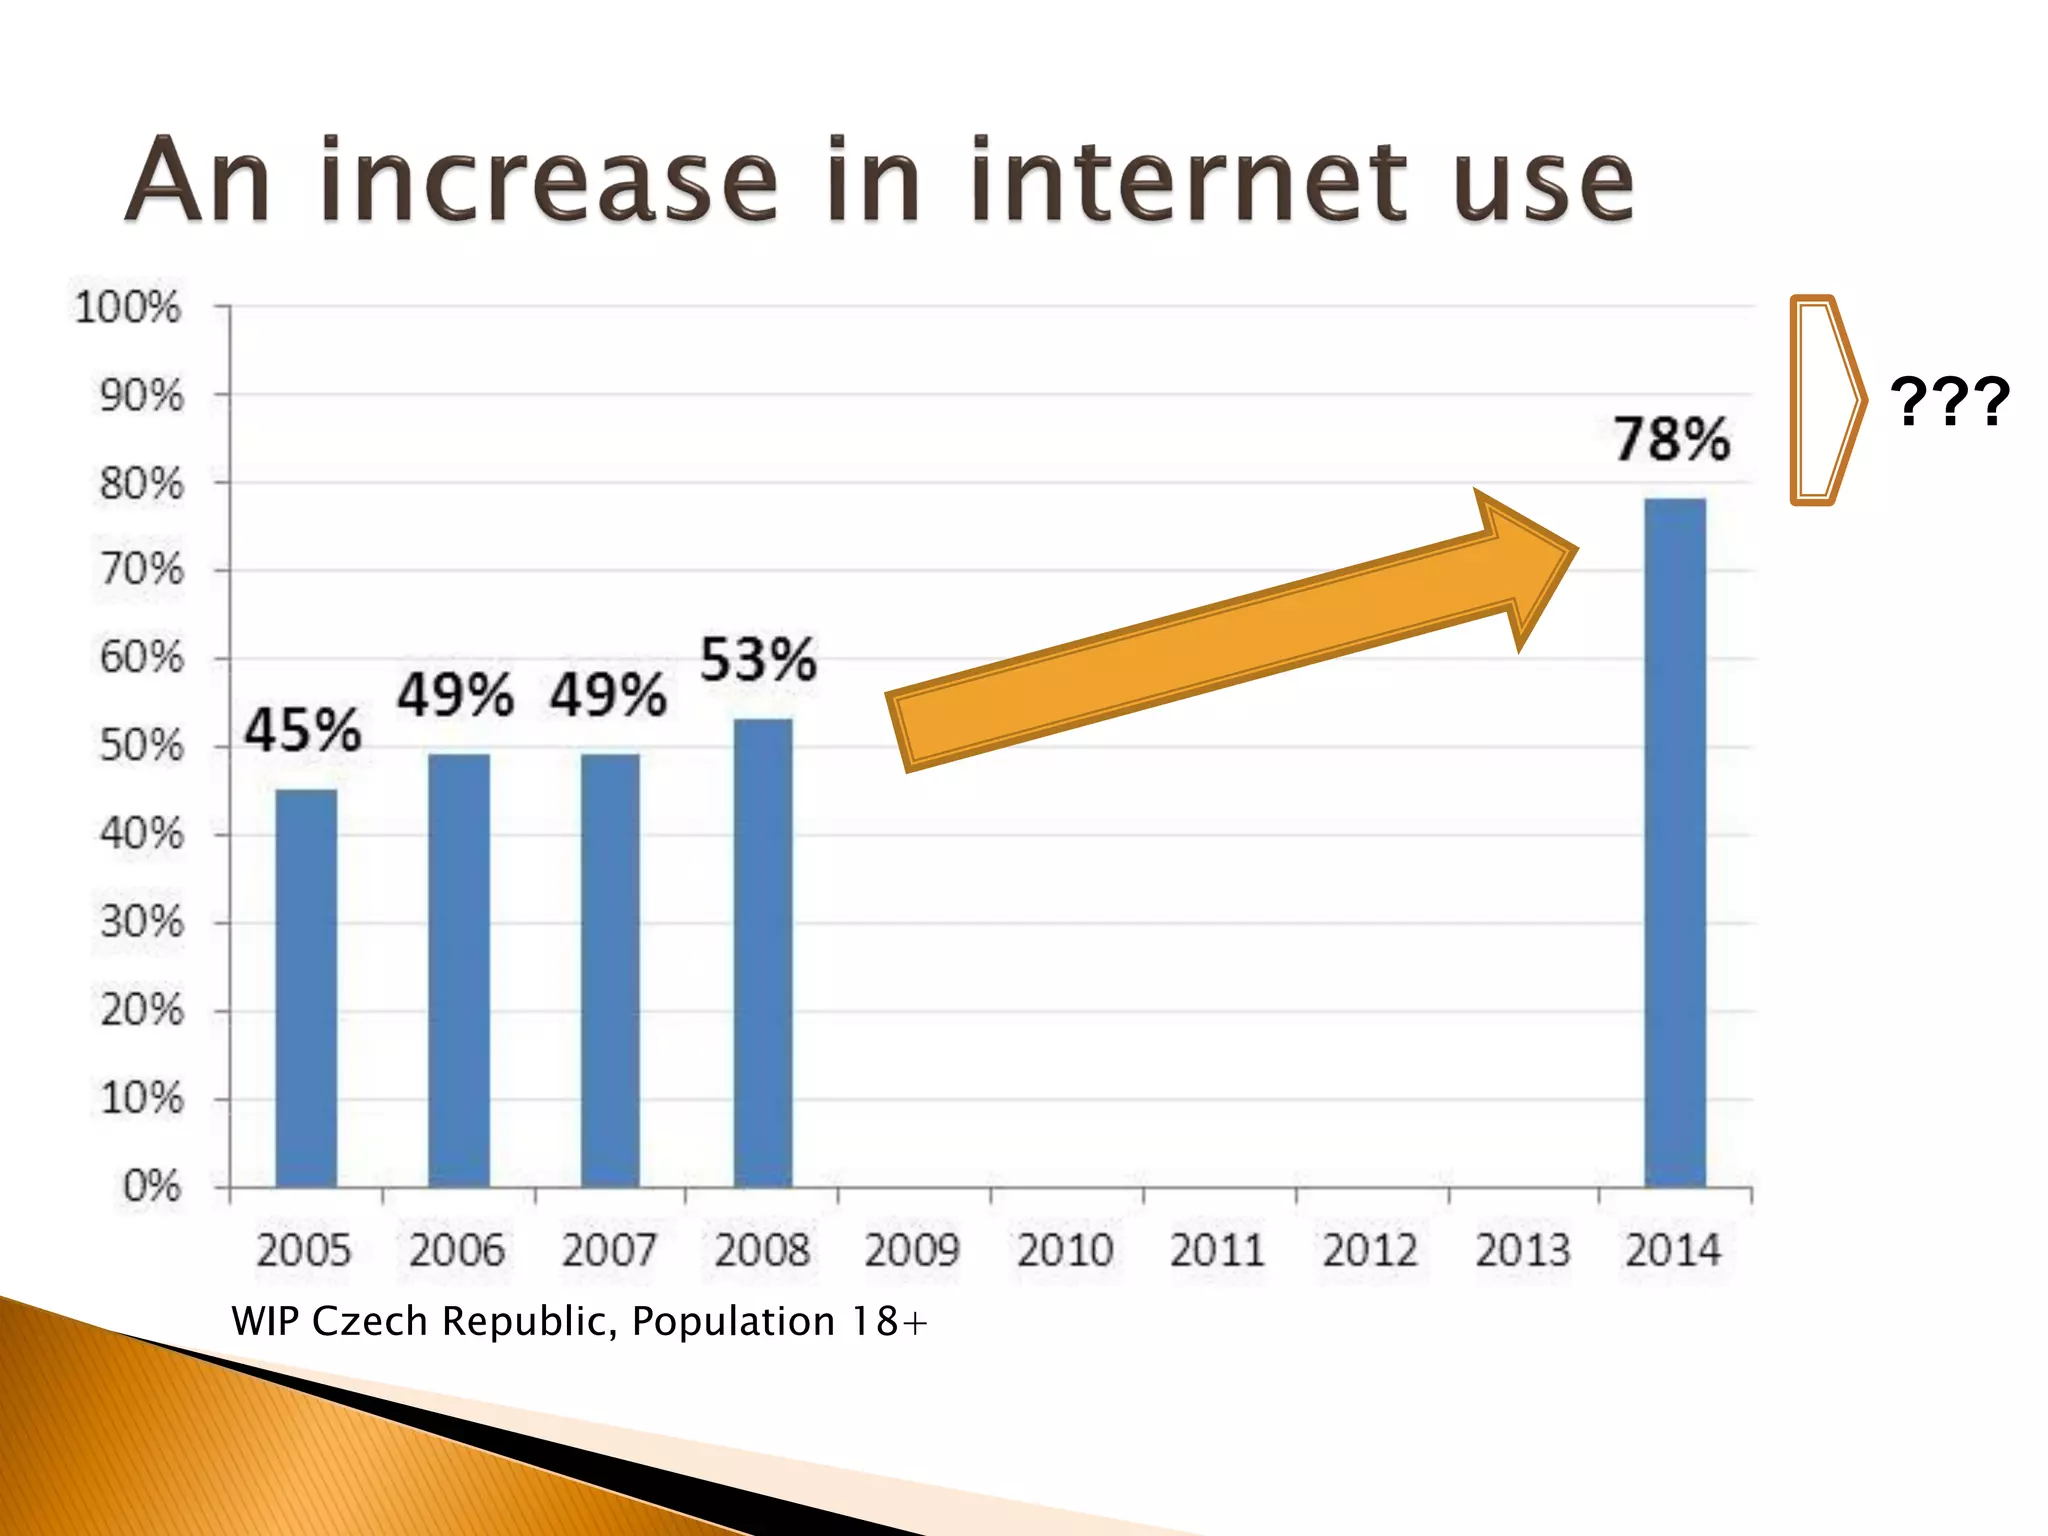
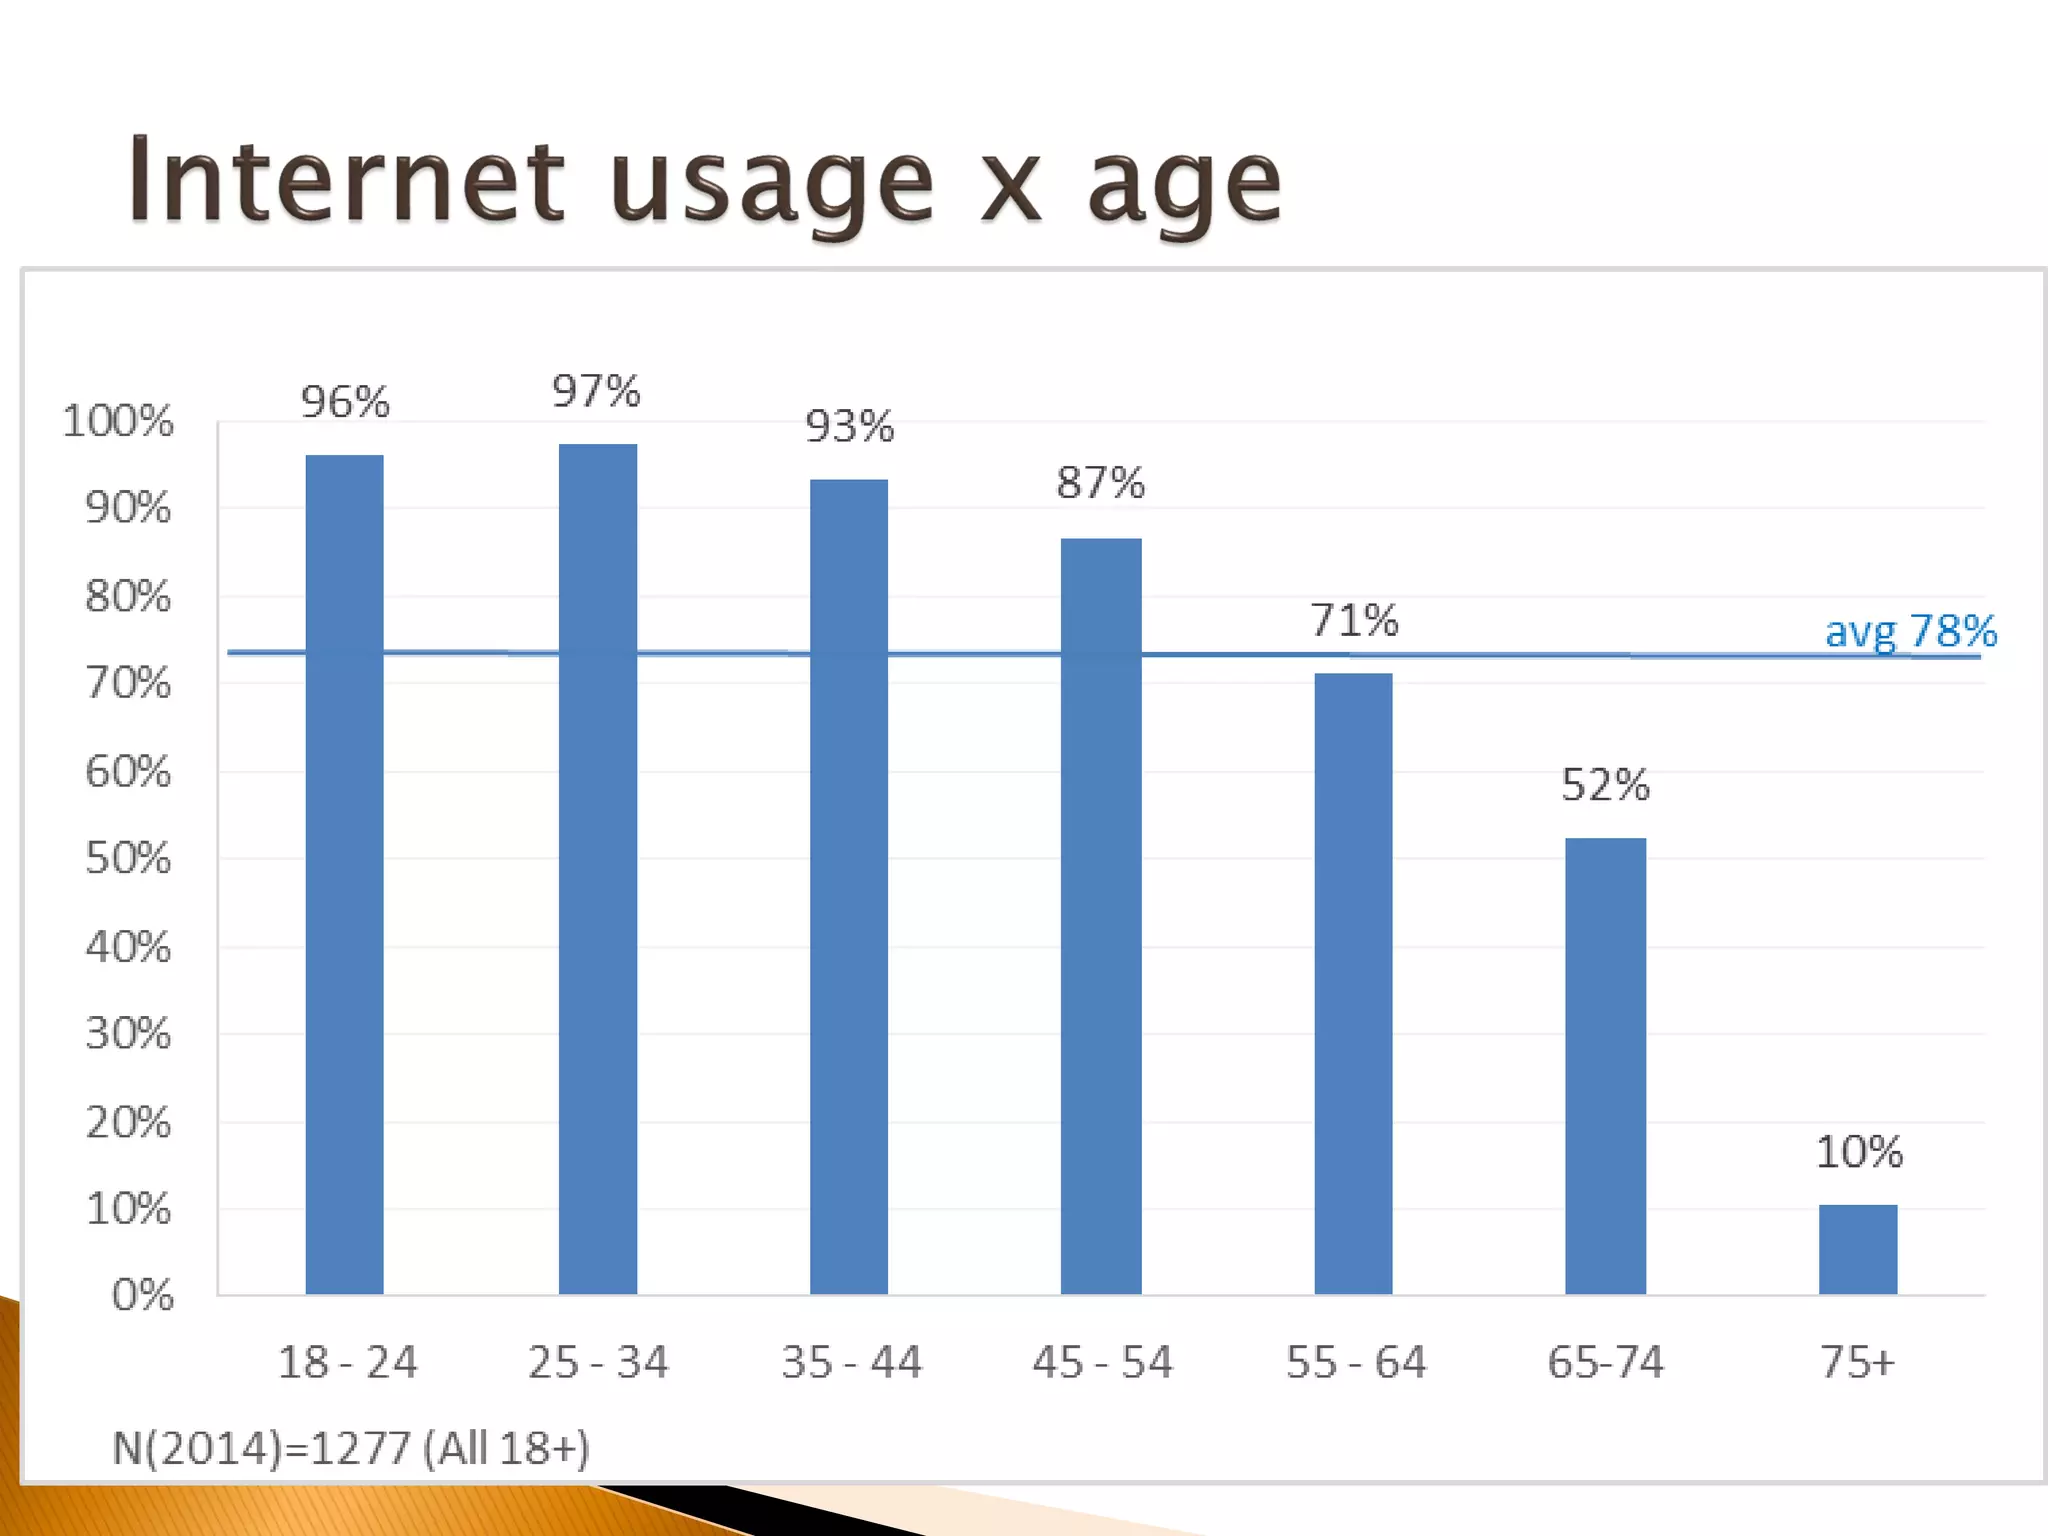
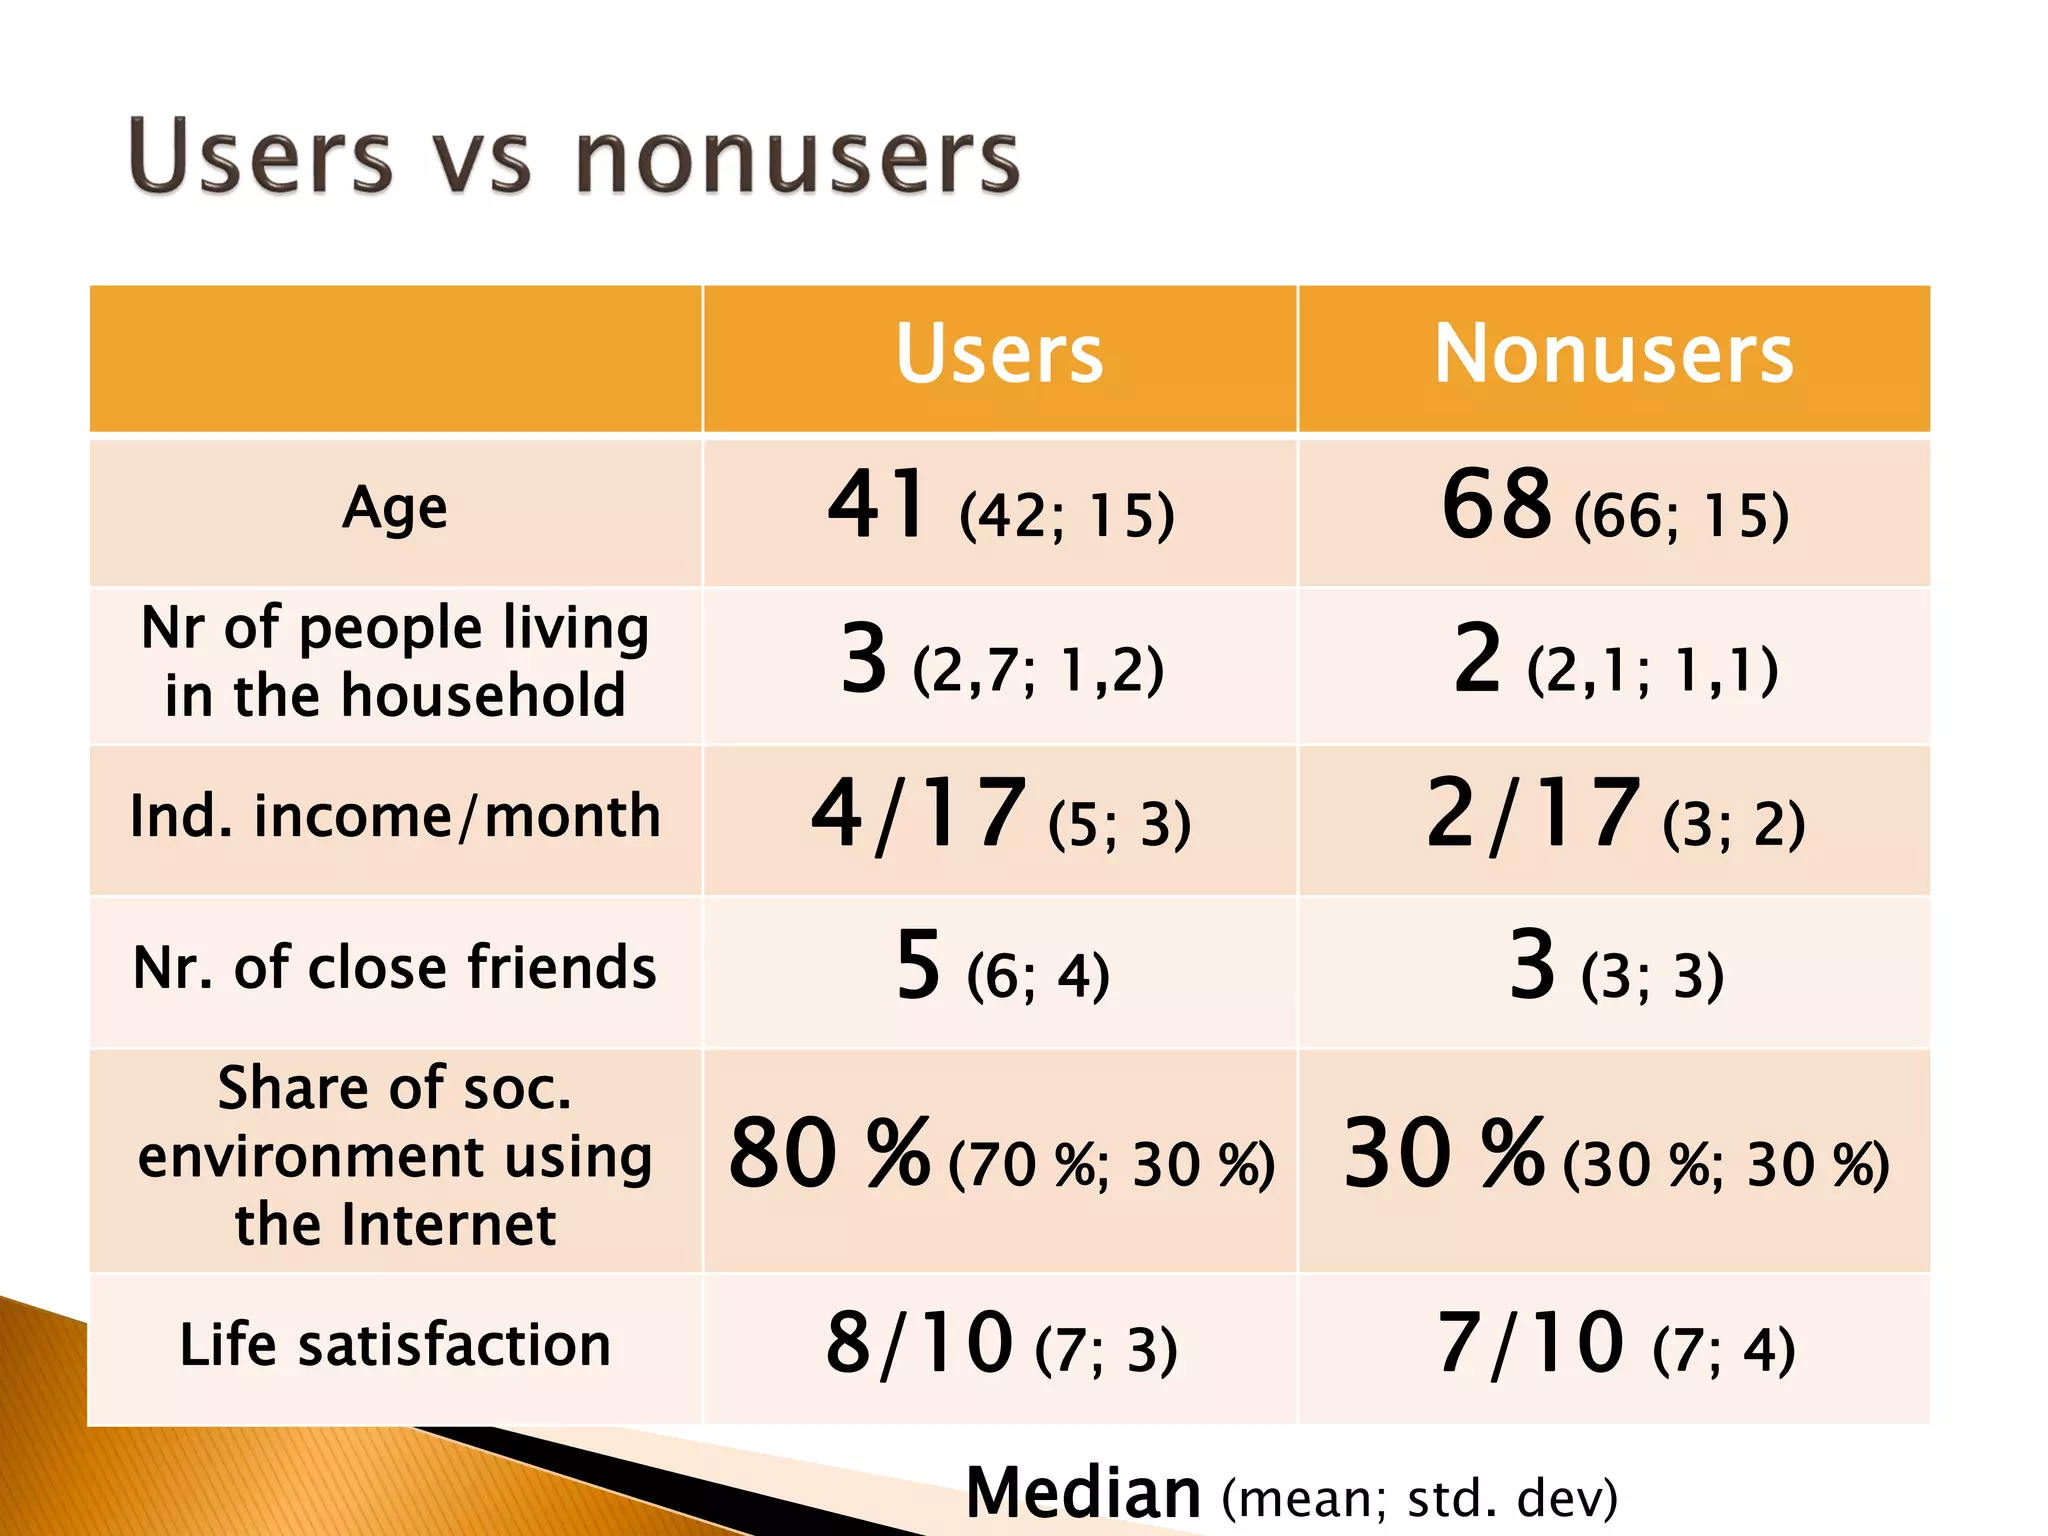
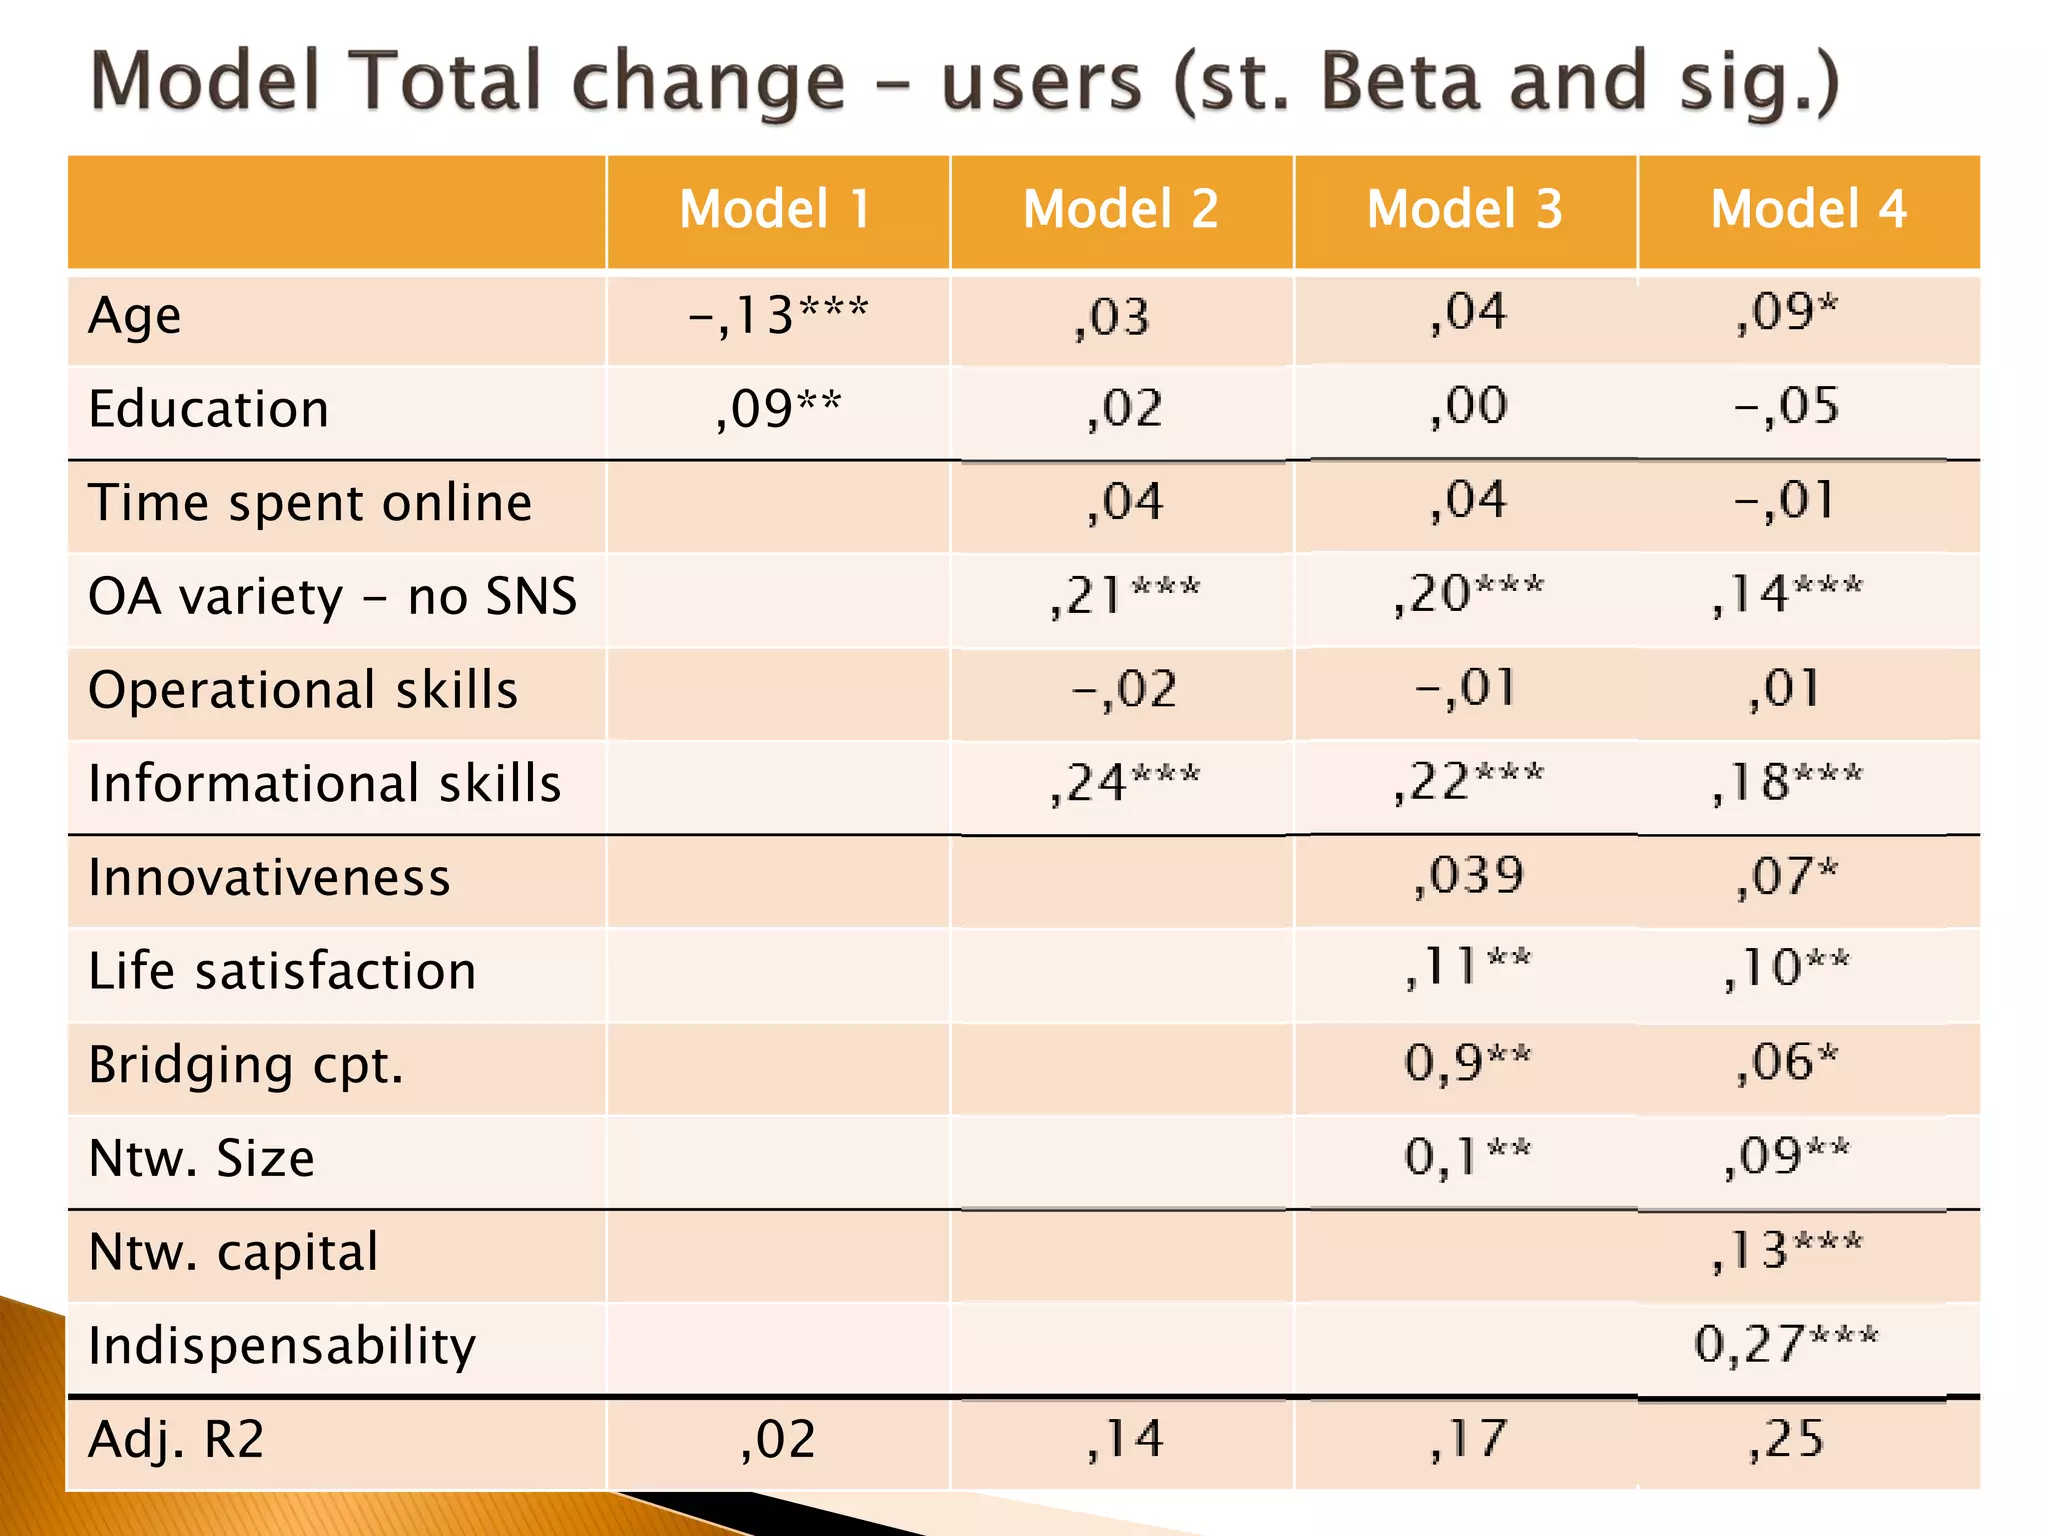
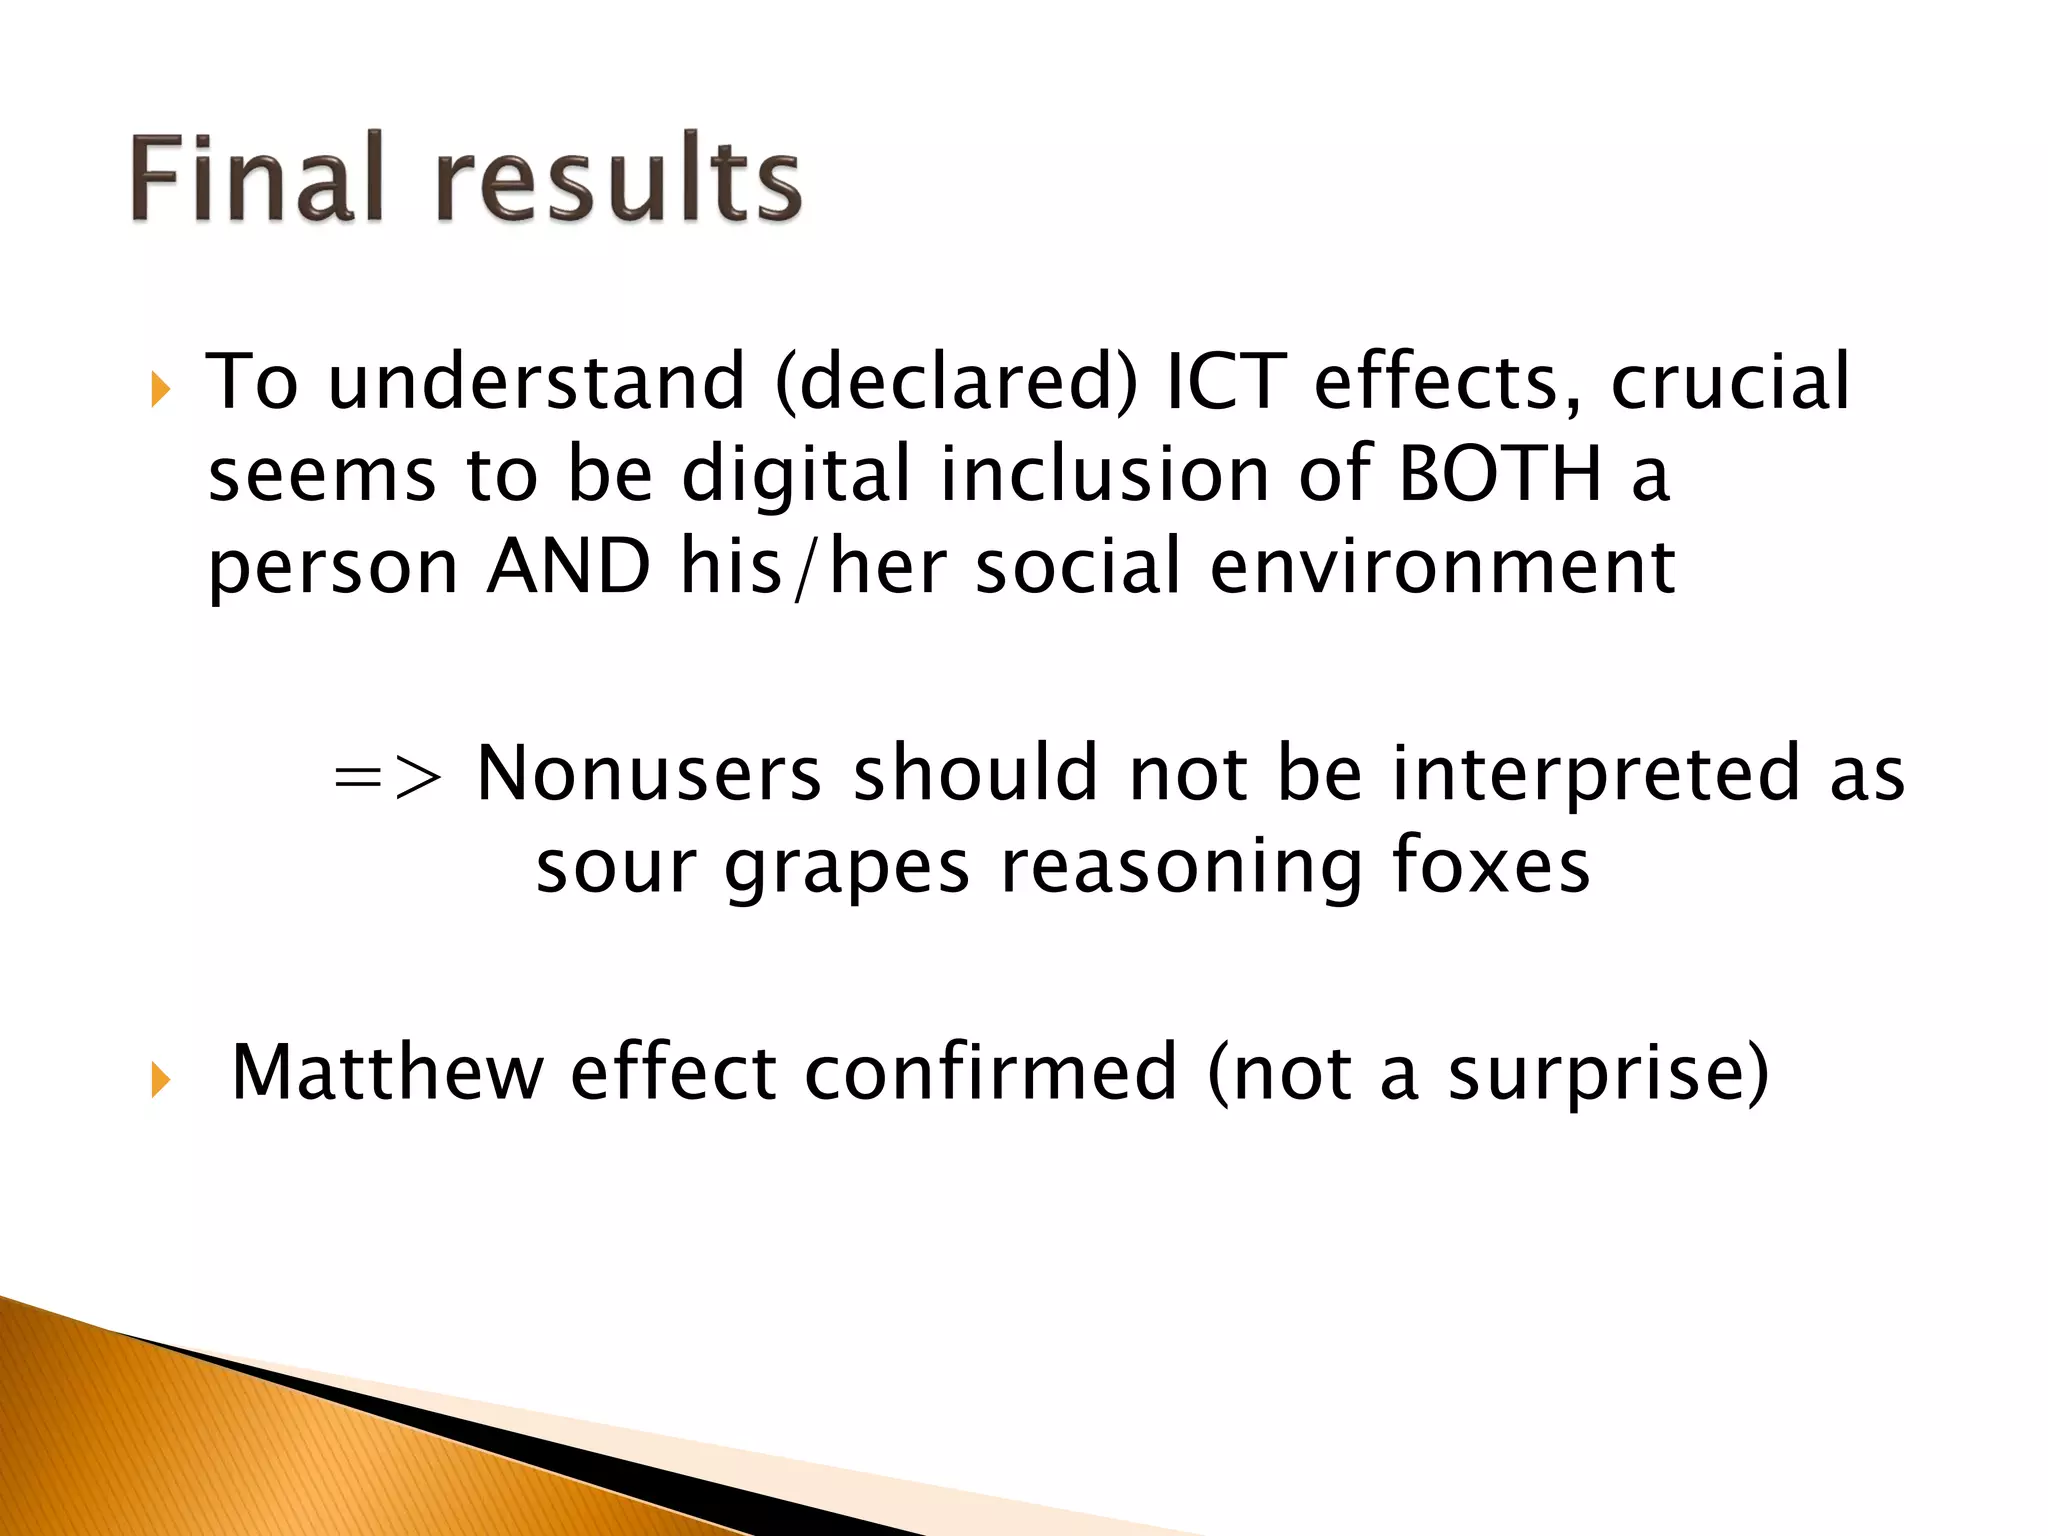
Petr Lupač, Ph.D.
Charles University in Prague
World Internet Project
The Czech Republic
Financed due to Grant Agency of the Czech Republic (GA13-21024S)
„World Internet Project –The Czech Republic II“
System of
social
inequality
Unequal
Internet access
Unequal
gains/losses
The empirical evidence?
VERY WEAK (van Dijk, Helsper)
 No interest/Not useful 25%
 Do not know how to use/Confused by technologies 32%
 No computer or device 20%
 Too expensive/Cannot afford the fees/charges 6%
 No time/Too busy 4%
 Other 13%
 No Internet connection 2%
“sour grapes” reasoning and plain ignorance of the Internet ?
van Dijk (2005: 35)
 2005-2008 project “WIP – Czech Republic”
◦ Assoc. Prof. David Šmahel, Ph.D.
◦ Funded by Ministry of Education
◦ Masaryk University, Brno
 2013-2015 project “WIP – the Czech Republic II”
◦ Petr Lupac,Ph.D., Jan Sladek, M.A.
◦ Charles University in Prague
◦ Funded by the Czech grant agency
◦ Survey in 2014, CAPI, representative for the CZR
 Pilot study in May
 Data collected in May and June 2014 by a specialized agency
 Method of data collection
◦ CAPI F2F interviews
◦ Stratified random sampling combined with quota sampling
◦ Measures taken to include parts of the population with lower probability of being
interviewed
 Respondents declaring no or very low interest in being interviewed pre-recruited from CAWI
panel (cca 8 % of the sample)
 Trained experienced interviewers instructed to deal with soft-rejection
 Financial incentives (computed or estimated from wage)
 100 % of the interviews were recorded, controlled and problematic respondents were
excluded
 1316 respondents in the final sample, 79 % Internet users
 Weighted sample representative for the population of the Czech Republic,
age 15+
 A good fit of results with other data sources (WIP I, CZSO, Facebook)
Problem:
We do not know the share of non-questioned busy people in a
general population -> four steps to balance the sample
I. Weighting 92% of the sample (that was not pre-recruited) to fit the
sociodemographic structure of the Czech population
II. Finding the relations between sociodemographics and Internet
use/nonuse as well as the “pure” percentage of Internet users
III. Resulting Internet use added as a fixing variable to the weighting
procedure
IV. Weighting the whole sample by the following auxiliary variables
 Region (14 categories – NUTS3), Size of municipality (5 categories), Gender
(2 categories), Age (6 categories), Education (4 categories), Age x education
(30 categories), Employment status (6 categories), Attended 2013 elections
(2 categories)
◦ 5 iterations, weighting range: 0,5 – 2,0
WIP Czech Republic, Population 18+
???
Users Nonusers
Age 41 (42; 15) 68 (66; 15)
Nr of people living
in the household 3 (2,7; 1,2) 2 (2,1; 1,1)
Ind. income/month 4/17 (5; 3) 2/17 (3; 2)
Nr. of close friends 5 (6; 4) 3 (3; 3)
Share of soc.
environment using
the Internet
80 % (70 %; 30 %) 30 % (30 %; 30 %)
Life satisfaction 8/10 (7; 3) 7/10 (7; 4)
Median (mean; std. dev)
Users Nonusers
Nr of people living
in the household 2 (1,9; 0,7) 2 (1,7; 0,8)
Ind. income/month 3/17 (4; 3) 2/17 (2; 2)
Nr. of close friends 4 (5; 3) 2 (3; 3)
Share of soc.
environment using
the Internet
70 % (60 %; 30 %) 10 % (20 %; 30 %)
Life satisfaction 7/10 (7; 3) 8/10 (7; 4)
Median (mean; std. dev)
65 % of nonusers do not know anyone (relative or
acquaintance) who could help them set up or solve
technical problem with Internet connection
30 % of nonusers do not know anyone who could
order something for them via the Internet
28 % of nonusers do not know anyone who could
send an email, fill an online form or find something
online for them
31 % of nonusers asked someone to do so at least
several times
Having proxy No proxy
Age 66 (63; 13) 73 (73; 14)
Nr of people living
in the household 2 (2,03; 12) 1 (1,63; 4)
Ind. income/month 2/17 (2; 3) 2/17 (2; 2)
Nr of close friends 3 (4; 3) 1 (2; 3)
Share of soc.
environment using
the Internet
30 % (40 %; 30 %) 0 % (20 %; 30 %)
Life satisfaction 8/10 (7; 3) 6/10 (6; 4)
Median (mean; std. dev)
Question:
Not-using the Internet can be both advantage and
disadvantage. Thinking about your personal
experience in the recent years, how much does the
fact that you are not using the Internet affected
your life in the following areas?
Please, answer with the help of the following scale,
where -5 (minus five) means significant worsening
and +5 (plus five) means significant improvement.
 My knowledge of what's going on in the Czech
republic
 My knowledge of what's going on in other countries
 My knowledge of what's going on in your locality
 My involvement in public life in my local community
 Dealing with state authorities {getting subsidy,
welfare, submitting documents, etc.}
 Contact with my family and my family life
 Contact with my friends and acquiantences
 My overall financial situation (i.e., my incomes and
expenses)
 Building up my career and my success on labour
market
 Pursuing and developing my hobbies
 Overall satisfaction with my life
 Important differences between users and
nonusers are
◦ new-tech efficacy
◦ network capital (ICT in social environment)
 Majority of nonusers declare no worsening of
their life due to Internet nonuse.
 The hypothesis of sour grapes reasoning is
weakened due to negligible differences
between proxy users and completely
disconnected.
 We cannot go on without leaving an
assumption of universal Internet added value.
◦ Internet added value should be understood as
contextual
 We cannot go on without understanding what
explains (preceived) added value among
users, i.e., what is the role of contextual
variables in explanation of Internet added
value
…so, could data about users help us?
 The supposed role of variety/number of online activities and time
spent online (van Dijk 2005)
◦ -> hours online weekly, nr. of online non SNS activities performed weekly
 The important role of digital skills, age and education in gaining
benefits from Internet use (van Deursen, van Dijk and Peters 2011)
◦ -> operational skills index, informational skills index, age, education
 Previous social skills predict well sociability gains from Internet use
(rich-get-richer hypothesis findings; c.f., Lee 2009)
◦ -> ntw size index (via resource generator, sum of strong and weak ties)
 The role of bridging social capital in acquiring resources
◦ -> bridging = bonding * nr. of structural holes
 The role of network capital in explaining individual state (Wellman
and Frank 1999)
◦ -> share of Internet users in respondent’s social environment
 The ability to benefit from technological development (Rogers 2003)
◦ -> innovativeness index
Model 1 Model 2 Model 3 Model 4
Age -,13***
Education ,09**
Time spent online
OA variety - no SNS
Operational skills
Informational skills
Innovativeness
Life satisfaction
Bridging cpt.
Ntw. Size
Ntw. capital
Indispensability
Adj. R2 ,02
 To understand (declared) ICT effects, crucial
seems to be digital inclusion of BOTH a
person AND his/her social environment
=> Nonusers should not be interpreted as
sour grapes reasoning foxes
 Matthew effect confirmed (not a surprise)
Petr Lupač, Ph.D.
PETR.LUPAC@FF.CUNI.CZ
@PetrLupac
Department of Sociology
Charles University in Prague, Faculty of Arts
Celetna 13, Prague
The Czech Republic

Are nonusers socially disadvantaged?

  • 1.
    Petr Lupač, Ph.D. CharlesUniversity in Prague World Internet Project The Czech Republic Financed due to Grant Agency of the Czech Republic (GA13-21024S) „World Internet Project –The Czech Republic II“
  • 3.
  • 4.
     No interest/Notuseful 25%  Do not know how to use/Confused by technologies 32%  No computer or device 20%  Too expensive/Cannot afford the fees/charges 6%  No time/Too busy 4%  Other 13%  No Internet connection 2% “sour grapes” reasoning and plain ignorance of the Internet ? van Dijk (2005: 35)
  • 6.
     2005-2008 project“WIP – Czech Republic” ◦ Assoc. Prof. David Šmahel, Ph.D. ◦ Funded by Ministry of Education ◦ Masaryk University, Brno  2013-2015 project “WIP – the Czech Republic II” ◦ Petr Lupac,Ph.D., Jan Sladek, M.A. ◦ Charles University in Prague ◦ Funded by the Czech grant agency ◦ Survey in 2014, CAPI, representative for the CZR
  • 7.
     Pilot studyin May  Data collected in May and June 2014 by a specialized agency  Method of data collection ◦ CAPI F2F interviews ◦ Stratified random sampling combined with quota sampling ◦ Measures taken to include parts of the population with lower probability of being interviewed  Respondents declaring no or very low interest in being interviewed pre-recruited from CAWI panel (cca 8 % of the sample)  Trained experienced interviewers instructed to deal with soft-rejection  Financial incentives (computed or estimated from wage)  100 % of the interviews were recorded, controlled and problematic respondents were excluded  1316 respondents in the final sample, 79 % Internet users  Weighted sample representative for the population of the Czech Republic, age 15+  A good fit of results with other data sources (WIP I, CZSO, Facebook)
  • 8.
    Problem: We do notknow the share of non-questioned busy people in a general population -> four steps to balance the sample I. Weighting 92% of the sample (that was not pre-recruited) to fit the sociodemographic structure of the Czech population II. Finding the relations between sociodemographics and Internet use/nonuse as well as the “pure” percentage of Internet users III. Resulting Internet use added as a fixing variable to the weighting procedure IV. Weighting the whole sample by the following auxiliary variables  Region (14 categories – NUTS3), Size of municipality (5 categories), Gender (2 categories), Age (6 categories), Education (4 categories), Age x education (30 categories), Employment status (6 categories), Attended 2013 elections (2 categories) ◦ 5 iterations, weighting range: 0,5 – 2,0
  • 9.
    WIP Czech Republic,Population 18+ ???
  • 11.
    Users Nonusers Age 41(42; 15) 68 (66; 15) Nr of people living in the household 3 (2,7; 1,2) 2 (2,1; 1,1) Ind. income/month 4/17 (5; 3) 2/17 (3; 2) Nr. of close friends 5 (6; 4) 3 (3; 3) Share of soc. environment using the Internet 80 % (70 %; 30 %) 30 % (30 %; 30 %) Life satisfaction 8/10 (7; 3) 7/10 (7; 4) Median (mean; std. dev)
  • 13.
    Users Nonusers Nr ofpeople living in the household 2 (1,9; 0,7) 2 (1,7; 0,8) Ind. income/month 3/17 (4; 3) 2/17 (2; 2) Nr. of close friends 4 (5; 3) 2 (3; 3) Share of soc. environment using the Internet 70 % (60 %; 30 %) 10 % (20 %; 30 %) Life satisfaction 7/10 (7; 3) 8/10 (7; 4) Median (mean; std. dev)
  • 14.
    65 % ofnonusers do not know anyone (relative or acquaintance) who could help them set up or solve technical problem with Internet connection 30 % of nonusers do not know anyone who could order something for them via the Internet 28 % of nonusers do not know anyone who could send an email, fill an online form or find something online for them 31 % of nonusers asked someone to do so at least several times
  • 15.
    Having proxy Noproxy Age 66 (63; 13) 73 (73; 14) Nr of people living in the household 2 (2,03; 12) 1 (1,63; 4) Ind. income/month 2/17 (2; 3) 2/17 (2; 2) Nr of close friends 3 (4; 3) 1 (2; 3) Share of soc. environment using the Internet 30 % (40 %; 30 %) 0 % (20 %; 30 %) Life satisfaction 8/10 (7; 3) 6/10 (6; 4) Median (mean; std. dev)
  • 16.
    Question: Not-using the Internetcan be both advantage and disadvantage. Thinking about your personal experience in the recent years, how much does the fact that you are not using the Internet affected your life in the following areas? Please, answer with the help of the following scale, where -5 (minus five) means significant worsening and +5 (plus five) means significant improvement.
  • 17.
     My knowledgeof what's going on in the Czech republic  My knowledge of what's going on in other countries  My knowledge of what's going on in your locality  My involvement in public life in my local community  Dealing with state authorities {getting subsidy, welfare, submitting documents, etc.}  Contact with my family and my family life  Contact with my friends and acquiantences  My overall financial situation (i.e., my incomes and expenses)  Building up my career and my success on labour market  Pursuing and developing my hobbies  Overall satisfaction with my life
  • 19.
     Important differencesbetween users and nonusers are ◦ new-tech efficacy ◦ network capital (ICT in social environment)  Majority of nonusers declare no worsening of their life due to Internet nonuse.  The hypothesis of sour grapes reasoning is weakened due to negligible differences between proxy users and completely disconnected.
  • 20.
     We cannotgo on without leaving an assumption of universal Internet added value. ◦ Internet added value should be understood as contextual  We cannot go on without understanding what explains (preceived) added value among users, i.e., what is the role of contextual variables in explanation of Internet added value …so, could data about users help us?
  • 22.
     The supposedrole of variety/number of online activities and time spent online (van Dijk 2005) ◦ -> hours online weekly, nr. of online non SNS activities performed weekly  The important role of digital skills, age and education in gaining benefits from Internet use (van Deursen, van Dijk and Peters 2011) ◦ -> operational skills index, informational skills index, age, education  Previous social skills predict well sociability gains from Internet use (rich-get-richer hypothesis findings; c.f., Lee 2009) ◦ -> ntw size index (via resource generator, sum of strong and weak ties)  The role of bridging social capital in acquiring resources ◦ -> bridging = bonding * nr. of structural holes  The role of network capital in explaining individual state (Wellman and Frank 1999) ◦ -> share of Internet users in respondent’s social environment  The ability to benefit from technological development (Rogers 2003) ◦ -> innovativeness index
  • 23.
    Model 1 Model2 Model 3 Model 4 Age -,13*** Education ,09** Time spent online OA variety - no SNS Operational skills Informational skills Innovativeness Life satisfaction Bridging cpt. Ntw. Size Ntw. capital Indispensability Adj. R2 ,02
  • 24.
     To understand(declared) ICT effects, crucial seems to be digital inclusion of BOTH a person AND his/her social environment => Nonusers should not be interpreted as sour grapes reasoning foxes  Matthew effect confirmed (not a surprise)
  • 25.
    Petr Lupač, Ph.D. PETR.LUPAC@FF.CUNI.CZ @PetrLupac Departmentof Sociology Charles University in Prague, Faculty of Arts Celetna 13, Prague The Czech Republic