This study examines the factors influencing individuals' participation in social networking sites (SNS) using an extended Technology Acceptance Model (TAM) that incorporates 'perceived social capital.' The analysis of data from 657 participants reveals that perceived social capital significantly impacts both usage behavior and attitudes towards SNS, explaining 56% of variance in participation intentions. The findings highlight the crucial role of social capital in enhancing user engagement and provide insights for improving SNS adoption strategies.
![International Journal of Computer Science & Information Technology (IJCSIT) Vol 7, No 4, August 2015
DOI:10.5121/ijcsit.2015.7409 105
APPLYING THE TECHNOLOGY ACCEPTANCE
MODEL TO UNDERSTAND SOCIAL NETWORKING
SITES (SNS) USAGE: IMPACT OF PERCEIVED SOCIAL
CAPITAL
Waleed Al-Ghaith
Department of Information Systems, Shaqra University, Riyadh, Saudi Arabia
ABSTRACT
This study examines the individuals’ participation intentions and behaviour on Social Networking Sites
(SNSs). For this purpose, the Technology Acceptance Model (TAM) is utilized and extended in this study
through the addition of “perceived social capital” construct aiming to increase its explanatory power and
predictive ability in this context. Data collected from a survey of 1100 participants and distilled to 657
usable sets has been analysed to assess the predictive power of proposed model via structural equation
modelling. The model proposed in this study explains 56% of the variance in “Participation Intentions”
and 55% of the variance in “Participation Behaviour”. Participation of behavioural intention in the model’
explanatory power was the highest amongst the constructs (able to explain 28% of usage behaviour).
While, “Attitude” explain around 11% of SNSs usage behaviour. The study findings also show that
“Perceived Social Capital” construct has a notable impact on usage behaviour, this impact came indirectly
through its direct effect on “Attitude” and “Perceived Usefulness”. Participation of “Perceived Social
Capital” in the models' explanatory power was the third highest amongst the constructs. “Perceived Social
Capital”, alone explain around 9% of SNSs usage behaviour.
KEYWORDS
Adoption, Perceived Social Capital, Social networking sites, Technology Acceptance Model, Usage.
1. INTRODUCTION
The Internet, since its introduction, has facilitated a different forms of social interaction and
activities through the World Wide Web (WWW) or Web 1.0 inventions such as personal web
pages. Within Web 1.0, the vast majority of users simply acting as consumers of content. Later,
Web 1.0 has been altered to Web 2.0 Websites which represents the movement forward one step
from publishing to participation. In fact, Web 2.0 Websites including video sharing sites such as
YouTube and social networking sites like Twitter and Facebook refers to the second generation of
the WWW that facilitates collaboration and information sharing [4].
In last years, we have witnessed the rapid growth of online social networking services (SNSs),
which support interpersonal communication and collaboration using Internet-based platforms.
Due to this popularity and its impact on individuals’ daily lives, the SNSs have captured the
attention of researchers [34].
Scholars have studied SNS using a diversity of methodologies from multiple disciplines. They
have conducted studies, for instance, on the basis of industry competition dynamics [16] and
building of social relationships through online social networks [15]. Thus, this study
systematically examines what factors contribute to SNS usage.](https://image.slidesharecdn.com/applyingthetechnologyacceptance-150911062906-lva1-app6892/75/APPLYING-THE-TECHNOLOGY-ACCEPTANCE-MODEL-TO-UNDERSTAND-SOCIAL-NETWORKING-1-2048.jpg)
![International Journal of Computer Science & Information Technology (IJCSIT) Vol 7, No 4, August 2015
106
The current study’ topic matches to one of the five core research areas which forming the
information systems discipline as identified by Sidorova, et al., [29]: (1) Information technology
and organizations, (2) Information technology systems development, (3) Information technology
and individuals, (4) Information technology and markets, and (5) Information technology and
groups.
The information technology and individuals, as a research area, studies primarily psychological
aspects of human computer interactions, focusing on research themes such as individual
technology acceptance, information technology adoption, HR issues in IS, computer self-efficacy,
trust, and website design. Therefore, this study represents a mainstream area of information
systems research, contributing to the development of the discipline.
This study participates in this effort, theoretically and practically, by adopting the Technology
Acceptance Model (TAM) as a base model which is the most widely used and validated model
and have been applied in several research discipline across various technologies [31]. In order to
effectively predict participation in SNSs, this study develops a theoretical framework by
extending TAM, including the addition of perceived social capital, to provide a better
understanding of SNS acceptance and usage in Saudi Arabia. Data collected from a survey of
1100 participants and distilled to 657 usable sets has been analysed to assess the predictive power
of TAM model via structural equation modelling.
The paper proceeds as follows. In section 2, we review the theoretical model; TAM, Social
Capital and presents the proposed hypotheses along with the study model. In section 3, the
methods of analysis are presented. The results of the study are then presented in Section 4.
Thereafter, an equation has been formulated and used to calculate the participation of every
model’s construct in the model’s explanatory power is presented along with a discussion of the
results in Section 5. Section 6 is devoted to highlight the implications of the current study to
theory and practice. Section 7 highlights the study limitations and links it with future research
avenues.
2. RESEARCH MODEL AND HYPOTHESES DEVELOPMENT
2.1. Perceived Social Capital
Social capital has been defined in various ways from variety of perspectives. It can be defined by
its function for instance information channels, obligations and expectations [9]. Social capital also
can be seen as features of social life such as norms, trust and networks which allowing individuals
to perform sort of action together in an efficient way [28]. To summarize, social capital is the
resources and benefits that can be made from engaging in social networks and utilizing relations
that has been built through interactions among participants in that networks [9].
Social capital can be categorized to two categories, namely cognitive and structural. Cognitive
category is more related to personal aspects (e.g. attitudes, beliefs, norms and values). The
structural category represents the solidity of social relationship and measurement to level of social
interactions [18].
Cognitive social capital, in it is turn, can be broken into three parts, namely bridging, bonding
[27] and maintained social capital [15]. Bridging part of cognitive social capital reflects external
relationships between individuals [1] and can be consider as a ‘weak ties’ relations [27] or “loose
connections” among persons by which individuals can provide opinions or information without
emotional or personal relation. While, bonding part of cognitive social capital represents close
associations individuals might have with family members, close friends and other close relations](https://image.slidesharecdn.com/applyingthetechnologyacceptance-150911062906-lva1-app6892/75/APPLYING-THE-TECHNOLOGY-ACCEPTANCE-MODEL-TO-UNDERSTAND-SOCIAL-NETWORKING-2-2048.jpg)
![International Journal of Computer Science & Information Technology (IJCSIT) Vol 7, No 4, August 2015
107
and focus on internal ties between actors in which emotional support is exchanged. The third part
of cognitive social capital called ‘Maintained social capital’ [15] which represents individuals’
ability to maintain relationships to their prior social networks.
Social capital has been presented to be a predictor of school attrition, academic performance,
physical and mental health, sources of employment, and economic development ([24], [15]).
Recently, Social capitals have been examined in the context of SNS. Ellison, et al. [14] found that
online social networks can build and support individuals social capital and help in maintaining
social capital with higher bonding and bridging levels. While, Lu and Lee study [22] has shown
knowledge capital and social capital can encourage continuous sharing behaviour. Moreover,
Guo, et al. [17] conduct a study to explore the predicted effect of Social Networking Site use on
Perceived Social Capital, and they found that SNS use for social and informational functions
increased individuals’ levels of perceived bridging social capital. Generally and regarding to
interaction among individuals, increase levels of social capital cause a general commitment to
collective action and that has a significant positive influence on interaction [15]. Thus, the
following hypotheses are proposed:
Hypothesis 1. User perceived social capital will positively influence user perceived usefulness.
Hypothesis 2. User perceived social capital will positively influence user attitude.
2.2. Technology Acceptance Model (TAM)
TAM was proposed by Davis [10] to explain and predict users’ adoption/acceptance or rejection
of IT ([10], [11]). TAM is conceptually based on TRA [3], which specifies two behavioural
beliefs, perceived usefulness and perceived ease of use, as determinants of attitude towards
behavioural intentions and IT usage behaviour [8]. In TAM, behavioural intention to use, leads to
actual IT usage behaviour. Behavioural intention is determined jointly by attitude and perceived
usefulness, where perceived usefulness also affects attitude directly. Meanwhile, perceived ease
of use directly influences both attitude and perceived usefulness [13]. Perceived usefulness is
defined as “the degree to which a person believes that using a particular system would enhance
his or her job performance”, while the perceived ease of use is defined as “the degree to which a
person believes that using a particular system would be free of effort” [10]. According to Wiley-
Patton [32] researchers attribute the strength of TAM to its ubiquitous applicability. In TAM,
beliefs about ease of use and usefulness are always the most important determinants of intention
to use, and this belief set is “readily generalized to different computer systems and user
populations" [10]. Other models such as TRA and TPB use beliefs sets that are specific to each
situation making it difficult to apply them across various users’ context [32]. Whereas TAM’s
constructs are measured in the same way in every situation ([23], [31], [32]). Due to its ubiquitous
applicability and mainly to its parsimony, TAM has become the most preferable and popular
model and has been widely used in a range of IT acceptance studies [8]. Although the parsimony
of TAM is seen as one of its strengths, it is also considered a limitation [31]. TAM with its two
original constructs, perceived usefulness and perceived ease of use, is able to provide some
predictive information however, that information is not considered enough to assist designers to
predict acceptances for a new system [23]. Scholars have criticized TAM and showed that many
theoretical constructs, found important in predicting technology acceptance, are ignored and
excluded. For example, TAM does not explicitly include any social variables [7] or individual
characteristics which can have a significant influence on TAM estimates [13] or even influence
how TAM constructs are related [25]. Thus, the current study extends TAM by including
perceived social capital and suggests that perceived social capital is significant determinants of
SNS acceptance and use. Therefore, the study hypotheses were developed based on TAM model
hypotheses (see Fig. 1).](https://image.slidesharecdn.com/applyingthetechnologyacceptance-150911062906-lva1-app6892/75/APPLYING-THE-TECHNOLOGY-ACCEPTANCE-MODEL-TO-UNDERSTAND-SOCIAL-NETWORKING-3-2048.jpg)
![International Journal of Computer Science & Information Technology (IJCSIT) Vol 7, No 4, August 2015
108
Hypothesis 3. User perceived ease of use will positively influence user perceived usefulness.
Hypothesis 4. User perceived ease of use will positively influence user attitude.
Hypothesis 5. User perceived usefulness of use will positively influence user attitude.
Hypothesis 6. User perceived usefulness of use will positively influence user behavioural
intention.
Hypothesis 7. User Attitude will positively influence user behavioural intention.
Hypothesis 8. User behavioural intention will positively influence user behaviour.
Figure 1. The study model
3. METHODOLOGY
3.1. Measurement
Identifying the concepts or constructs that a researcher intents to measure, and then choose
appropriate measuring systems to measure those constructs is essential and has a significant
impact on the accuracy of findings [36]. The items used in the survey instrument to measure the
constructs were identified and adopted from prior research; particularly from IS research, in order
to ensure the face (content) validity of the scale used. The items were widely used in the majority
of prior studies indicating potential subjective agreement among researchers that these measuring
instruments logically appear to reflect accurate measure of the constructs of interest. Table 1 lists
the items developed for each construct in this study as well as set of prior studies where these
items have been adopted from.
Table 1: List of items by construct
Construct Items Adapted from
Behavioural
intention
(BI)
BI1. I intend to use SNS website in next three months.
BI2. I expect my use of the SNS website to continue in
the future.
[30], [26], [4].
Perceived
Ease of Use
(EU)
EU1. Learning to use SNS was easy for me
EU2. I find SNS easy to use
EU3. English language is not a barrier when I use SNS
[30], [26].](https://image.slidesharecdn.com/applyingthetechnologyacceptance-150911062906-lva1-app6892/75/APPLYING-THE-TECHNOLOGY-ACCEPTANCE-MODEL-TO-UNDERSTAND-SOCIAL-NETWORKING-4-2048.jpg)
![International Journal of Computer Science & Information Technology (IJCSIT) Vol 7, No 4, August 2015
109
Attitude
(AT)
AT1. I have positive opinion in SNS website.
AT2. I think usage of SNS website is good for me
AT3. I think usage of SNS website is appropriate for me
[10], [2], [4].
Perceived
usefulness
(PU)
PU1. SNS is more convenient than other traditional social
networks options
PU2. SNS makes it easier to find information and people.
PU3. SNS improves my information and people seeking
PU4. SNSs help me to find information more quickly
PU5. I think that SNSs is useful. Overall, I think that
using the SNSs is advantageous.
[30], [26], [21].
Perceived
Social Capital
(SC)
SC1. SNSs make it easier to develop social relationship
(networking).
SC2. SNSs improve my social relationship (networking).
SC3. SNSs enhance my effectiveness in building social
relationship.
SC4. SNSs help me to build social relationship more
quickly.
SC5. I find SNSs useful in my social relationship.
[21]
SNS Usage
(US)
US1. On average, each week I use my SNS website often
US2. For each log session, I use my SNS web site long
US3. On my SNS, I often post something
US4. On my SNS, I often view something
US5. On my SNS, I often share something
US6. On my SNS, I often reply to others
[5], [33].
3.2. Data Collection Procedures
Data for this study were collected in two stages (6 months apart), from samples stratified into
gender groups, by means of a survey conducted in Saudi Arabia in 2014. This type of sampling
technique has been chosen due to the difficulty of drawing an actual representative sample in
Saudi Arabia. Most houses in Saudi Arabia have not their own mail boxes and postal services are
not available for every house. Moreover, due to the conservative nature of Saudi Arabian society,
it is hard to approach women in Saudi Arabia. Therefore, stratified samples were drawn from
numerous areas in the country. Female relatives were also engaged to distribute questionnaires to
the female strata besides using electronic means to guarantee reaching females as well as males.
The survey questionnaires were distributed to 1100 participants (550 male and 550 female). A
total of 421 responses were received from male participants and 367 from female participants.
After checking the data for validity, 657 were deemed fit for use in the analysis.
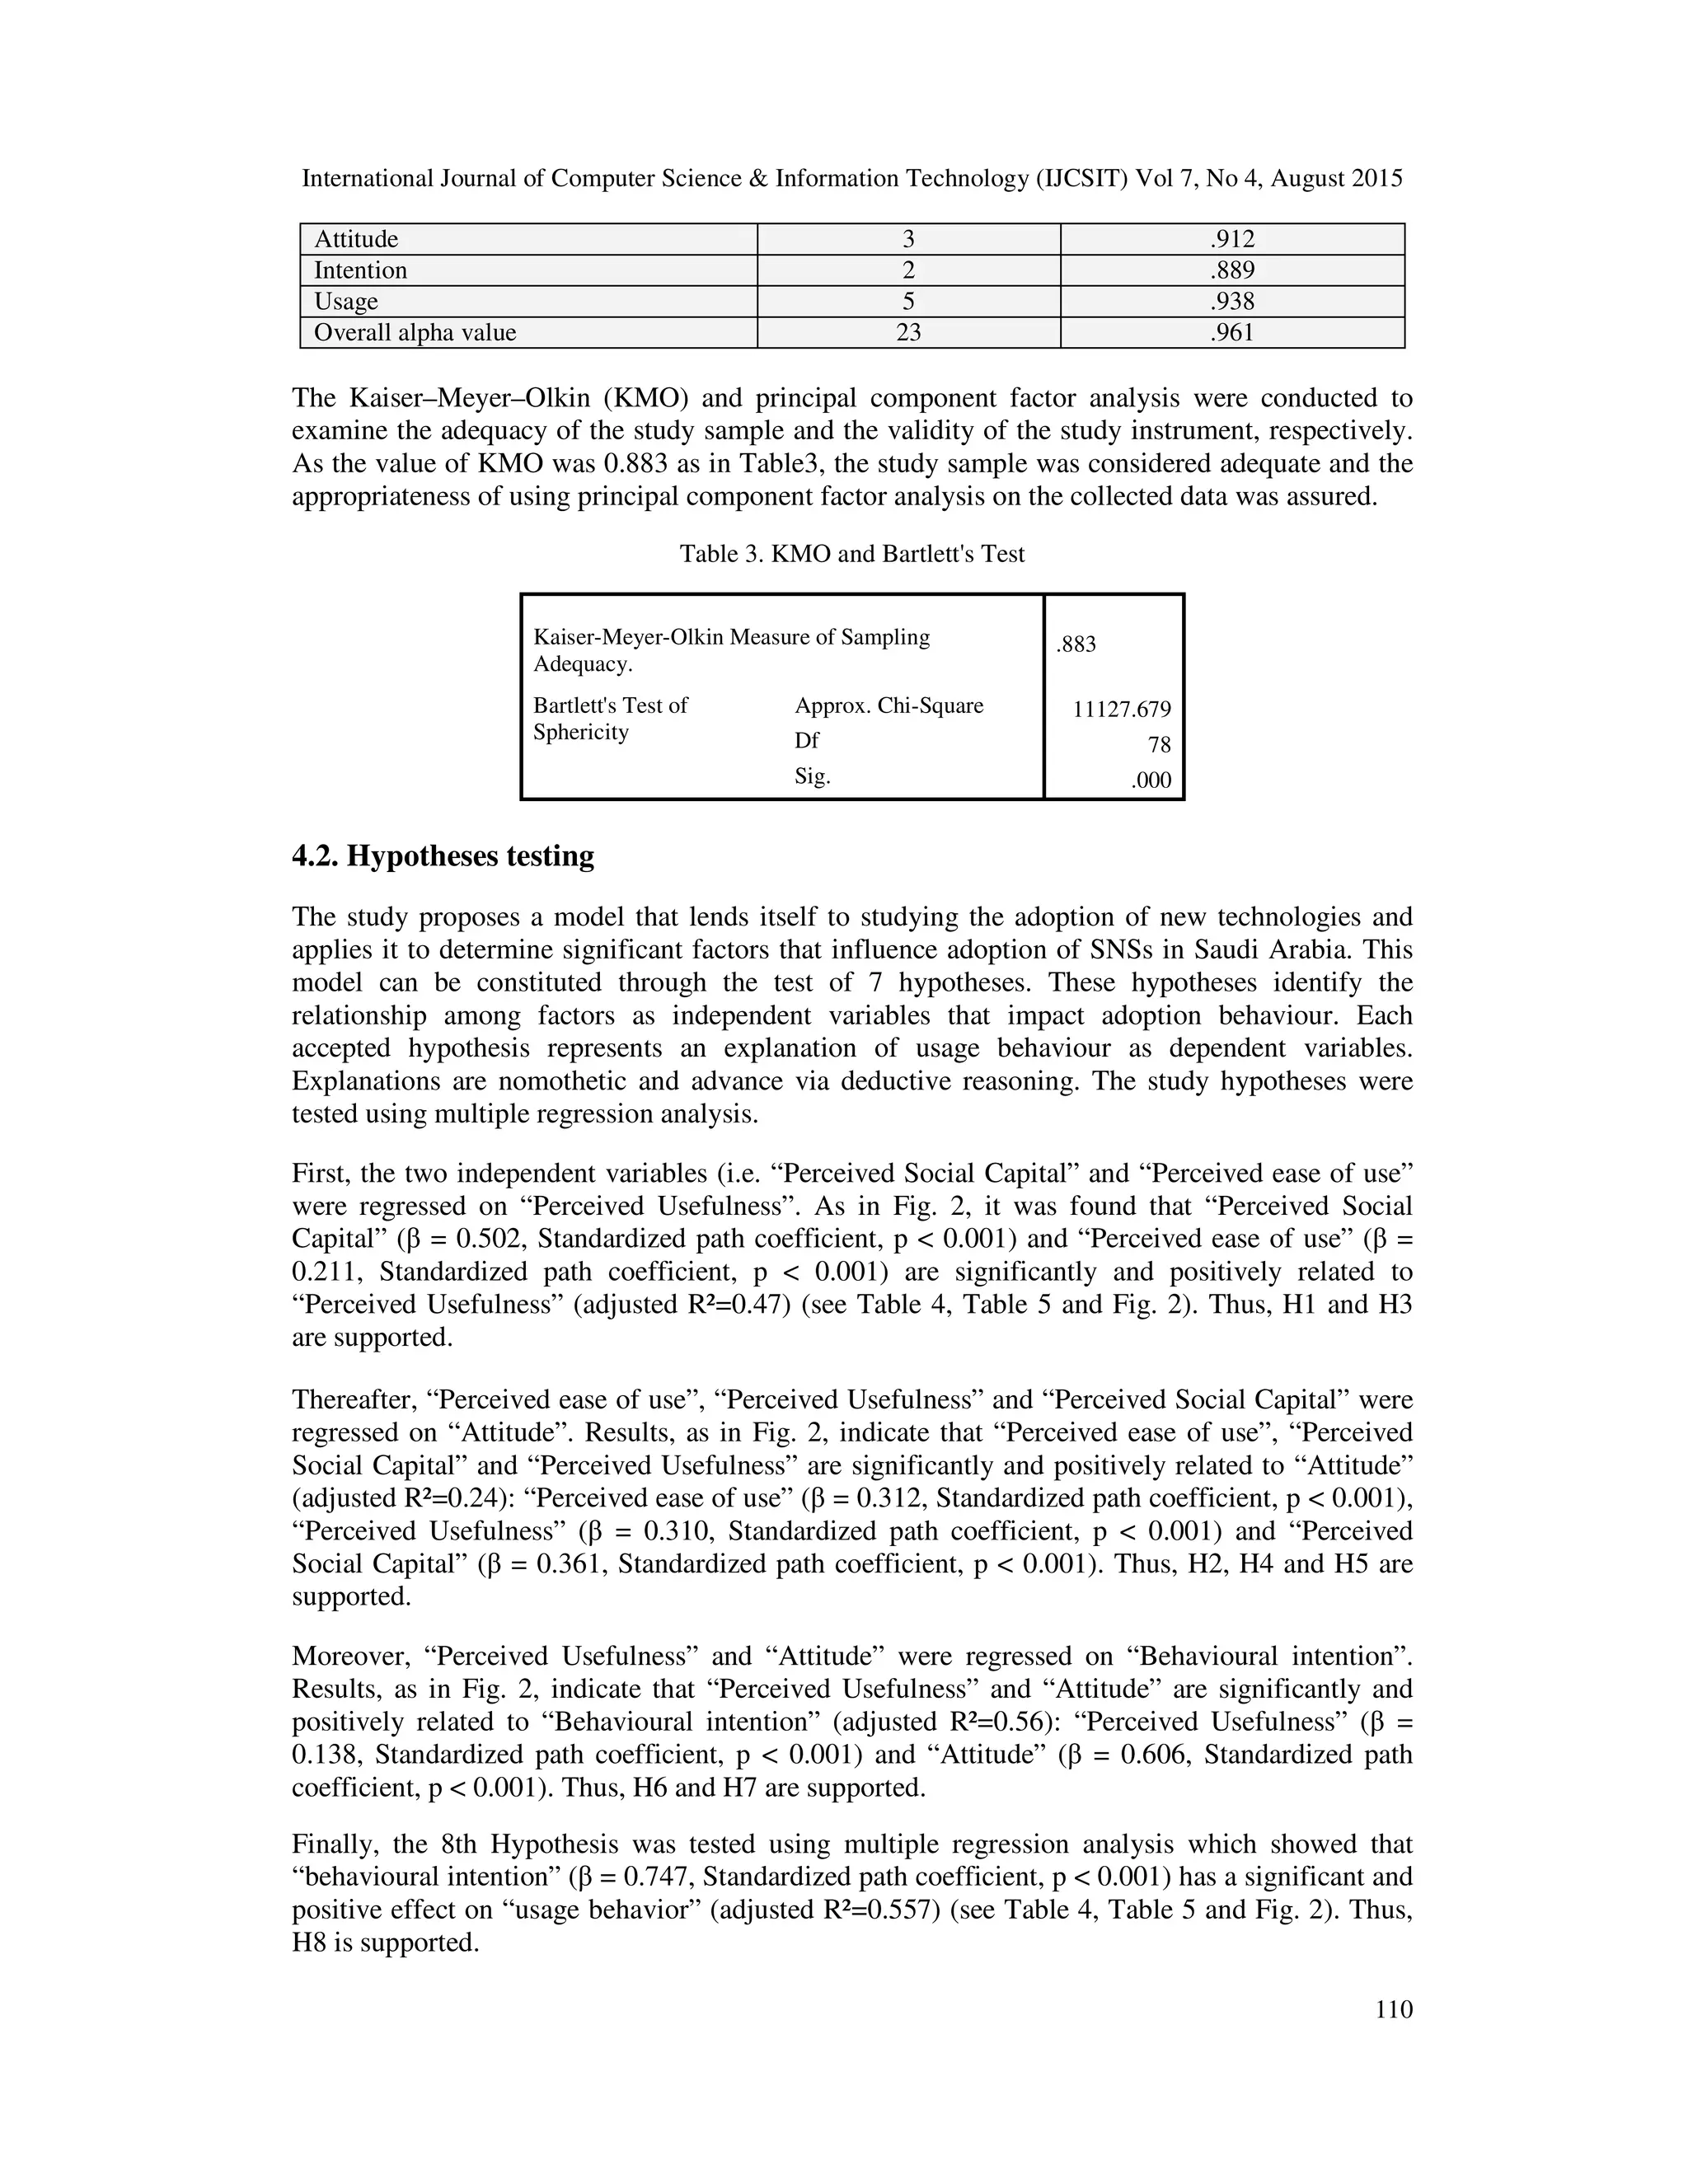
4. DATA ANALYSIS AND RESULTS
4.1. Reliability and validity
Table 2 Cronbach's Alpha Reliability of Constructs in the Study
Construct Number of Items Cronbach's Alpha
Perceived Social Capital 5 .962
Perceived Ease of Use 3 .905
Perceived usefulness 5 .927](https://image.slidesharecdn.com/applyingthetechnologyacceptance-150911062906-lva1-app6892/75/APPLYING-THE-TECHNOLOGY-ACCEPTANCE-MODEL-TO-UNDERSTAND-SOCIAL-NETWORKING-5-2048.jpg)
![International Journal of Computer Science & Information Technology (IJCSIT) Vol 7, No 4, August 2015
112
Fig. 2. The study results
5. DISCUSSION
The aim of the study is to understand why people can adopt SNSs. In other words, this study is an
effort to extend our understanding of the factors behind the adoption of SNSs in Saudi Arabia.
This study confirms the importance of the social aspects and characteristics in forming
individuals’ intentions and their SNSs usage behaviour. Moreover, this study comes to help in
covering the gap of research in Saudi Arabia on how users of SNSs based on their behavioural
effects intend to adopt SNS. For this purpose, the technology acceptance model is applied and
extended through the adding of “perceived social capital” construct in order to rise its explanatory
power and enhance its predictive ability in the context of the study.
The study finding asserts that participation behaviour on SNSs determined by “participation
intention” which in turn is determined by individuals' “attitude” and “perceived usefulness”. The
model adopted in this study explains 56% of the variance in “Participation Intentions” and 55% of
the variance in “Participation Behaviour”.
The results show that “participation intention” is significantly and positively related to
“participation behaviour” in the SNS context. Indeed, such a strong relation among the
behavioural intention and behaviour constructs concurs with many prior studies such as Taylor
and Todd [30] study, according to their research, "behavioural intention plays an important
substantive role, but is also important pragmatically in predicting behaviour" [30]. Likewise, De
Guinea and Markus [12] indicate that IT use behaviour is the result of conscious, cognitive
behavioural intention. The importance of behavioural intention towards usage behaviour is also
reported in other study to understand online community user participation by Zhou [35].
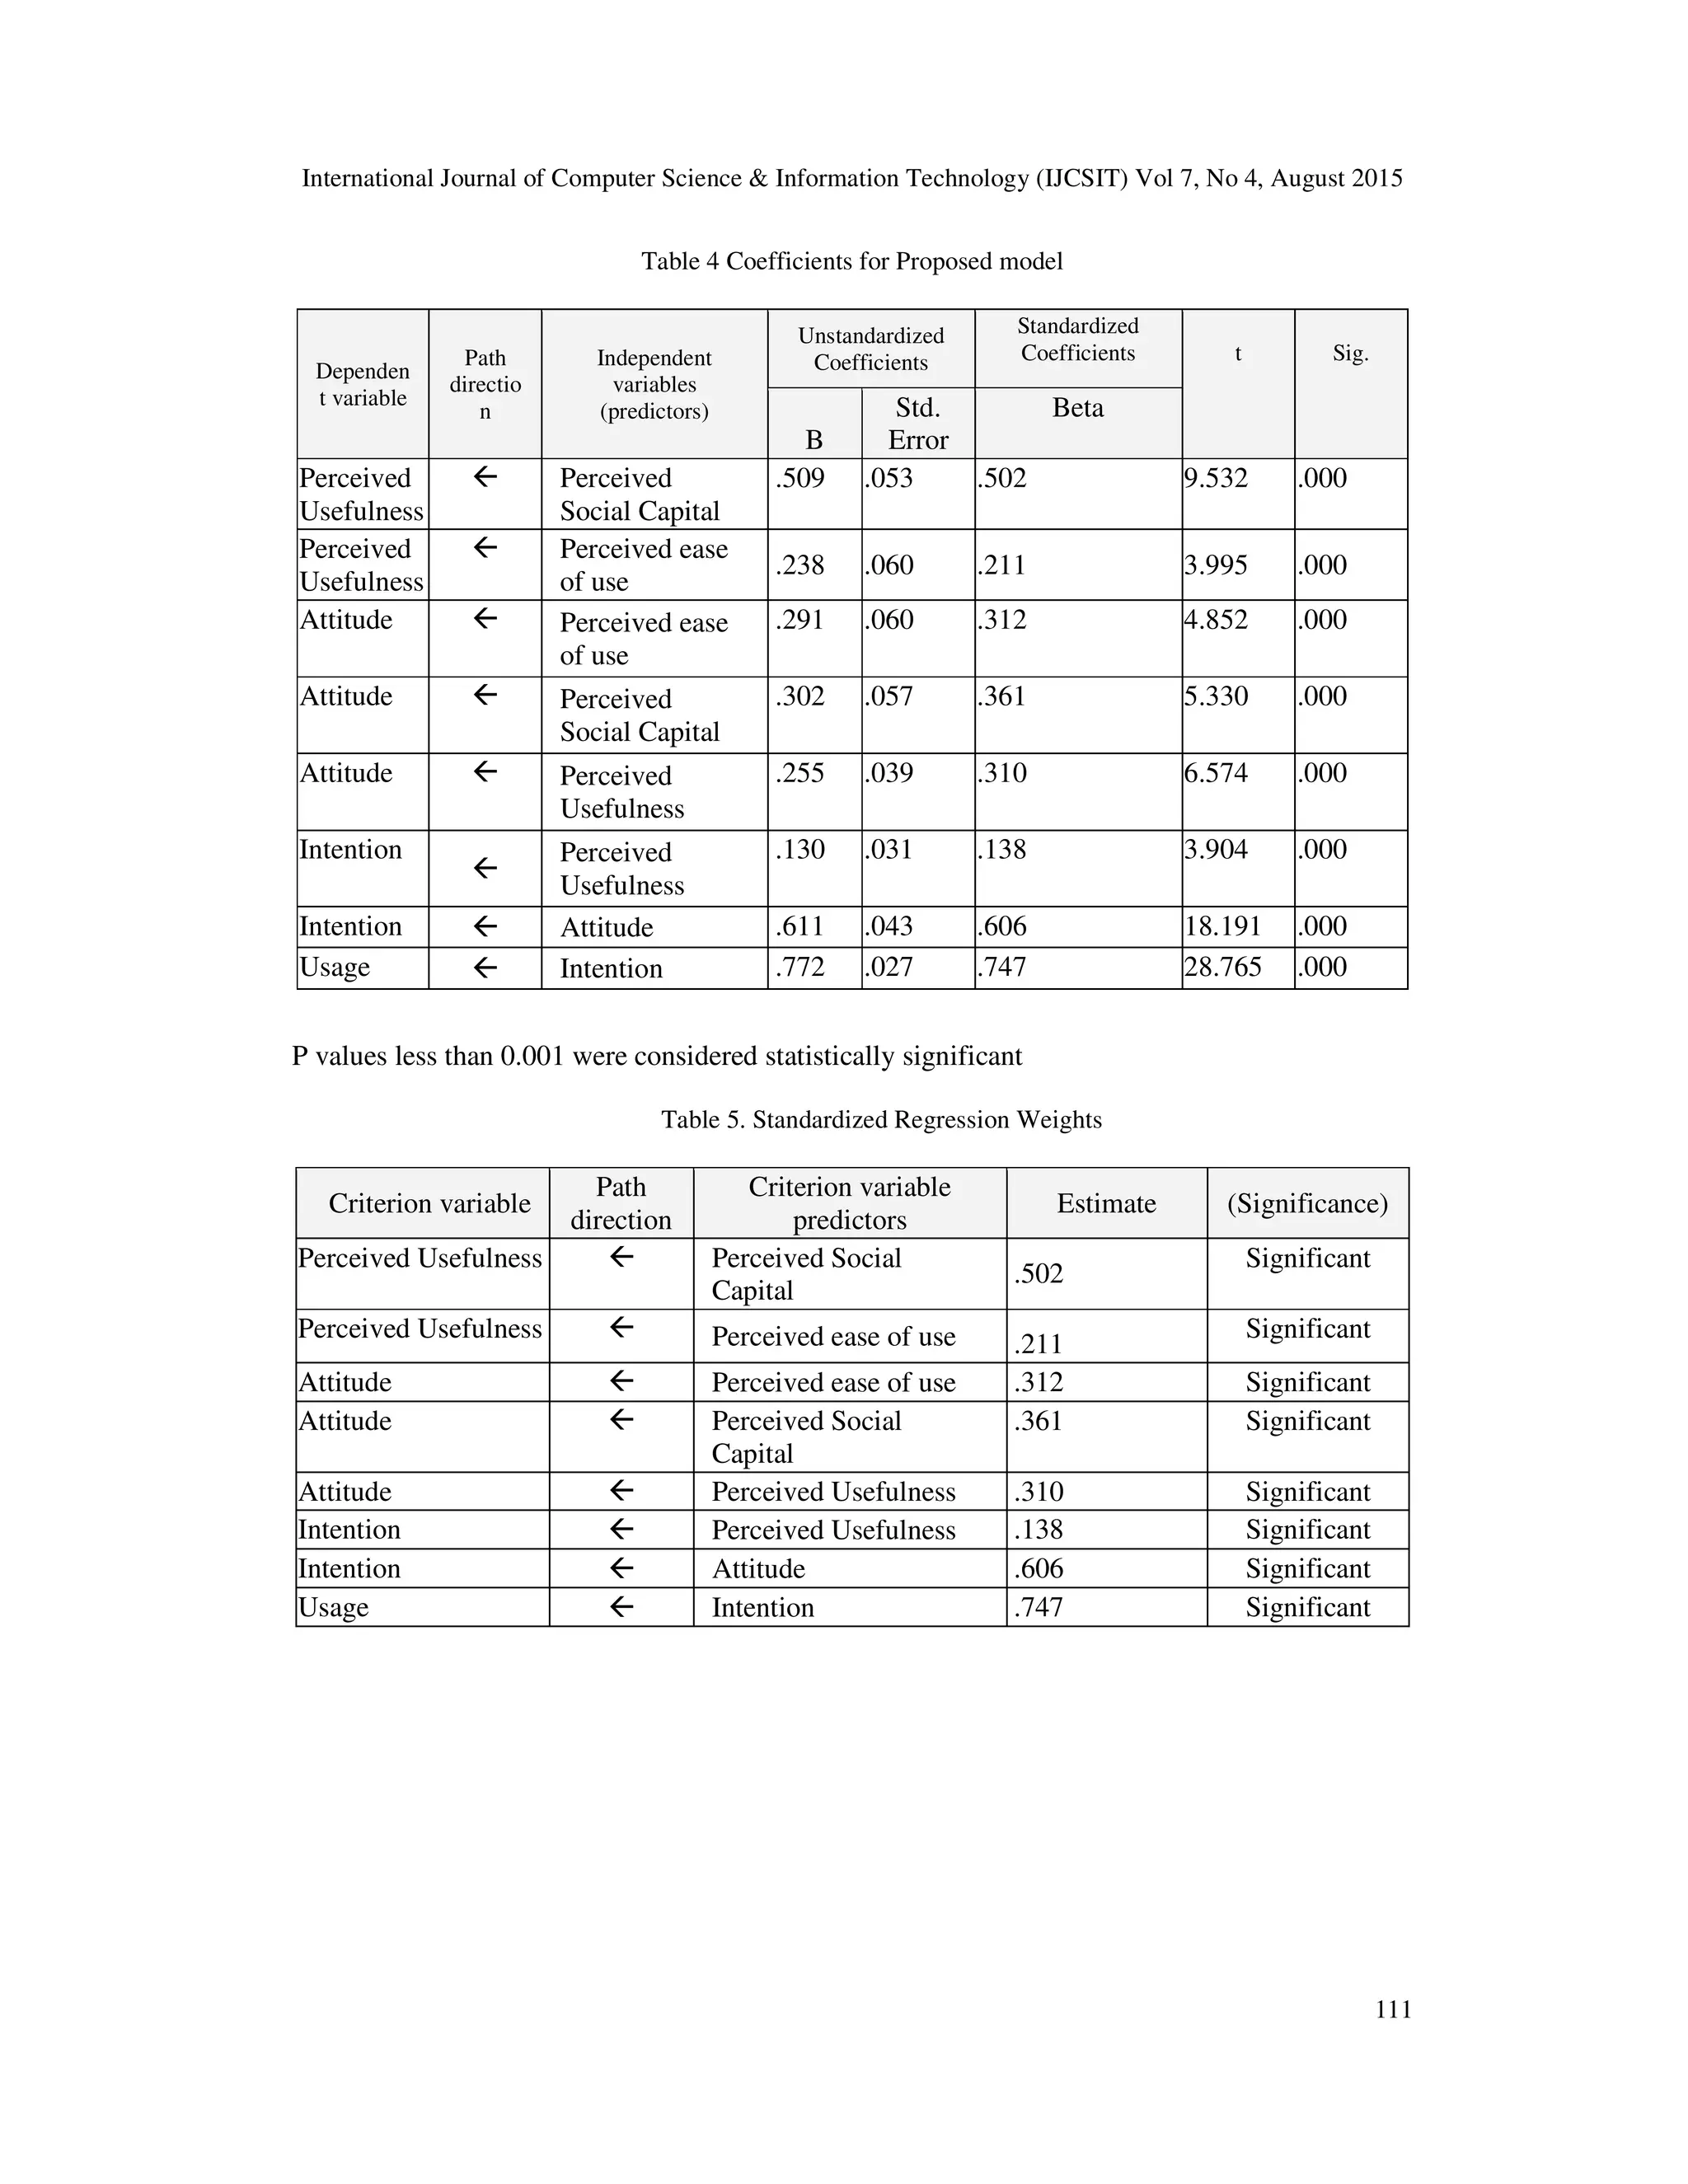
The study results show that “Perceived ease of use”, “Perceived Social Capital” (β = 0.361,
Standardized path coefficient, p < 0.001) and “Perceived Usefulness” are significantly and
positively related to “Attitude” (adjusted R²=0.24) (see Table 4, Table 5 and Fig. 2). Moreover, it
was found that “Perceived Social Capital” (β = 0.502, Standardized path coefficient, p < 0.001)
and “Perceived ease of use” (β = 0.211, Standardized path coefficient, p < 0.001) are significantly
and positively related to “Perceived Usefulness” (adjusted R²=0.47).](https://image.slidesharecdn.com/applyingthetechnologyacceptance-150911062906-lva1-app6892/75/APPLYING-THE-TECHNOLOGY-ACCEPTANCE-MODEL-TO-UNDERSTAND-SOCIAL-NETWORKING-8-2048.jpg)
![International Journal of Computer Science & Information Technology (IJCSIT) Vol 7, No 4, August 2015
113
5.1. Understanding Behaviour
The proposed model able to explain 55% of SNSs usage behaviour. This ability relates to the
diversity of the model's constructs and the diversity of relations among their constructs. In the
model, behavioural intention is the primary, direct determinant of behaviour on the premise that
“a person who intends to take a certain action is likely to carry out that behaviour” [19]. However,
the additional explanatory power afforded by the other relative factors. An equation has been
formulated and used to calculate the participation of every model’s construct in the model’s
explanatory power. The formula was applied to the model using the total (direct and indirect)
effects of each model's construct on the SNSs usage behaviour (see Table6, Table7 and Table 8)
as follow:
Where:
= Participation of variable Ax in a model' explanatory power
= Square of beta coefficients or standardized coefficients of variable
= Model' explanatory power (behaviour)
= Total of causal effects for the model’s constructs
Table 6. Decomposition of total causal effects for the model’s constructs
SC ES PU AT BI
PU .502 .211 .000 .000 .000
AT .687 .320 .310 .000 .000
BI .309 .140 .149 .606 .000
US .240 .109 .092 .278 .747
Table 7. Standardized Direct Effects
SC ES PU AT BI
PU .502 .211 .000 .000 .000
AT .361 .312 .310 .000 .000
BI .000 .000 .138 .606 .000
US .000 .000 .000 .000 .747
Table 8. Standardized Indirect Effects
SC ES PU AT BI
PU .000 .000 .000 .000 .000
AT .326 .008 .000 .000 .000
BI .309 .140 .011 .000 .000
US .240 .109 .092 .278 .000](https://image.slidesharecdn.com/applyingthetechnologyacceptance-150911062906-lva1-app6892/75/APPLYING-THE-TECHNOLOGY-ACCEPTANCE-MODEL-TO-UNDERSTAND-SOCIAL-NETWORKING-9-2048.jpg)
![International Journal of Computer Science & Information Technology (IJCSIT) Vol 7, No 4, August 2015
114
Table 9 shows the participating model' variables and their explanatory power. In the proposed
model, behavioural intention is the primary, direct determinant of behaviour and its participation
in the model’ explanatory power was the highest amongst the constructs. Behavioural intention
was able to explain 28% of usage behaviour. This shows that behaviour is largely driven by
behavioural intention and that has a notable impact on the model's explanatory power.
Table 9. Participation of model's variables in the models' explanatory power
Constructs The proposed
model
Intention 28%
Attitude 10.4%
Perceived Social Capital 9%
Perceived Ease of Use 4.1%
Perceived Usefulness 3.5%
Total 55%
This impact can be obviously seen when behavioural intention is excluded from the model, since
the prediction of behaviour decreases substantially (from R²(B) = 0.55 to R²(B) = 0.27. The drop in
predictive power when behavioural intention was omitted concurs also with the Taylor and Todd
[30] study, according to their research, "behavioural intention plays an important substantive role,
but is also important pragmatically in predicting behaviour" [30]. Likewise, De Guinea
and Markus [12] indicate that IT use behaviour is the result of conscious, cognitive behavioural
intention.
Table 8 and 9 also show that “attitude” construct has a notable impact on usage behaviour, this
impact came indirectly through its direct effect on behavioural intention. Participation of
“attitude” in the models' explanatory power was the second highest amongst the constructs.
“Attitude”, alone explain around 10.4% of SNSs usage behaviour.
Scholars have shown that attitude positively influences behavioural intentions [3]. Attitude is is
defined as an individual’s feelings towards performing a specific behaviour, which is his positive
or negative evaluation of performing the behaviour ([10], [2]). In other words, attitude means the
complete assessments or feeling of a person concerning the examined behaviour. In the context of
this study, attitude is defined as the general evaluations of individuals regarding the adoption of
SNS.
The study findings also show that “Perceived Social Capital” construct has a notable impact on
usage behaviour (see Table 9), this impact came indirectly through its direct effect on “attitude”
and “Perceived Usefulness”. Participation of “Perceived Social Capital” in the models'
explanatory power was the third highest amongst the constructs. “Perceived Social Capital”,
alone explain around 9% of SNSs usage behaviour.
This findings concurs with social capital nature which exist in the relationships between
individuals and their connections with communities [28], since that SNS, such as Facebook,
LinkedIn, Twitter, and Google Plus, is a platform allows users to build social relations with the
people within and beyond their social circle ([20], [6]).](https://image.slidesharecdn.com/applyingthetechnologyacceptance-150911062906-lva1-app6892/75/APPLYING-THE-TECHNOLOGY-ACCEPTANCE-MODEL-TO-UNDERSTAND-SOCIAL-NETWORKING-10-2048.jpg)
![International Journal of Computer Science & Information Technology (IJCSIT) Vol 7, No 4, August 2015
115
6. IMPLICATIONS FOR THEORY AND PRACTICE
6.1. Implications for theory and research
In the field of information systems, scholars have conducted many studies focusing on the
adoption of different information technologies and widely cover aspects related to adoption
intentions and behaviour. Several IS models have been developed and applied to understand
determinants of behavioural intention and usage behaviour. In particular, this study extended the
technology acceptance model TAM with additional factor influencing behavioral intention toward
new technology.
The present study also contributes to the technology acceptance model by providing a support to
the robustness of TAM as a powerful model and for its efficacy in understanding and predicting
people’s use of SNSs. Overall, this study provided some support for the application of the TAM
model in the context of high-level SNS use with attitude and Social capital significantly
predicting intention, which, in turn, significantly predicted behaviour. Moreover, in this study an
effort has been provided to extend the TAM’s original key constructs aiming to explain user
acceptance and usage of SNS. A new determinant was identified and empirically validated:
perceived social capital. Extending TAM with this construct provides a more intense
understanding of the dynamics effect behind the formation and change of SNS user acceptance.
6.2. Implications for practice
The present study found that Social capital constructs indirectly influence usage behaviour
through its direct effect on attitude. This indicates that social capital are attractions that encourage
individuals to adopt SNSs and the social relationship embedded in SNSs posts is an important
factor. The current study asserts that the expectations for enhancing social relationships would
encourage individuals to engage in SNSs.
Highlighting the benefits of social capital could retain regular SNS users and even attract others
from another service provider. Thus SNS service providers should take that into account while
making strategies and developing SNS platforms. For example, they can develop themes or
appropriate styles consider the three categories of social capitals namely bridging, bonding [27]
and maintained social capital [15] then users could choose the appropriate one according to their
expectancy. For bridging social capital, SNS service providers should develop theme allows users
to exchange useful information or new perspectives without prior personal or emotional
experience with others. For bonding, the SNS service providers should adopting methods to
support emotional relations between users and focus on internal ties between individuals. For
maintained social capital, the SNS service providers should establish a mechanism to increase
individuals’ ability to maintain relationships to their prior social networks.
7. LIMITATIONS AND FURTHER RESEARCH
A careful and systematic effort has been presented in this study to examine theory of planned
behaviour in understanding and predicting people’s use of SNSs. In order to strengthen the study
a number of features such as a large sample size, actual measures of behaviour collected over
time and a realistic setting were included. However, the present study has limits, it only
considered intention and behaviour in the context of SNSs usage, and it is unclear whether the
analytical results can be generalized to other areas of context in IS. The sample was collected in
Saudi Arabia and generalisation of the study findings to other countries might be limited due to
cultural differences in online user behaviours. Hence, the proposed model should be tested further](https://image.slidesharecdn.com/applyingthetechnologyacceptance-150911062906-lva1-app6892/75/APPLYING-THE-TECHNOLOGY-ACCEPTANCE-MODEL-TO-UNDERSTAND-SOCIAL-NETWORKING-11-2048.jpg)
![International Journal of Computer Science & Information Technology (IJCSIT) Vol 7, No 4, August 2015
116
using samples from other countries, thus future research is needed for a number of reasons in
order to test the model further in SNS context.
REFERENCES
[1] Adler, P.S., & Kwon, S. (2002). Social capital: prospects for a new concept. The Academy of
Management Review, 27(1), 17–40.
[2] Ajzen, I. (1991). The theory of planned behaviour. Organizational Behaviour and Human Decision
Processes, 50(2), 179-211.
[3] Ajzen, I., & Fishbein, M. (1980). Understanding Attitudes and Predicting Social Behaviour.
Englewood Cliffs, NJ: Prentice-Hall.
[4] Al-Debei, M., Al-Lozi, E., & Papazafeiropoulou, A. (2013). Why people keep coming back to
Facebook: Explaining and predicting continuance participation from an extended theory of planned
behaviour perspective. Decision Support Systems, 55(1), 43-54.
[5] Alghaith, W., Sanzogni, L., Sandhu, K. (2010). Factors Influencing the Adoption and Usage of
Online Services in Saudi Arabia. Electronic Journal of Information Systems in Developing Countries
(EJISDC). 40(1), 1-32.
[6] Chen, A., Lu, Y., Chau, P. Y., & Gupta, S. (2014). Classifying, Measuring, and Predicting Users’
Overall Active Behavior on Social Networking Sites. Journal Of Management Information Systems,
31(3), 213-253.
[7] Chen, L., Gillenson, L. M., & Sherrell, L. D. (2004). Consumer acceptance of virtual stores: a
theoretical model and critical success factors for virtual stores. ACM SIGMIS Database, 35(2), 8-31.
[8] Chin, W. W., Johnson, N., & Schwarz, A. (2008). A fast form approach to measuring technology
acceptance and other constructs. MIS Quarterly, 32(4), 687-703.
[9] Coleman, J. S. (1988). Social capital in the creation of human capital. American Journal of Sociology,
94(Suppl.), 95–120.
[10] Davis, F. D. (1989). Perceived usefulness, perceived ease of use, and user acceptance of information
technology. MIS Quarterly, 13(3), 319-340.
[11] Davis, F. D., Bagozzi, R. P., & Warshaw, P. R. (1989). User acceptance of computer technology: A
comparison of two theoretical models. Management Science, 35, 982-1003
[12] De Guinea, A., & Markus, M. (2009). Why break the habit of a lifetime? rethinking the roles of
intention, habit, and emotion in continuing information technology use. MIS Quarterly, 33(3), 433.
[13] Djamasbi, S., Strong, D., & Dishaw, M. (2010). Affect and acceptance: Examining the effects of
positive mood on the technology acceptance model. Decision Support Systems, 48(2), 383.
[14] Ellison, N., Steinfeld, C., & Lampe, C. (2006, June). Spatially bounded online social networks and
social capital: The role of Facebook. Paper presented at the annual conference of the International
Communication Association, Dresden, Germany.
[15] Ellison, N.B., Steinfield, C., & Lampe, C. (2007). The benefits of Facebook ‘‘friends’’: social capital
and college students’ use of online social network sites. Journal of Computer-Mediated
Communication, (12), 1143–1168.
[16] Gnyawali, D., Fan, W., & Penner, J. (2010). Competitive actions and dynamics in the digital age: an
empirical investigation of social networking firms. Information Systems Research. 21(3), 594–613.
[17] Guo, Y., Li, Y., & Ito, N. (2014). Exploring the Predicted Effect of Social Networking Site Use on
Perceived Social Capital and Psychological Well-Being of Chinese International Students in Japan.
Cyberpsychology, Behavior & Social Networking, 17(1), 52-58.
[18] Islam, K.M., et al. (2006). Social capital and health: does egalitarianism matter? A literature review.
International Journal for Equity in Health, 5 (3), 1–28.
[19] Kim, S., & Malhotra, N. K. (2005). A Longitudinal Model of Continued IS Use: An Integrative View
of Four Mechanisms Underlying Postadoption Phenomena. Management Science, 51(5), 741-755.
[20] Ku, Y.C., Chen, R., Zhang, H. (2013). Why do users continue using social networking sites? An
exploratory study of members in the United States and Taiwan. Information & Management, 50(7),
571-581.
[21] Lau, S. H., & Woods, P. C. (2009). Understanding learner acceptance of learning objects: The roles of
learning object characteristics and individual differences. British Journal of Educational Technology,
40, 1059–1075.
[22] Lu, H., & Lee, M. (2012). Experience differences and continuance intention of blog sharing.
Behaviour & Information Technology, 31(11), 1081-1095.](https://image.slidesharecdn.com/applyingthetechnologyacceptance-150911062906-lva1-app6892/75/APPLYING-THE-TECHNOLOGY-ACCEPTANCE-MODEL-TO-UNDERSTAND-SOCIAL-NETWORKING-12-2048.jpg)
![International Journal of Computer Science & Information Technology (IJCSIT) Vol 7, No 4, August 2015
117
[23] Mathieson, K. (1991). Predicting user intentions: comparing the technology acceptance model with
the theory of planned behaviour. Information Systems Research, 2(3), 173-191.
[24] Mcckenzie, K., Whitley, R., & Weich, S. (2002). Social capital and mental health. British Journal of
Psychiatry, 280–283.
[25] McCoy, S., Galletta, D., & King. W. (2007). Applying TAM across cultures: the need for caution.
European Journal of Information Systems, 16(1), 81-90.
[26] Moore, C., & Benbasat, I. (2001). Development of an instrument to measure the perception of
adopting an information technology innovation. Information Systems Research, 2(3), 192-222.
[27] Putnam, R. D. (2000). Bowling alone. New York, NY: Simon and Schuster.
[28] Putnam, R. (1995). Tuning in, tuning out: the strange disappearance of social capital in America.
Political Science and Politics, 28 (4), 664–683.
[29] Sidorova, A., Evangelopoulos, N., Valacich, J. S., & Ramakrishnan, T. (2008). Uncovering the
intellectual core of the information systems discipline. MIS Quarterly, 32(3), 467-A20.
[30] Taylor, S., & Todd, P.A. (1995). Understanding information technology usage: A test of competing
models. Information Systems Research, 6(2), 144-176.
[31] Venkatesh, V. (2000). Determinants of perceived ease of use: Integrating control, intrinsic motivation,
and emotion into the technology acceptance model. Information Systems Research, 22, 342–365.
[32] Wiley-Patton, Sonja Dorothea (2002). A test of the Extended Technology Acceptance Model for
understanding the Internet adoption behaviour of physicians. Ph.D. dissertation, University of
Hawai'i, United States – Hawaii.
[33] Xu, C., Ryan, S., Prybutok, V., & Wen, C. (2012). It is not for fun: An examination of social network
site usage. Information and Management, 49(5), 210–217.
[34] Zhang, H., Lu, Y., Gupta, S., & Zhao, L. (2014). What motivates customers to participate in social
commerce? The impact of technological environments and virtual customer experiences, Information
and Management, 51(8), 1017–103.
[35] Zhou, T. (2011). Understanding online community user participation: a social influence perspective.
Internet Research, 21(1), 67–81.
[36] Zikmund, W. G. (2003). Business research methods (7th ed.). Cincinnati, OH: Thomson.
Author
Waleed Alghaith is an Assistant Professor of Information systems at Shaqra University, Riyadh, Saudi
Arabia. He holds a PhD in information systems from Griffith University, Australia. His areas of expertise
are information technology research, internet research and organizational intelligence technologies. He
currently works as Head of Information Systems Department, and as Dean of IT and eLearning deanship.](https://image.slidesharecdn.com/applyingthetechnologyacceptance-150911062906-lva1-app6892/75/APPLYING-THE-TECHNOLOGY-ACCEPTANCE-MODEL-TO-UNDERSTAND-SOCIAL-NETWORKING-13-2048.jpg)