Download to read offline
![Question:
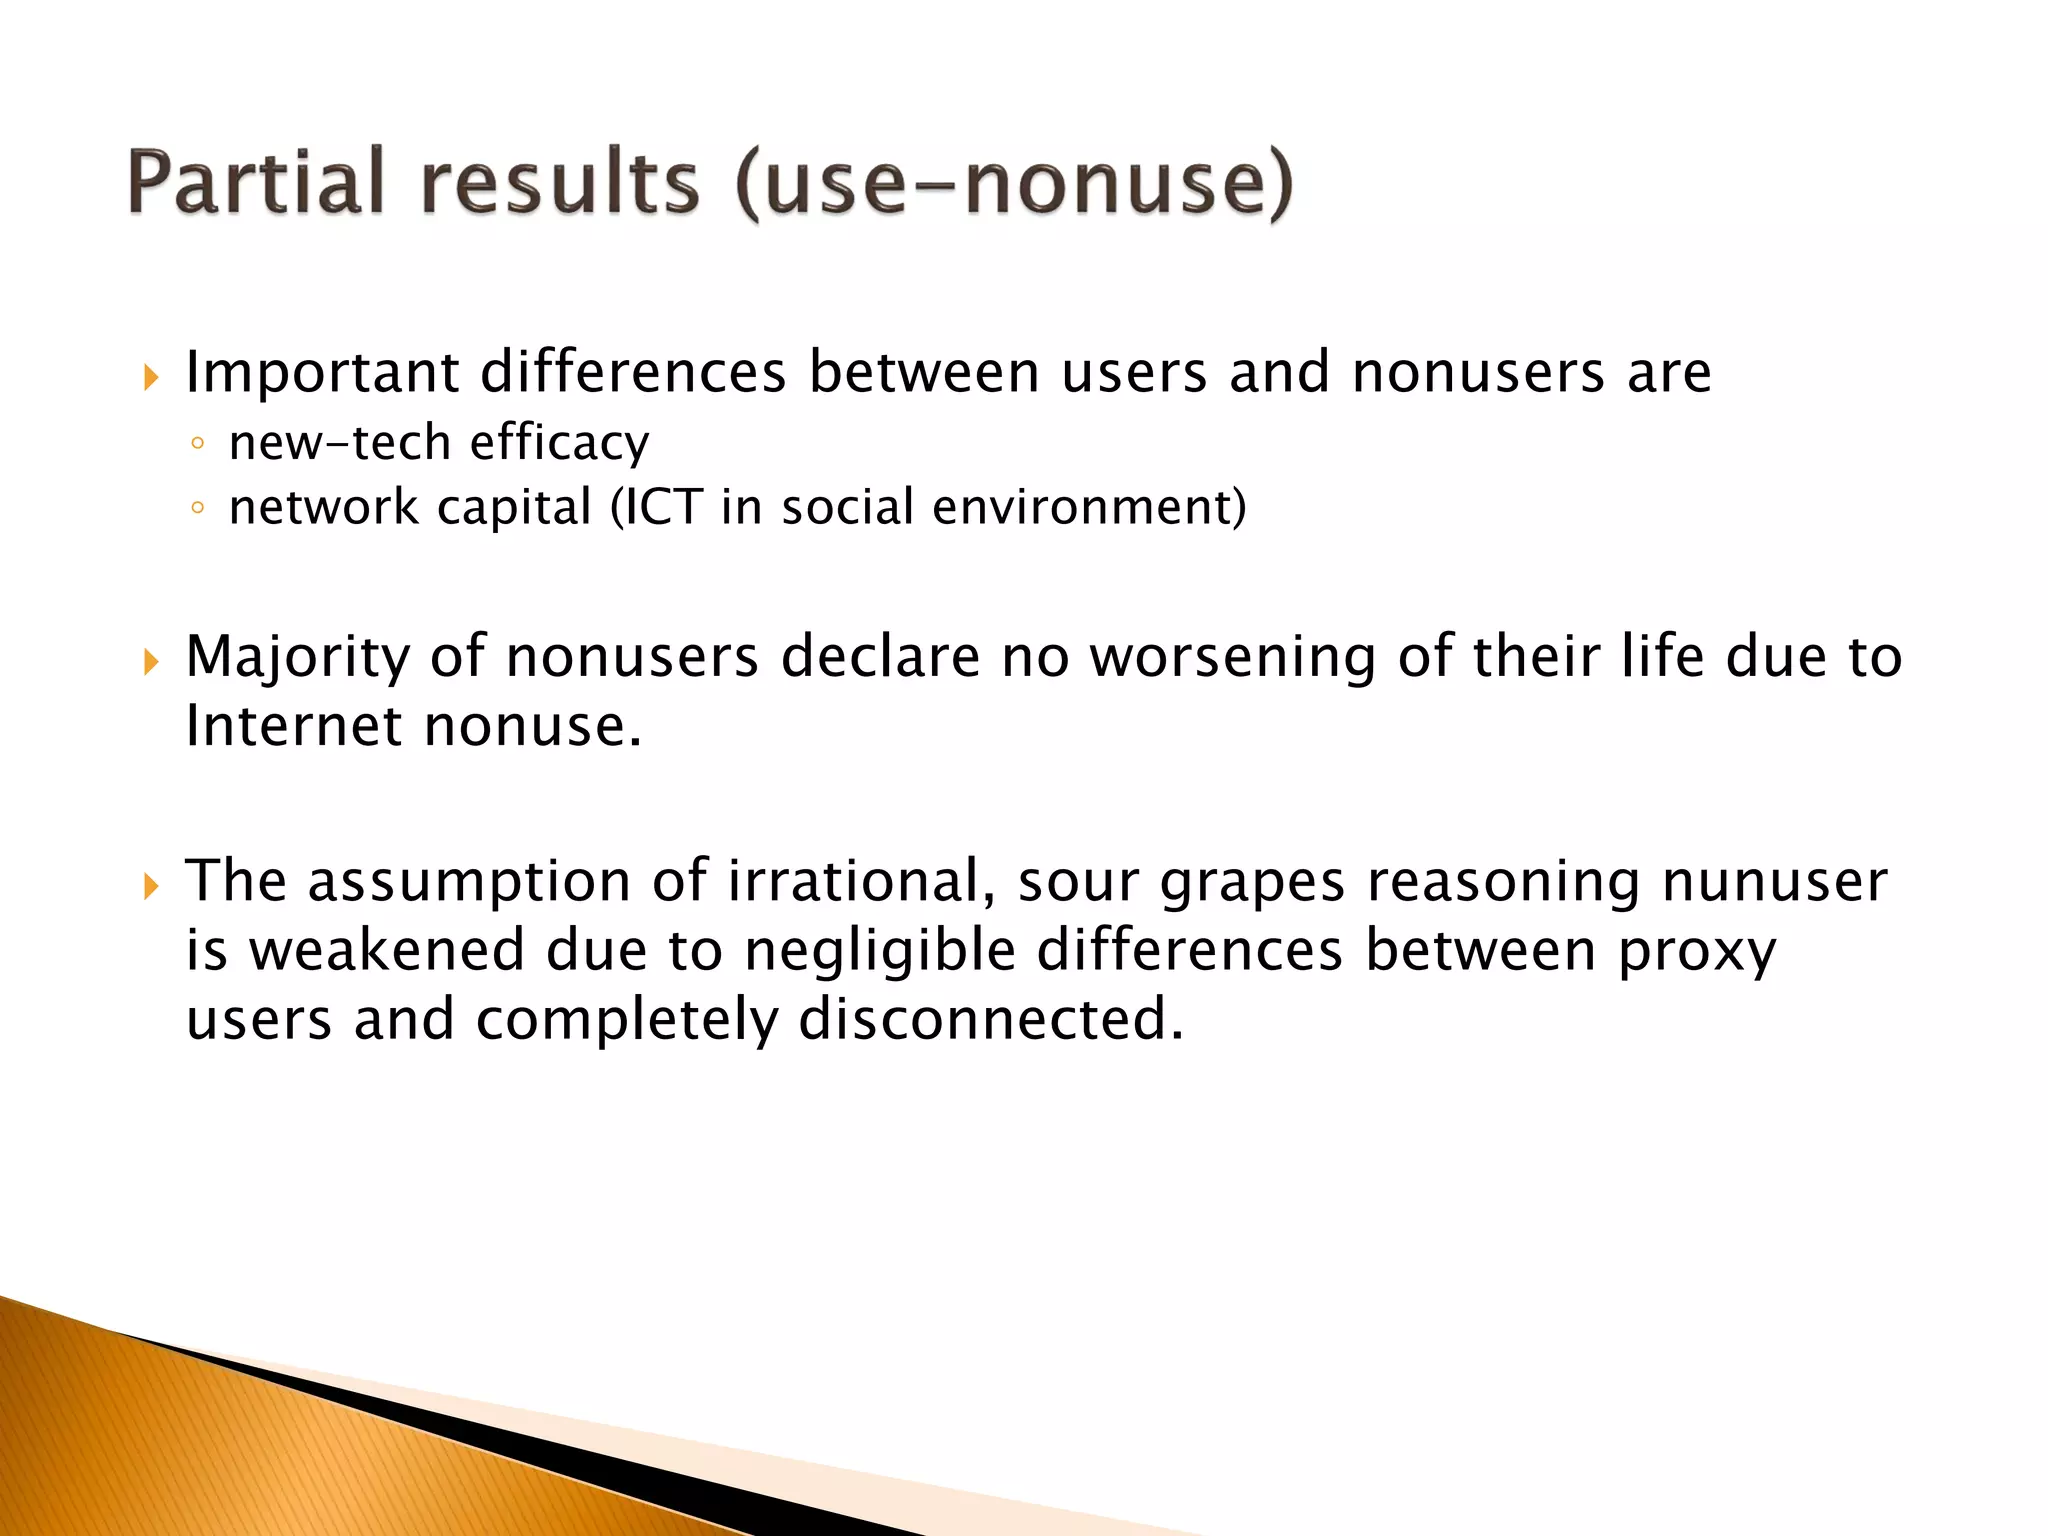
Not-using the Internet can be either advantage or disadvantage.
Thinking about your personal experience in the recent years, how
much does the fact that you are not using the Internet affected
your life in the following areas?
Please, answer with the help of a scale, where -5 means significant
worsening and +5 means significant improvement.
[Scale:]
-5 -4 -3 -2 -1 0 1 2 3 4 5
(-5=Significant worsening 5 = Significant
improvement)](https://image.slidesharecdn.com/presentationlupac-aoir-160727080845/75/The-need-for-a-new-digital-divide-model-19-2048.jpg)
![Using the Internet can either improve or worsen people's lifes.
When you think about your personal experience in the last
years, how much influences your Internet use following areas
of your life?
Please, answer with the help of a scale, where -5 means
significant worsening and +5 means significant improvement.
[Scale:]
-5 -4 -3 -2 -1 0 1 2 3 4 5
(-5=Significant worsening 5 = Significant improvement)](https://image.slidesharecdn.com/presentationlupac-aoir-160727080845/75/The-need-for-a-new-digital-divide-model-23-2048.jpg)

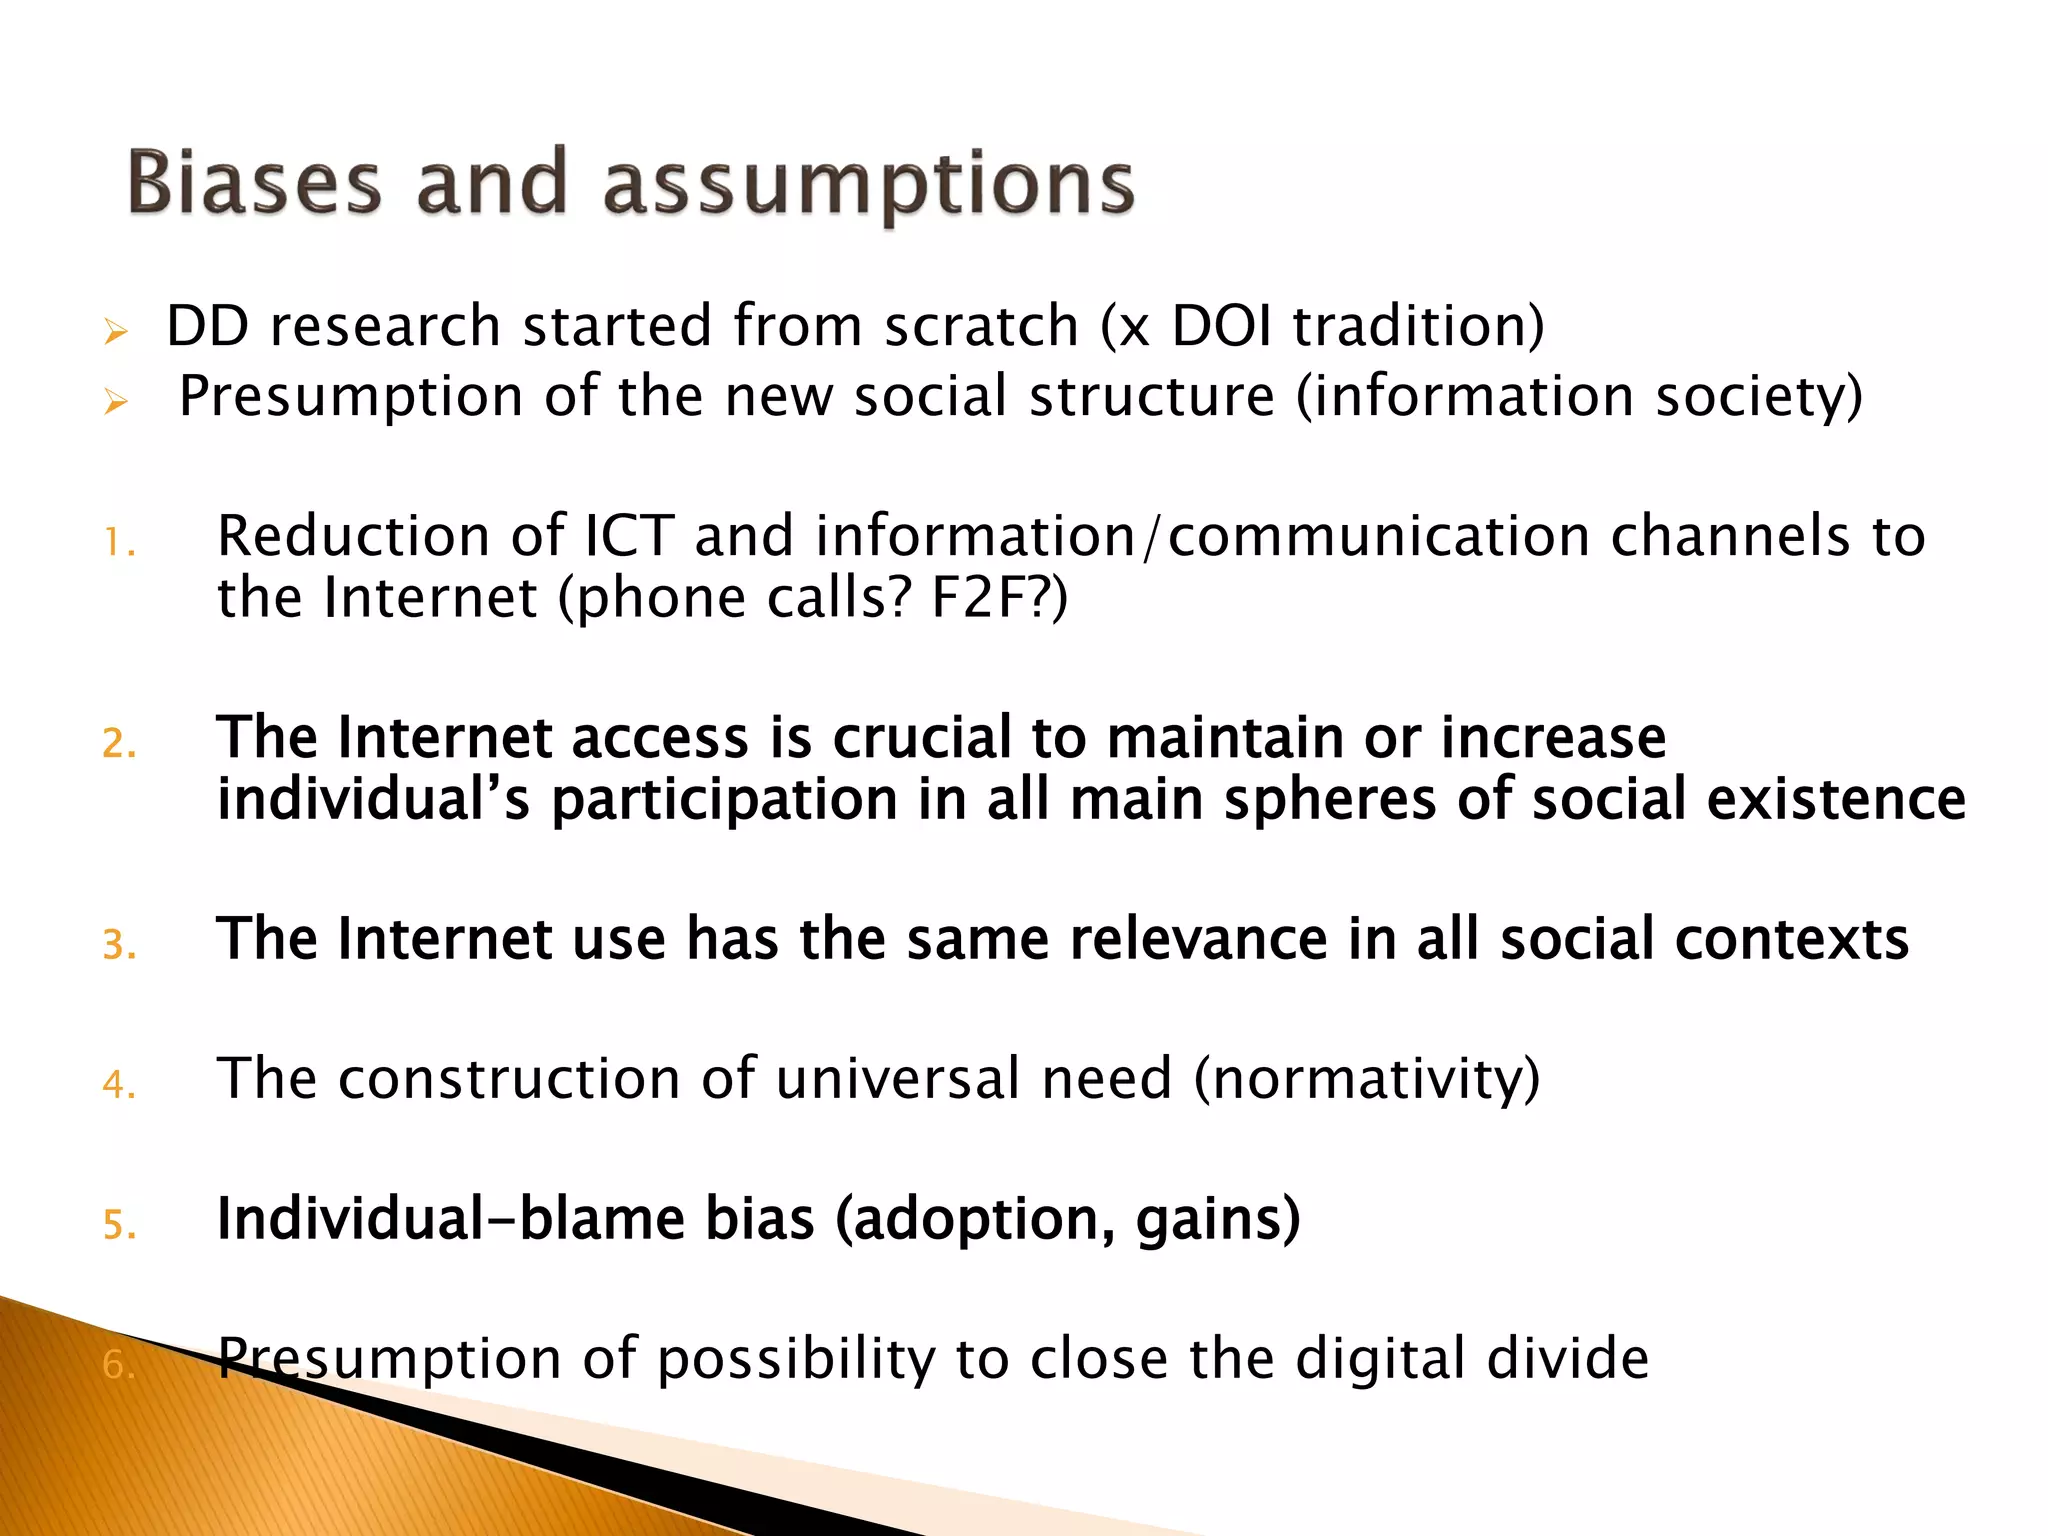
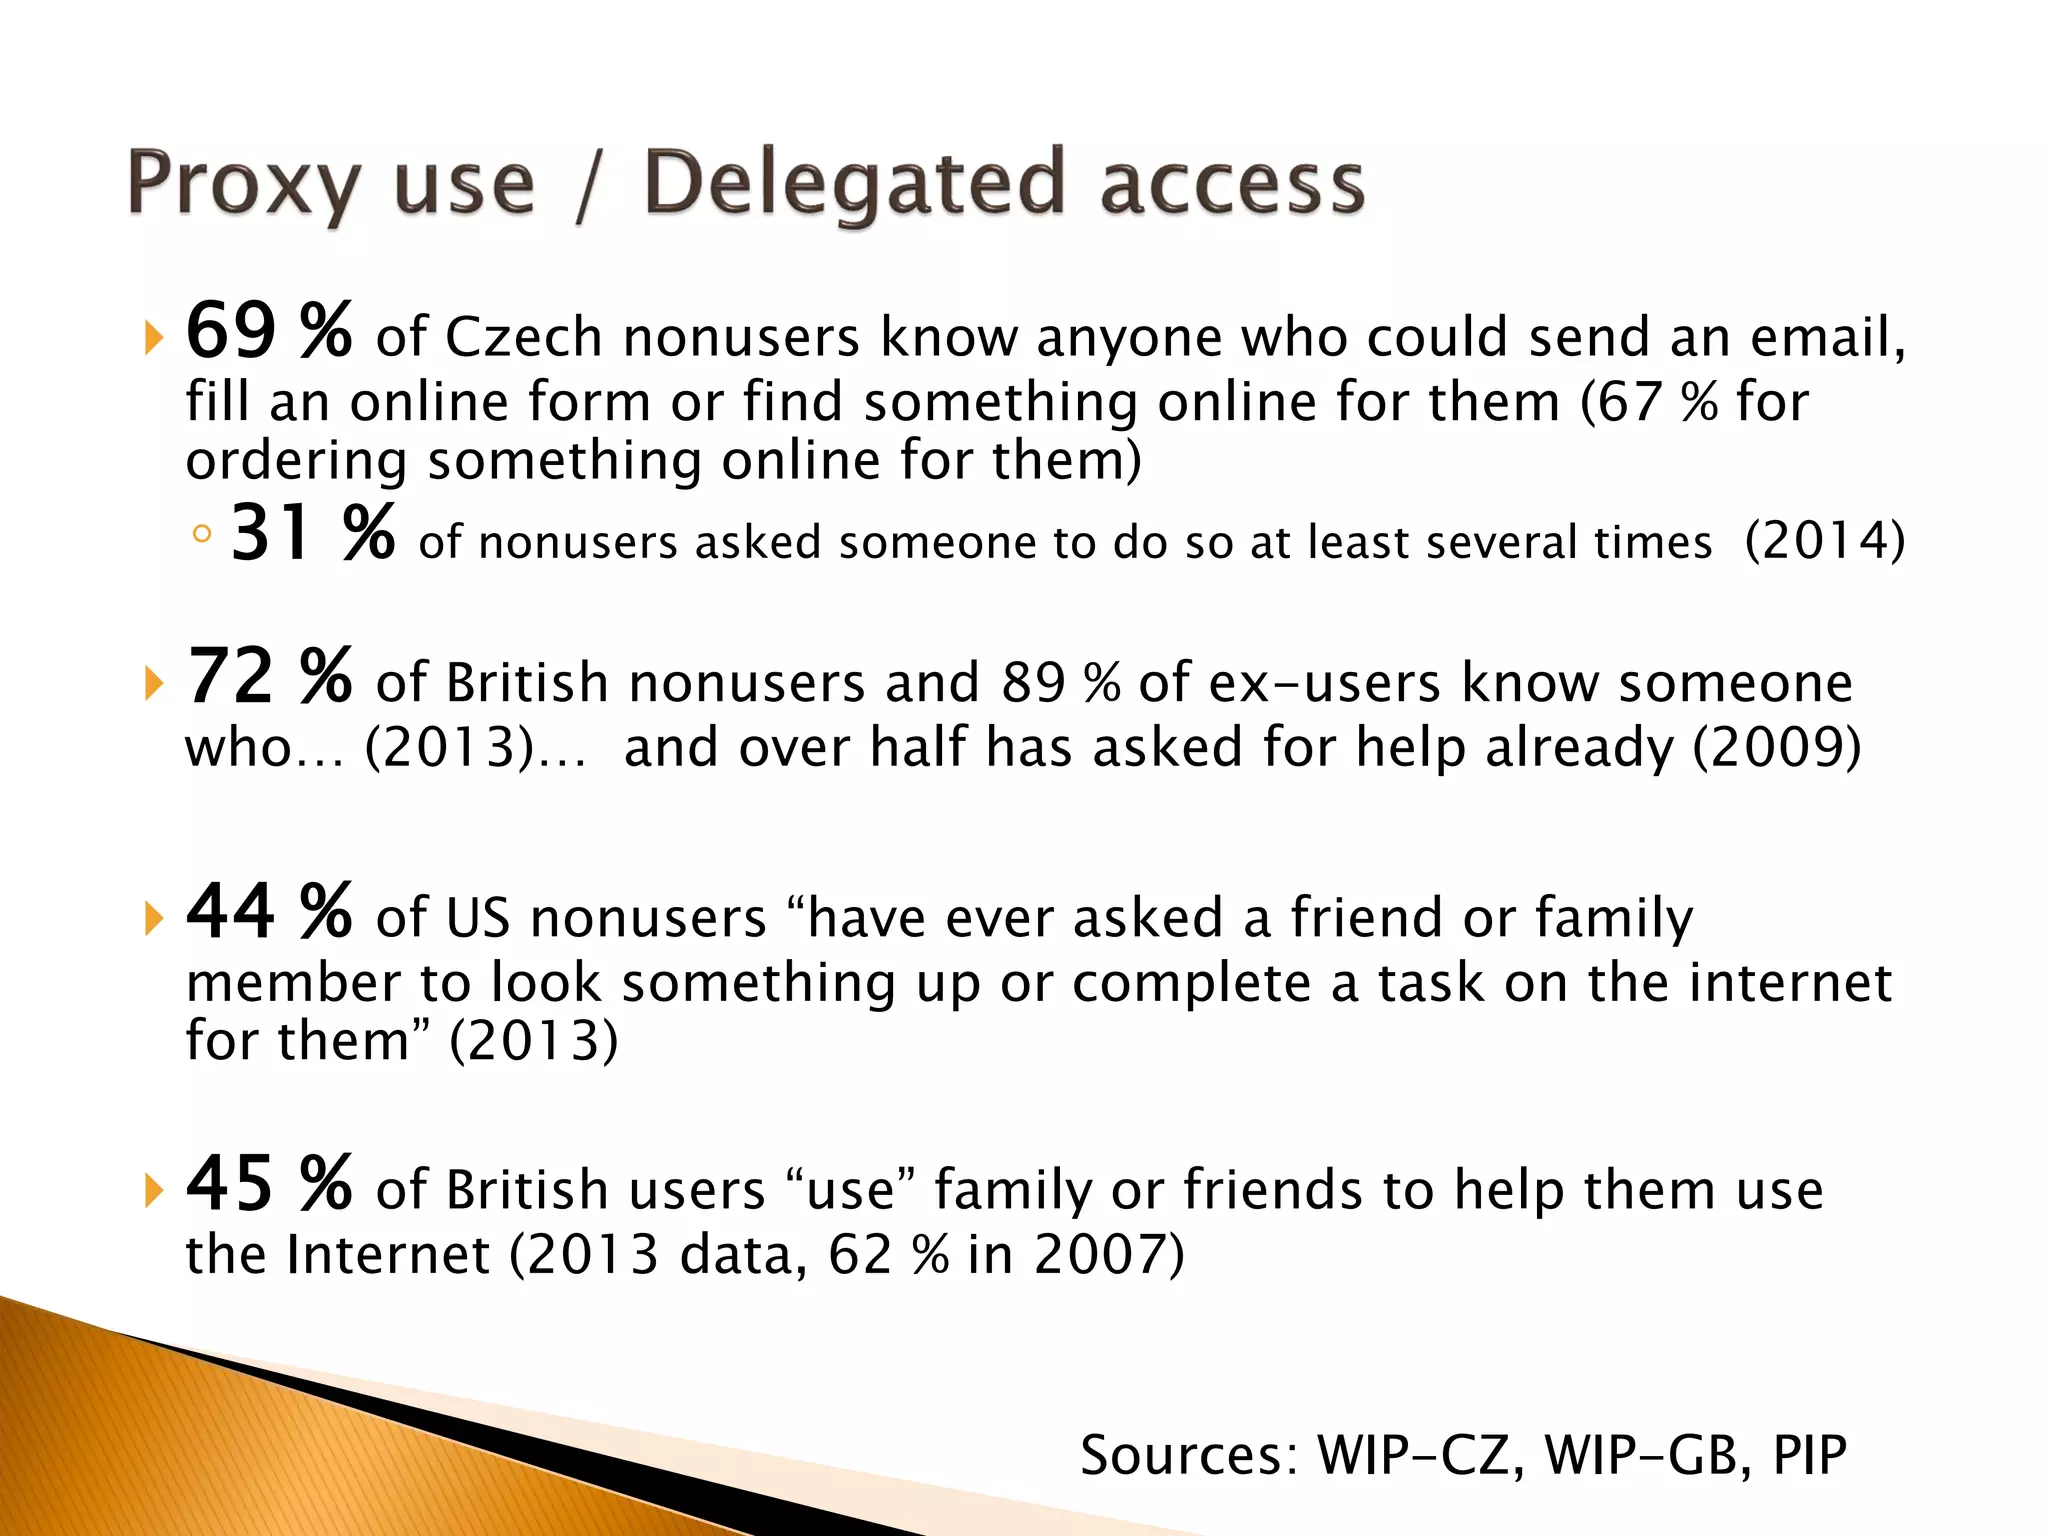
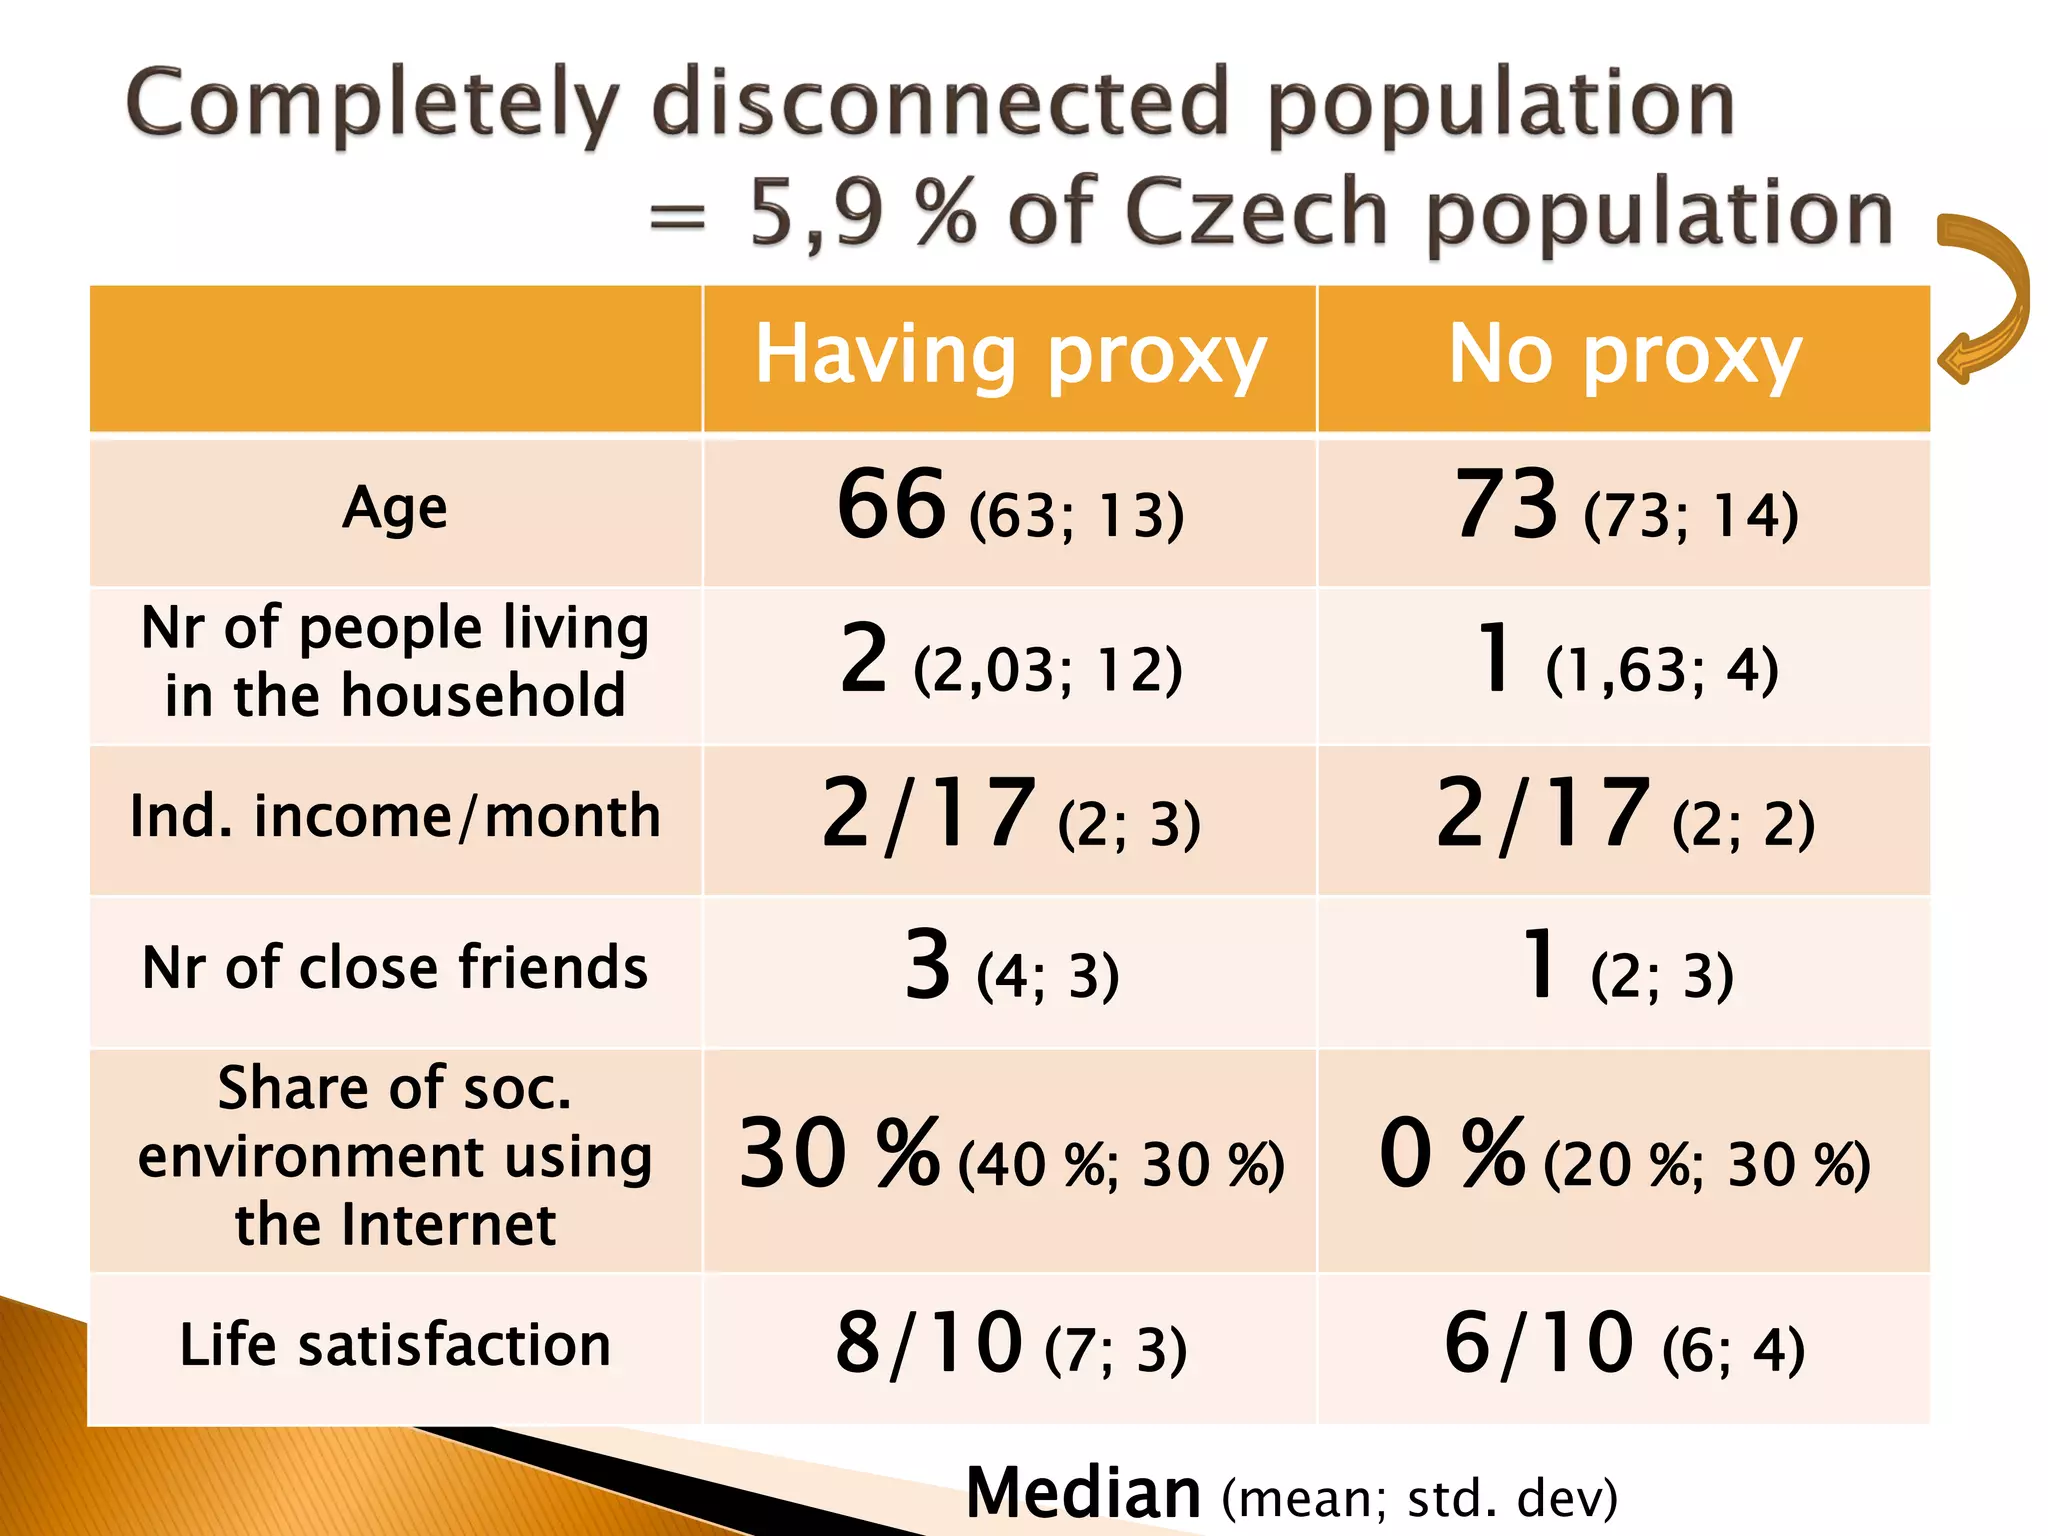
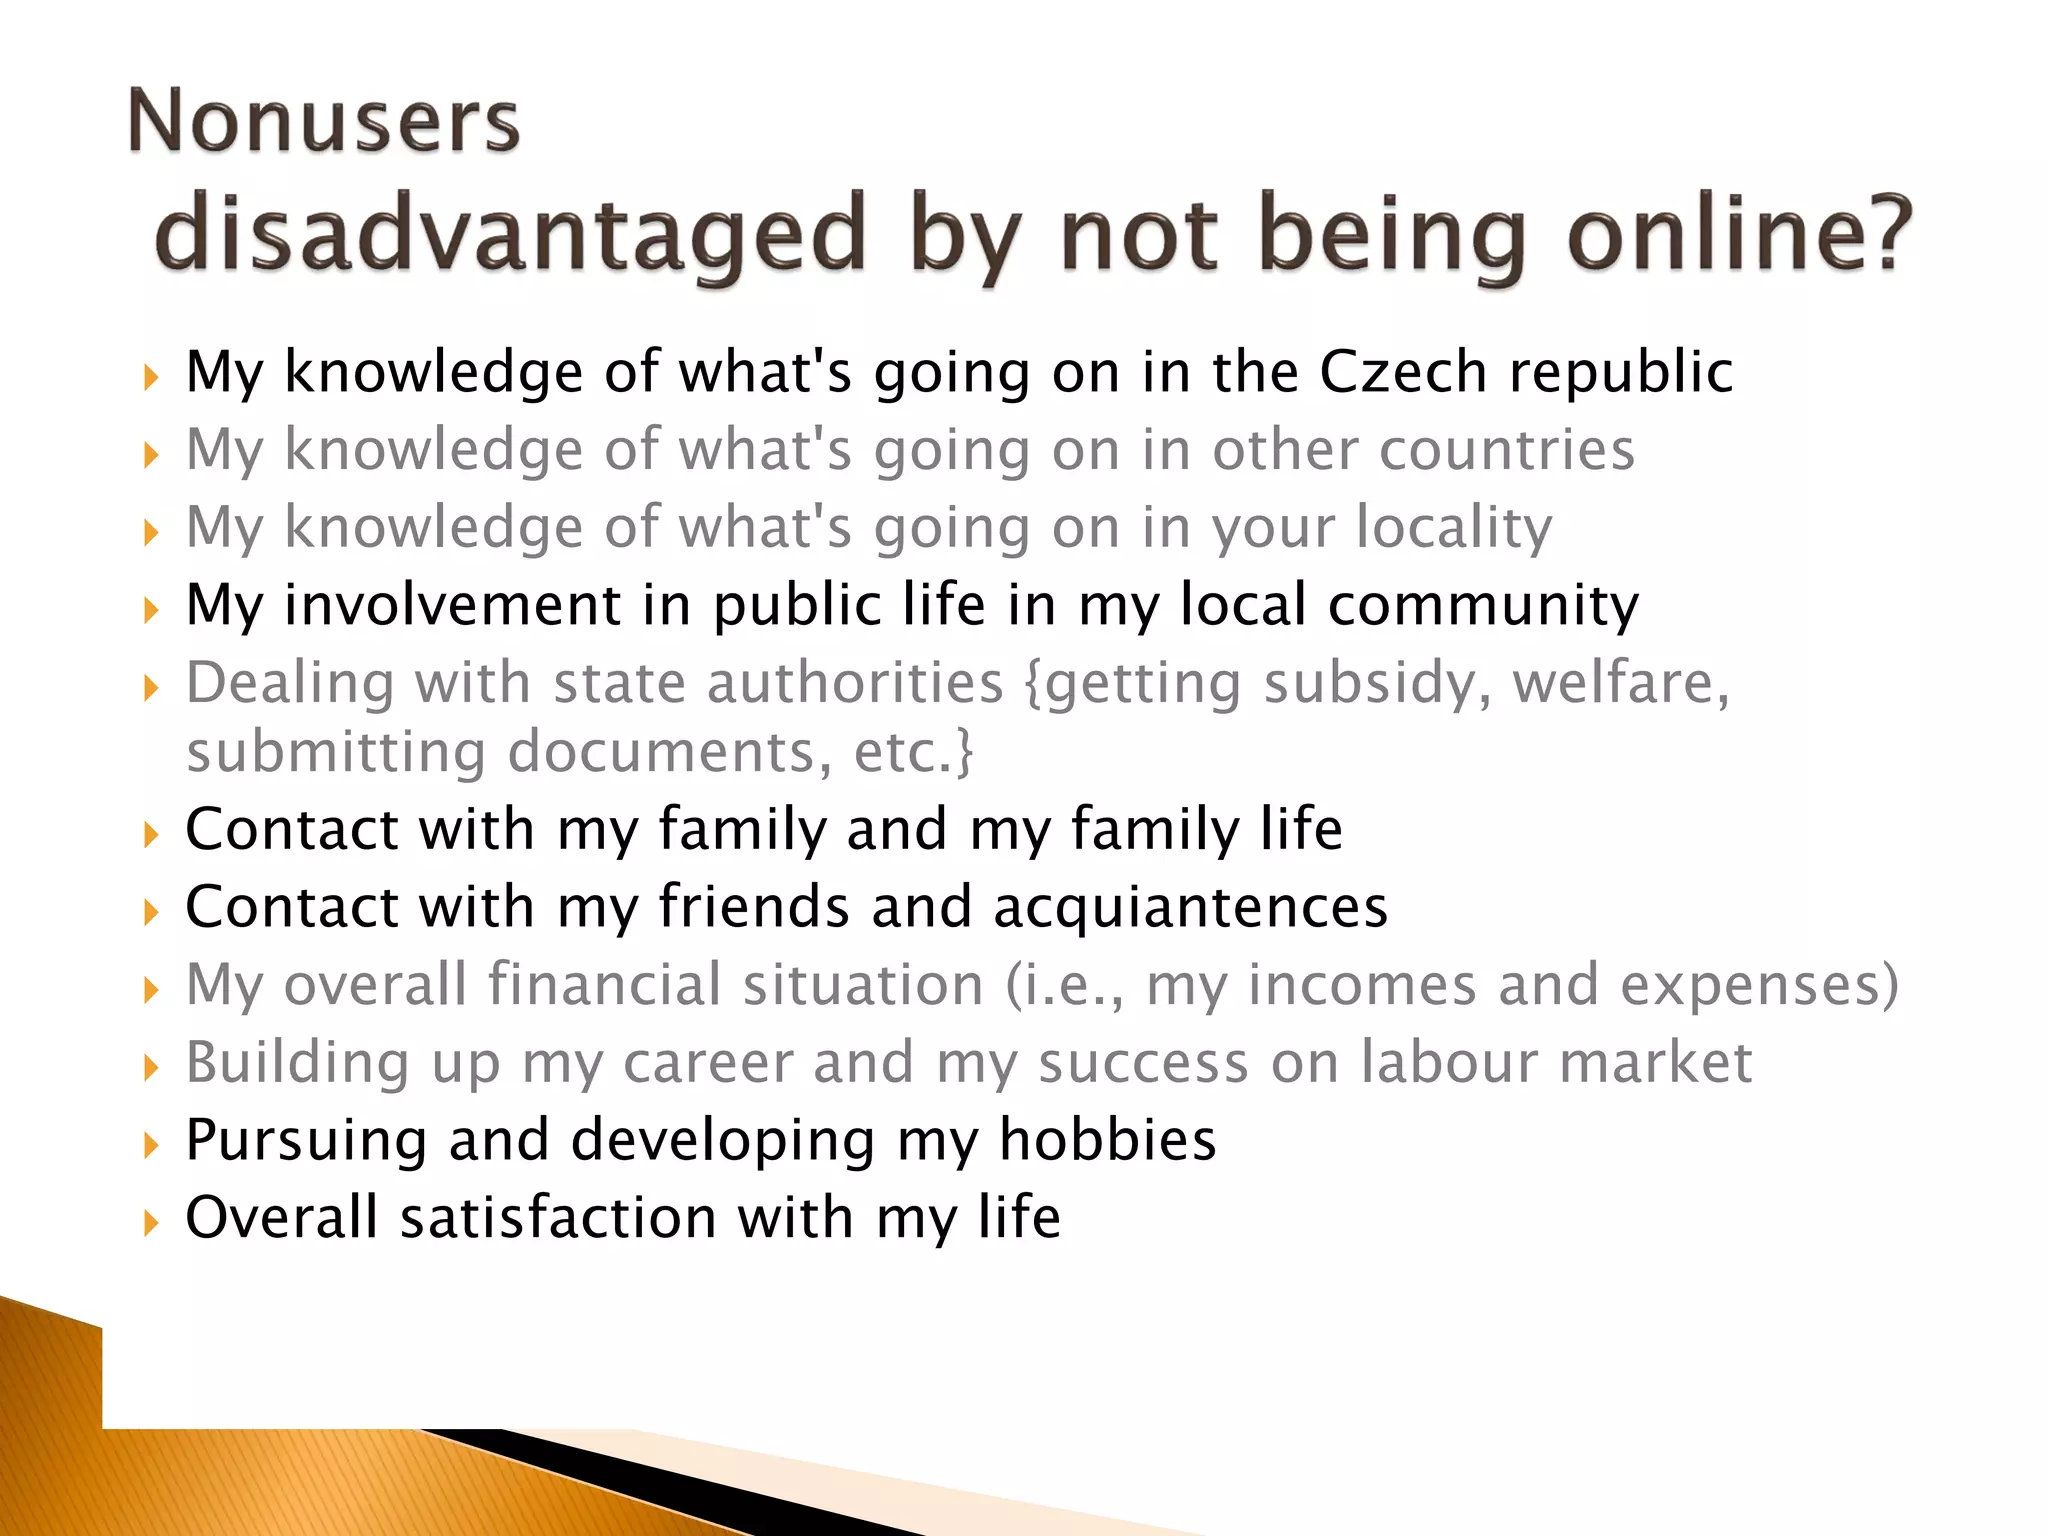
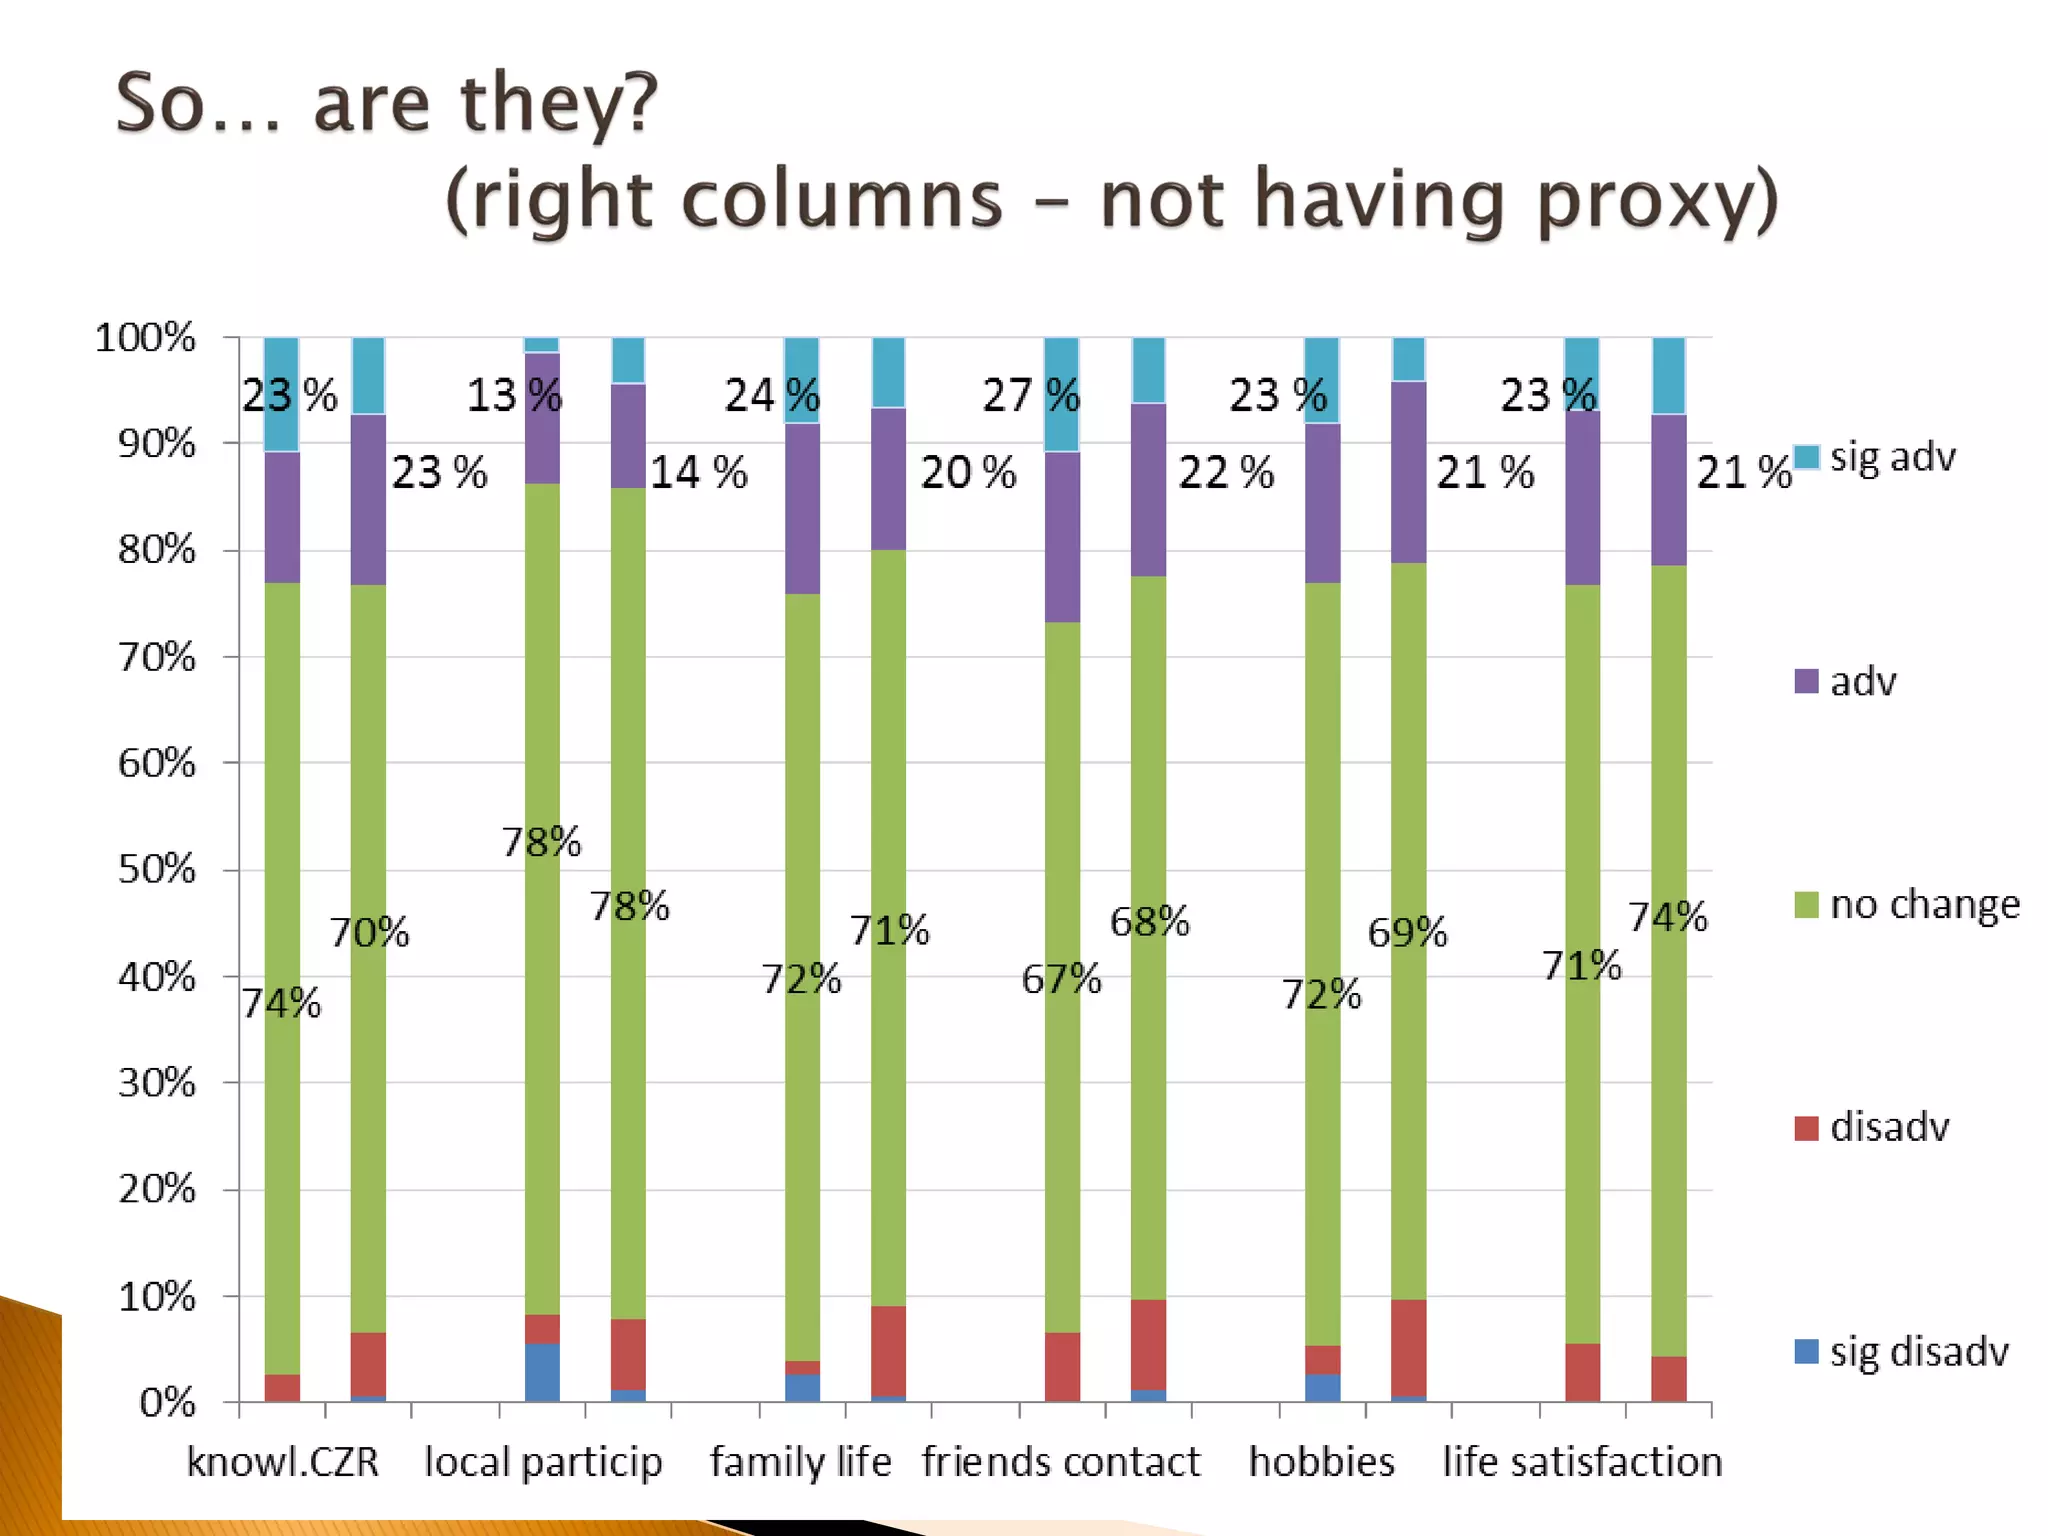
The document discusses the issue of digital inequality in the Czech Republic, emphasizing the ongoing digital divide and its implications for social participation and access to resources. It highlights the role of individual motivation, social networks, and the unequal distribution of resources in exacerbating this divide, noting that nonusers often do not perceive their internet absence as disadvantageous. The findings are based on research that examines the benefits and challenges of internet use across different demographics and supports the need for targeted digital inclusion policies.


