Recommended

Recommended
More Related Content
Similar to Wien displacement law graph.pdf
Similar to Wien displacement law graph.pdf (20)
More from SaiKalyani11
More from SaiKalyani11 (20)
Recently uploaded
Recently uploaded (20)
Wien displacement law graph.pdf
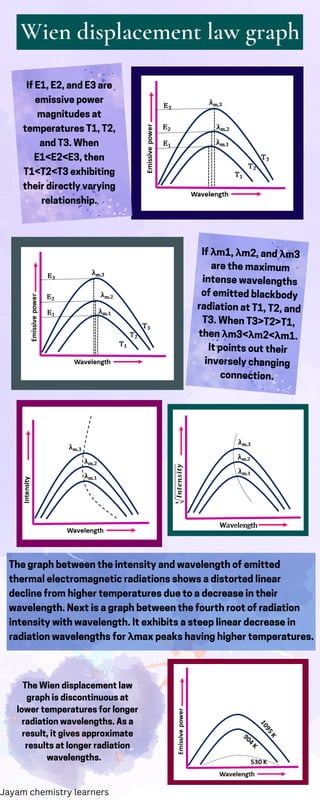
- 1. Wien displacement law graph If E1, E2, and E3 are emissive power magnitudes at temperatures T1, T2, and T3. When E1<E2<E3, then T1<T2<T3 exhibiting their directly varying relationship. If λm1, λm2, and λm3 are the maximum intense wavelengths of emitted blackbody radiation at T1, T2, and T3. When T3>T2>T1, then λm3<λm2<λm1. It points out their inversely changing connection. The graph between the intensity and wavelength of emitted thermal electromagnetic radiations shows a distorted linear decline from higher temperatures due to a decrease in their wavelength. Next is a graph between the fourth root of radiation intensity with wavelength. It exhibits a steep linear decrease in radiation wavelengths for λmax peaks having higher temperatures. The Wien displacement law graph is discontinuous at lower temperatures for longer radiation wavelengths. As a result, it gives approximate results at longer radiation wavelengths. Jayam chemistry learners