Download as PDF, PPTX


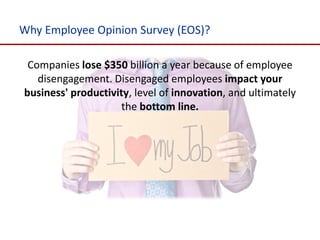
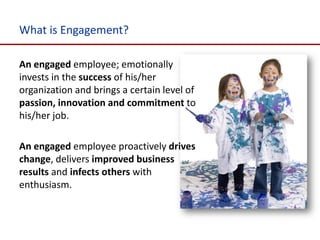


The document discusses the importance of employee opinion surveys (EOS) in addressing employee disengagement, which costs companies $350 billion annually. It highlights that engaged employees significantly contribute to revenue and productivity while providing steps for conducting an effective EOS. The document emphasizes the necessity of planning and acting on the survey results to improve overall employee engagement and business outcomes.


