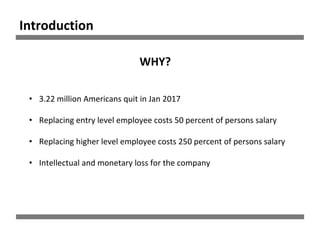
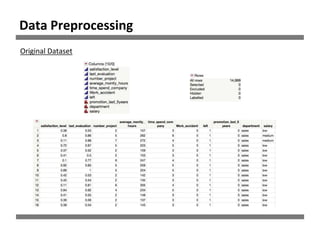
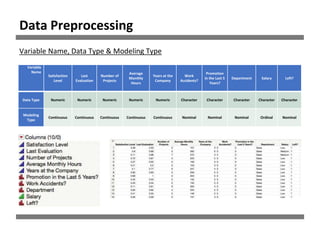
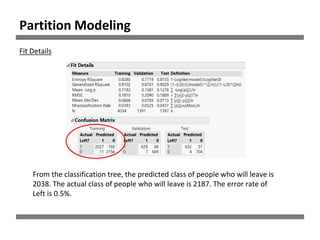
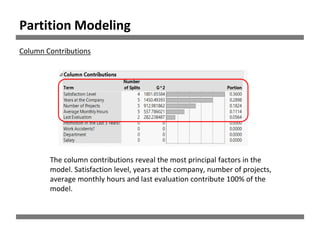
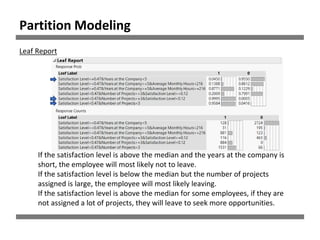
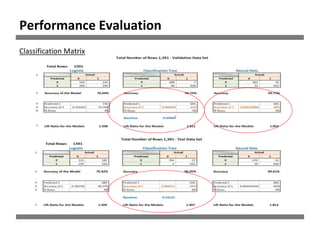
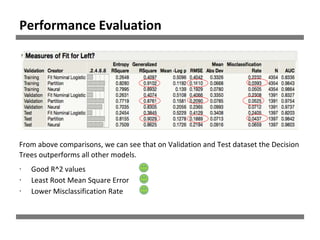
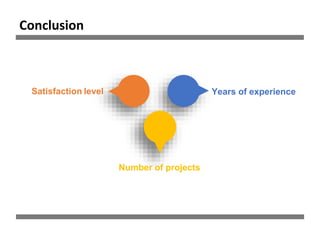
Human Resource Analytics
“A company is only as good as the people it keeps”
OPIM 5604 Predictive Modeling
Apoorva Srivastava| Jin Zhao| Saurav Gupta| Yiming Liang| Vibhuti Upadhyay| Yulei Xia
Introduction
• 3.22 million Americans quit in Jan 2017
• Replacing entry level employee costs 50 percent of persons salary
• Replacing higher level employee costs 250 percent of persons salary
• Intellectual and monetary loss for the company
WHY?
Objective
“Whether an employee will leave or not?”
Original Dataset
Data Preprocessing
Variable
Name
Satisfaction
Level
Last
Evaluation
Number of
Projects
Average
Monthly
Hours
Years at the
Company
Work
Accidents?
Promotion
in the Last 5
Years?
Department Salary Left?
Data Type Numeric Numeric Numeric Numeric Numeric Character Character Character Character Character
Modeling
Type
Continuous Continuous Continuous Continuous Continuous Nominal Nominal Nominal Ordinal Nominal
Data Preprocessing
Variable Name, Data Type & Modeling Type
Data Preprocessing
Missing Values & Outliers
7142 rows left for future modeling process
Left? Number of Rows
1 3571
0 3571
Data Preprocessing
Stratification
No Promotion 😕 ! More Projects More Work LEFT
Data Visualization
Who has spent 4-5 years at the
company LEFT
Data Visualization
Also these people are the one who
work more than 250 hours at work
People who have
• Low And Medium salary
• Low satisfaction level
• Work more average hours
LEFT
Data Visualization
Most people who left were part of HR and
Accounting 😒
People in R&D, Product Mgmt., and Marketing
are amongst the least likely to leave.
Most promotions happens in R&D,
Management, and Marketing.
Data Visualization | Department Trends
Marketing, R&D & Product Mgmt. Accounting, Tech and Support
Turnover Likely to stay Likely to leave
Satisfaction
Most satisfied Not satisfied
Performance Evaluation
Low High
Hours worked
Amongst lowest Amongst highest
Promotions
Most promoted Least promoted
Discovery Based on Departments
Firm depends on Marketing and
R&D i.e. why these folks tend to
get promoted more easily
• Hardest working people.
• Higher performance evaluations
• But amongst the least satisfied,
and least promoted
• Work less as far as hours
• Most satisfied
• Most promoted
Working > 250 hours
per month
Common Traits of People Leaving
• Here the Y variable is Left?
• Goal : To predict which employee will leave
• Setup of Modelling
• Estimate the probabilities - in a binary case (1/0)
• Cut off Value = 0.5
• P (Y = 1) > 0.5 are classified as belonging to class 1,
whereas
• P (Y = 1) < 0.5 are classified as belonging to class 0.
Predictive Modeling
With All Predictors Without All Predictors
Misclassification
AICC
BIC
RMSE
• We will keep the model will all the predictors.
Logistic Regression
😧 😣Not that Great
ROC & Lift Curves
Logistic Regression
Partition Modeling
From the classification tree, the predicted class of people who will leave is
2038. The actual class of people who will leave is 2187. The error rate of
Left is 0.5%.
Fit Details
Partition Modeling
The column contributions reveal the most principal factors in the
model. Satisfaction level, years at the company, number of projects,
average monthly hours and last evaluation contribute 100% of the
model.
Column Contributions
Partition Modeling
ROC & Lift Curves
Partition Modeling
If the satisfaction level is above the median and the years at the company is
short, the employee will most likely not to leave.
If the satisfaction level is below the median but the number of projects
assigned is large, the employee will most likely leaving.
If the satisfaction level is above the median for some employees, if they are
not assigned a lot of projects, they will leave to seek more opportunities.
Leaf Report
Partition Modeling
Neural Nets
Neural Nets
Neural Nets
ROC & Lift Curves
Neural Nets
Performance Evaluation
Classification Matrix
Performance Evaluation
ROC and Lift Curves for Validation and Test
From above comparisons, we can see that on Validation and Test dataset the Decision
Trees outperforms all other models.
∙ Good R^2 values
∙ Least Root Mean Square Error
∙ Lower Misclassification Rate
z
Performance Evaluation
Conclusion
Satisfaction level Years of experience
Number of projects
Predictive modeling project

Predictive modeling project

  • 1.
    Human Resource Analytics “Acompany is only as good as the people it keeps” OPIM 5604 Predictive Modeling Apoorva Srivastava| Jin Zhao| Saurav Gupta| Yiming Liang| Vibhuti Upadhyay| Yulei Xia
  • 2.
    Introduction • 3.22 millionAmericans quit in Jan 2017 • Replacing entry level employee costs 50 percent of persons salary • Replacing higher level employee costs 250 percent of persons salary • Intellectual and monetary loss for the company WHY?
  • 3.
    Objective “Whether an employeewill leave or not?”
  • 4.
  • 5.
    Variable Name Satisfaction Level Last Evaluation Number of Projects Average Monthly Hours Years atthe Company Work Accidents? Promotion in the Last 5 Years? Department Salary Left? Data Type Numeric Numeric Numeric Numeric Numeric Character Character Character Character Character Modeling Type Continuous Continuous Continuous Continuous Continuous Nominal Nominal Nominal Ordinal Nominal Data Preprocessing Variable Name, Data Type & Modeling Type
  • 6.
  • 7.
    7142 rows leftfor future modeling process Left? Number of Rows 1 3571 0 3571 Data Preprocessing Stratification
  • 8.
    No Promotion 😕! More Projects More Work LEFT Data Visualization
  • 9.
    Who has spent4-5 years at the company LEFT Data Visualization Also these people are the one who work more than 250 hours at work
  • 10.
    People who have •Low And Medium salary • Low satisfaction level • Work more average hours LEFT Data Visualization
  • 11.
    Most people wholeft were part of HR and Accounting 😒 People in R&D, Product Mgmt., and Marketing are amongst the least likely to leave. Most promotions happens in R&D, Management, and Marketing. Data Visualization | Department Trends
  • 12.
    Marketing, R&D &Product Mgmt. Accounting, Tech and Support Turnover Likely to stay Likely to leave Satisfaction Most satisfied Not satisfied Performance Evaluation Low High Hours worked Amongst lowest Amongst highest Promotions Most promoted Least promoted Discovery Based on Departments Firm depends on Marketing and R&D i.e. why these folks tend to get promoted more easily • Hardest working people. • Higher performance evaluations • But amongst the least satisfied, and least promoted • Work less as far as hours • Most satisfied • Most promoted
  • 13.
    Working > 250hours per month Common Traits of People Leaving
  • 14.
    • Here theY variable is Left? • Goal : To predict which employee will leave • Setup of Modelling • Estimate the probabilities - in a binary case (1/0) • Cut off Value = 0.5 • P (Y = 1) > 0.5 are classified as belonging to class 1, whereas • P (Y = 1) < 0.5 are classified as belonging to class 0. Predictive Modeling
  • 15.
    With All PredictorsWithout All Predictors Misclassification AICC BIC RMSE • We will keep the model will all the predictors. Logistic Regression
  • 16.
    😧 😣Not thatGreat ROC & Lift Curves Logistic Regression
  • 17.
  • 18.
    From the classificationtree, the predicted class of people who will leave is 2038. The actual class of people who will leave is 2187. The error rate of Left is 0.5%. Fit Details Partition Modeling
  • 19.
    The column contributionsreveal the most principal factors in the model. Satisfaction level, years at the company, number of projects, average monthly hours and last evaluation contribute 100% of the model. Column Contributions Partition Modeling
  • 20.
    ROC & LiftCurves Partition Modeling
  • 21.
    If the satisfactionlevel is above the median and the years at the company is short, the employee will most likely not to leave. If the satisfaction level is below the median but the number of projects assigned is large, the employee will most likely leaving. If the satisfaction level is above the median for some employees, if they are not assigned a lot of projects, they will leave to seek more opportunities. Leaf Report Partition Modeling
  • 22.
  • 23.
  • 24.
  • 25.
    ROC & LiftCurves Neural Nets
  • 26.
  • 27.
    Performance Evaluation ROC andLift Curves for Validation and Test
  • 28.
    From above comparisons,we can see that on Validation and Test dataset the Decision Trees outperforms all other models. ∙ Good R^2 values ∙ Least Root Mean Square Error ∙ Lower Misclassification Rate z Performance Evaluation
  • 29.
    Conclusion Satisfaction level Yearsof experience Number of projects