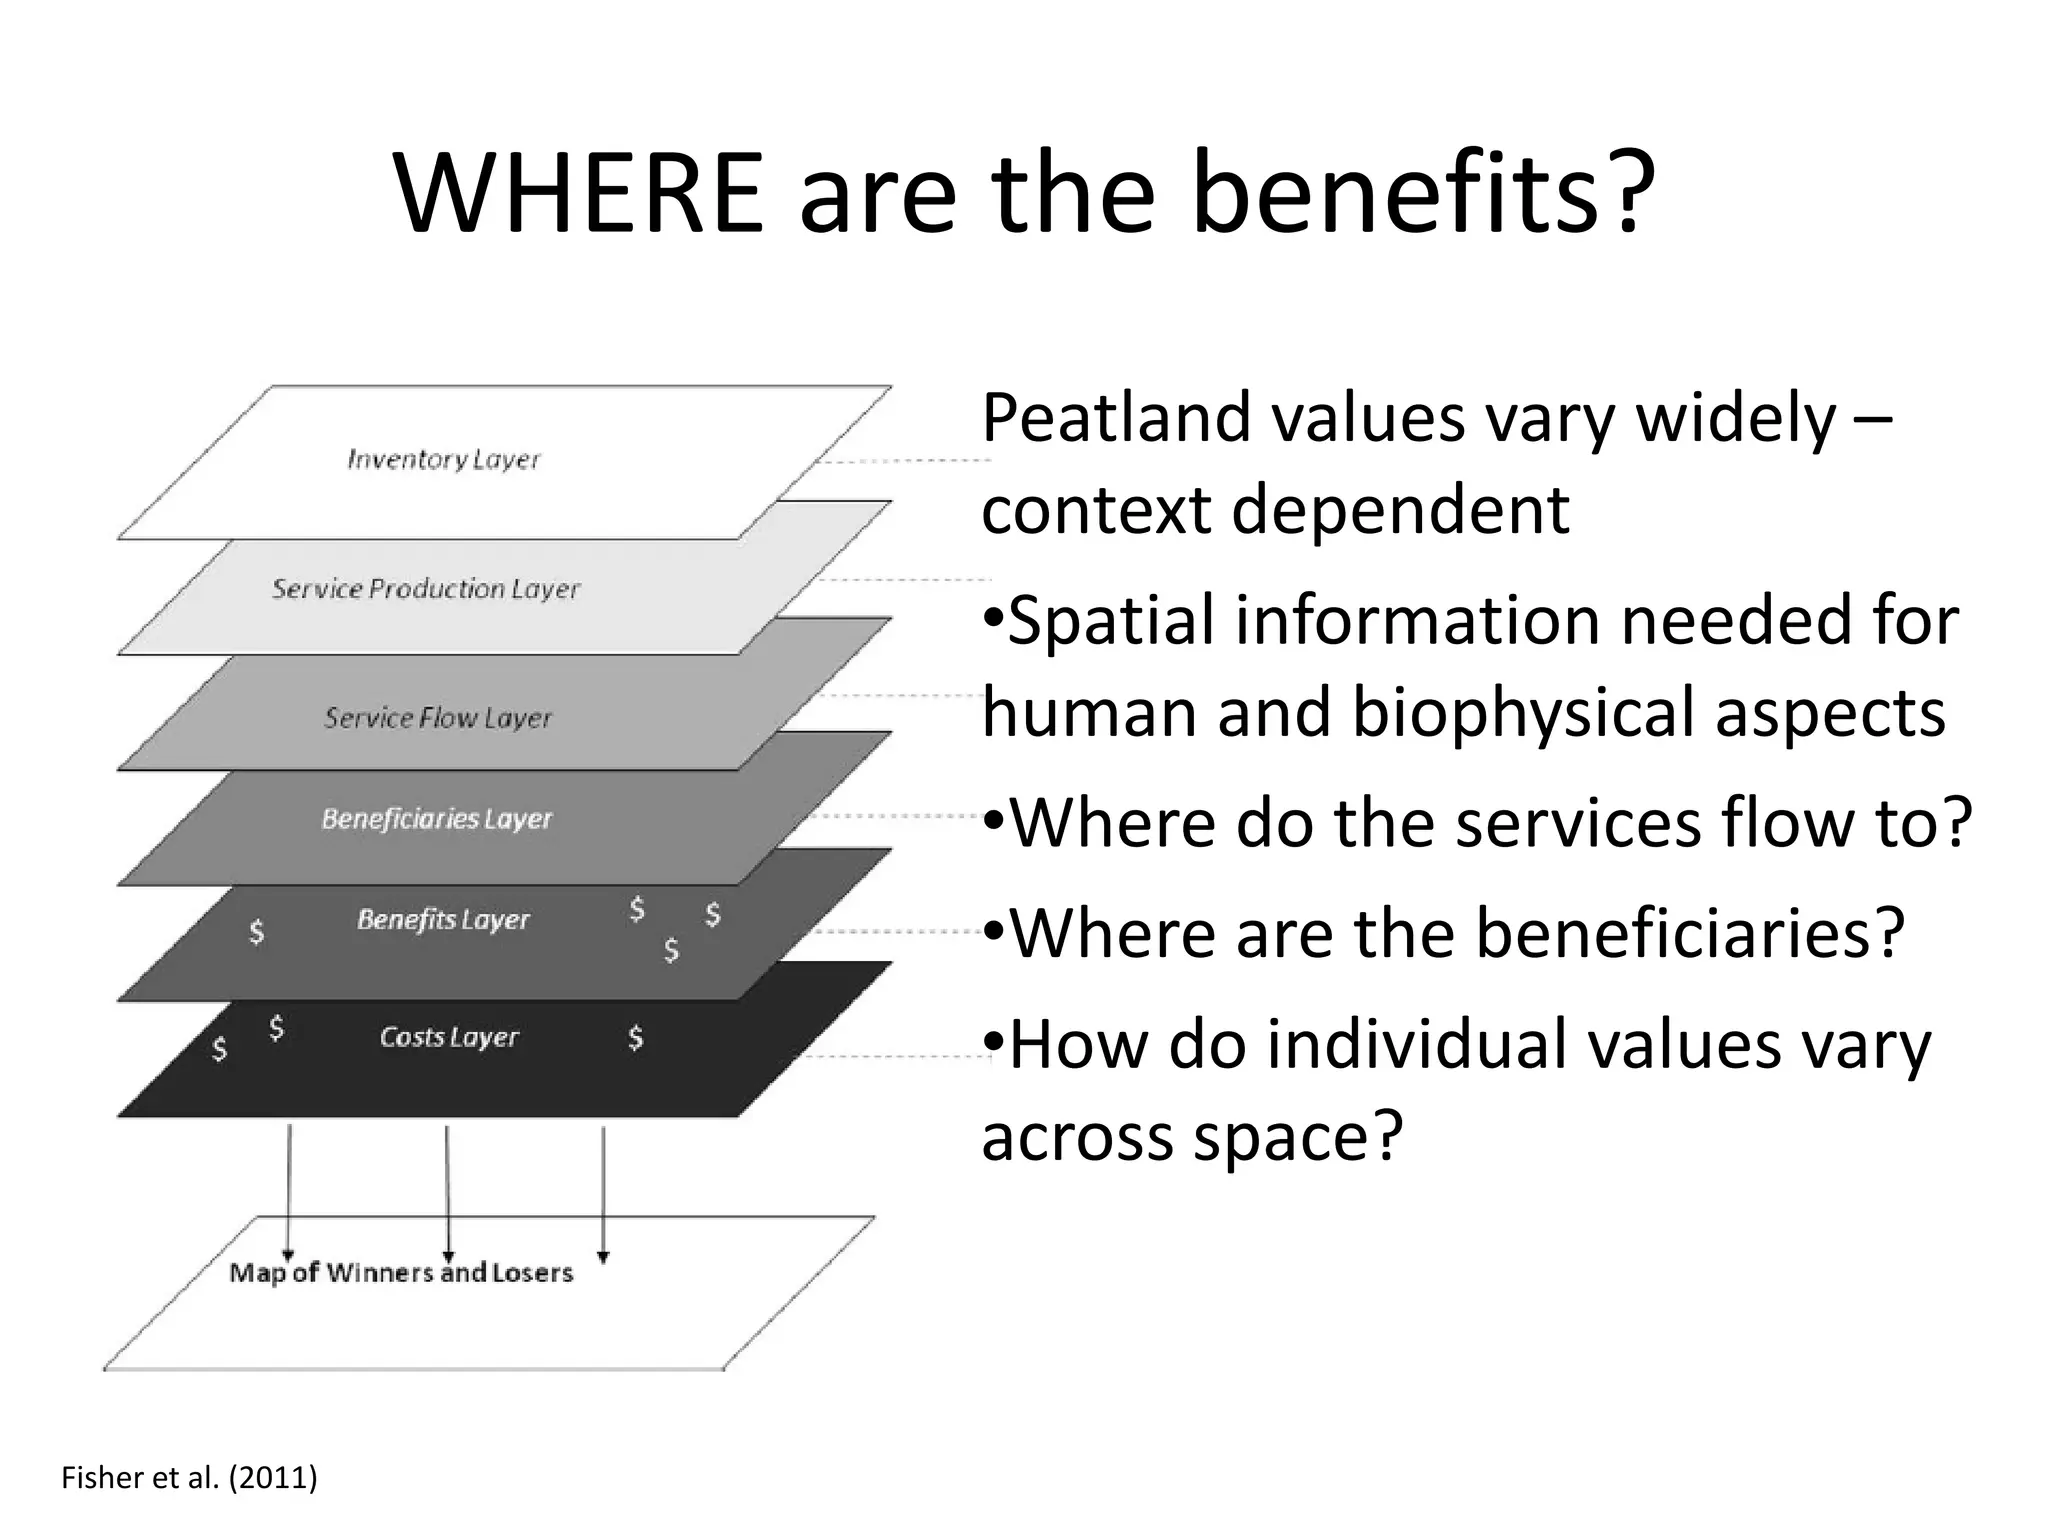
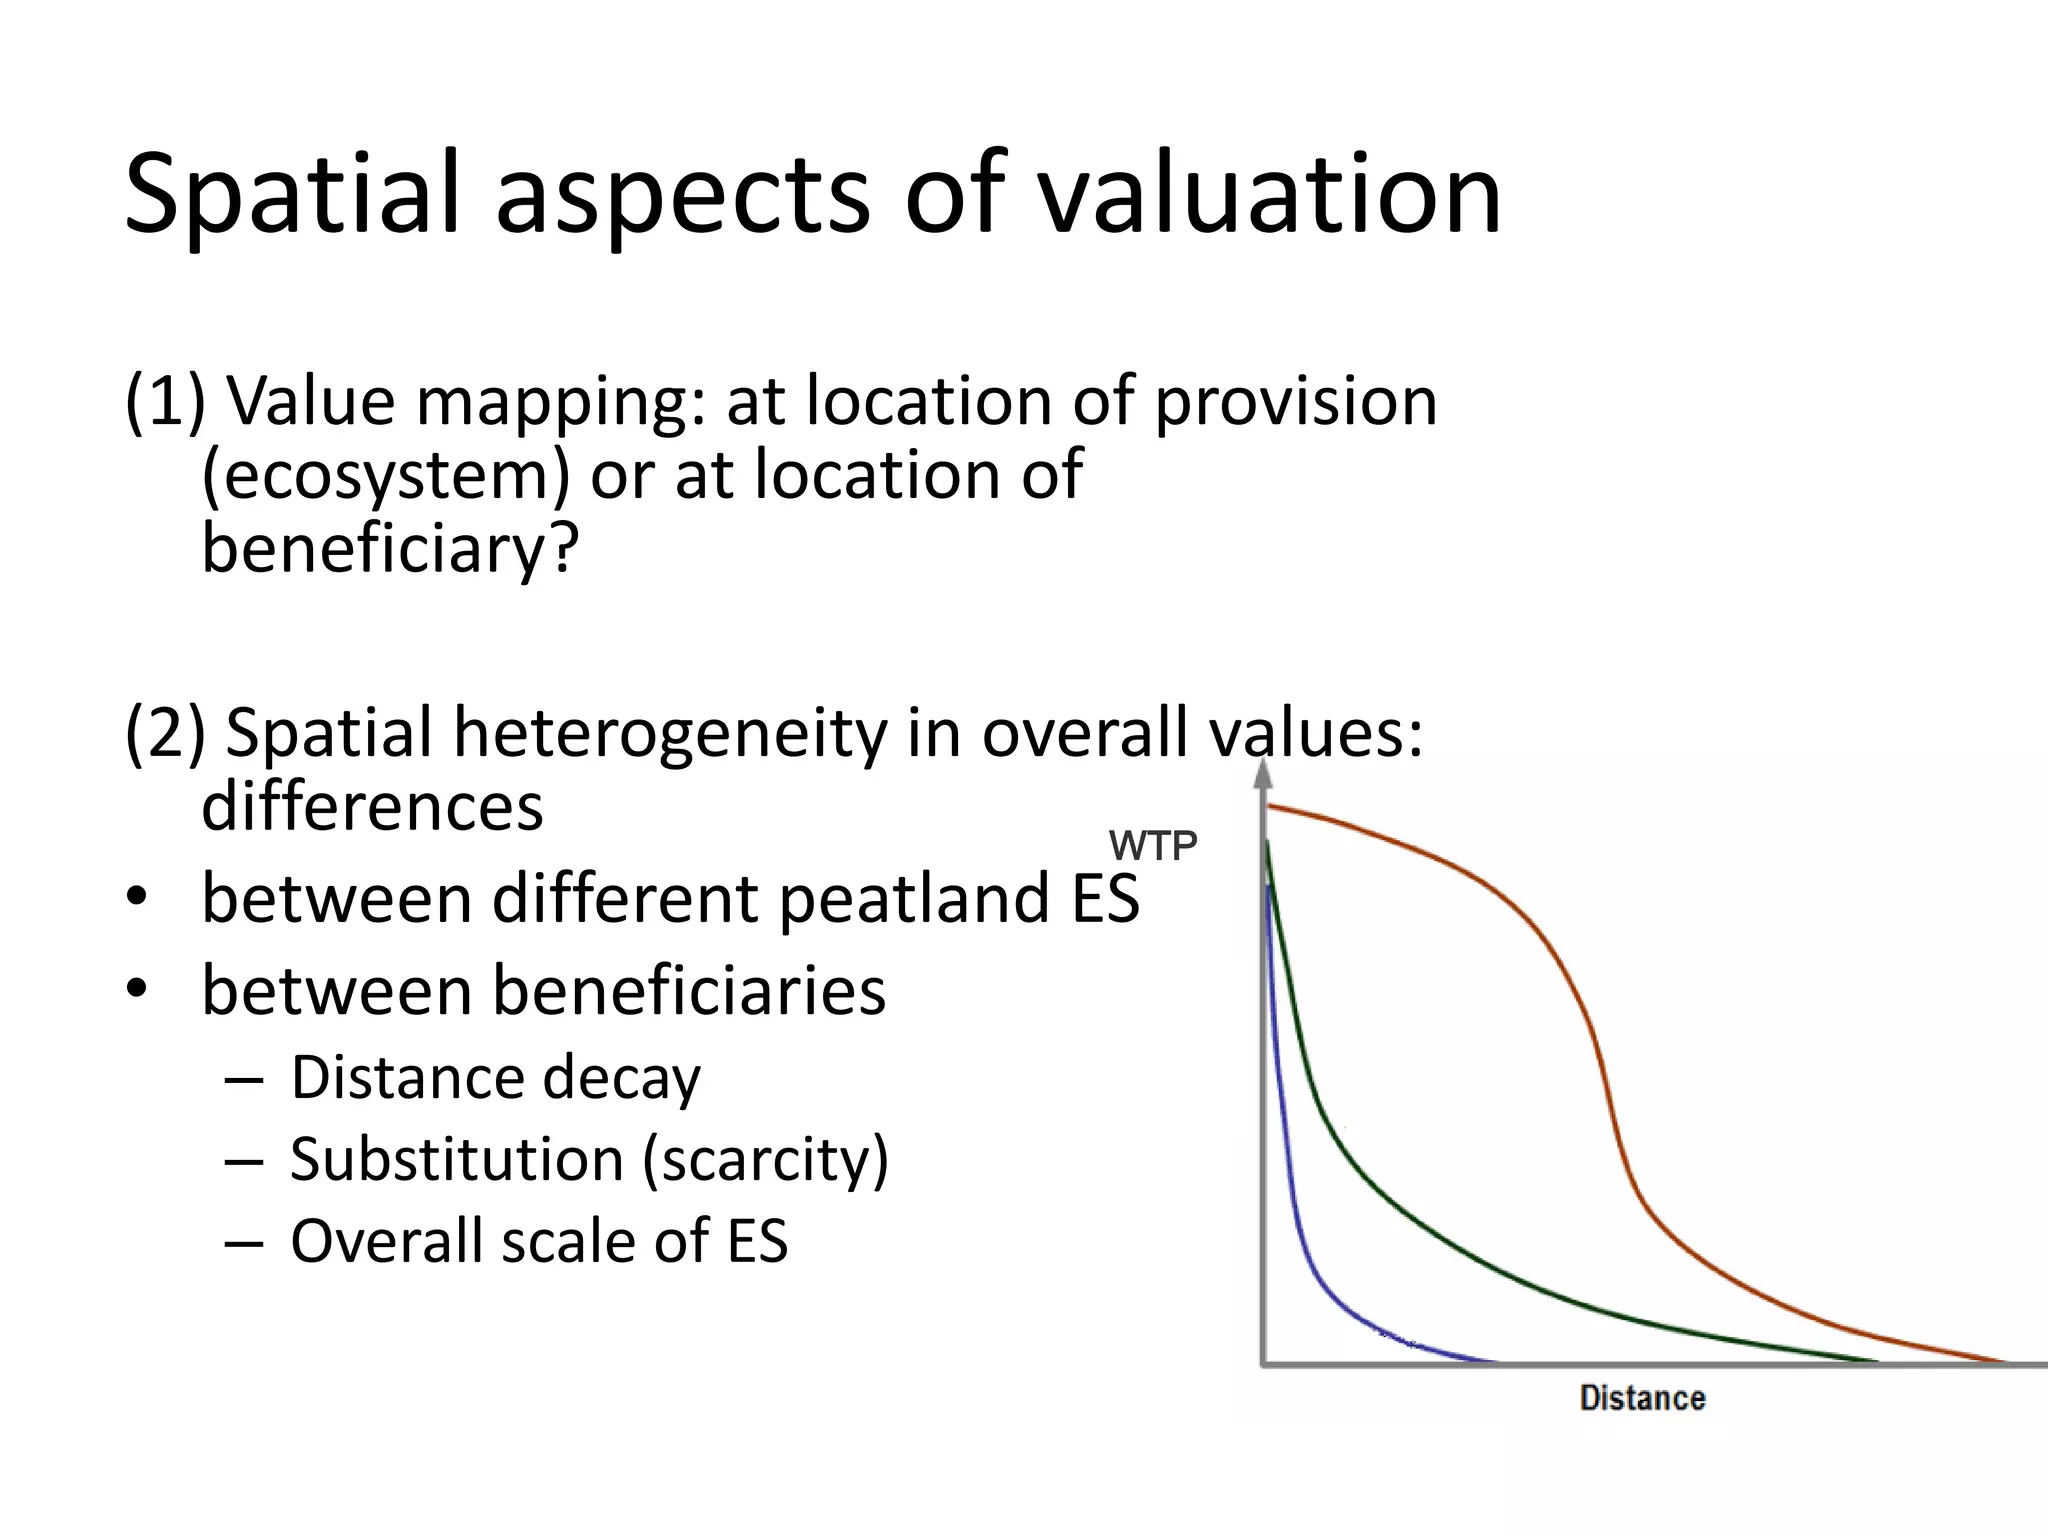
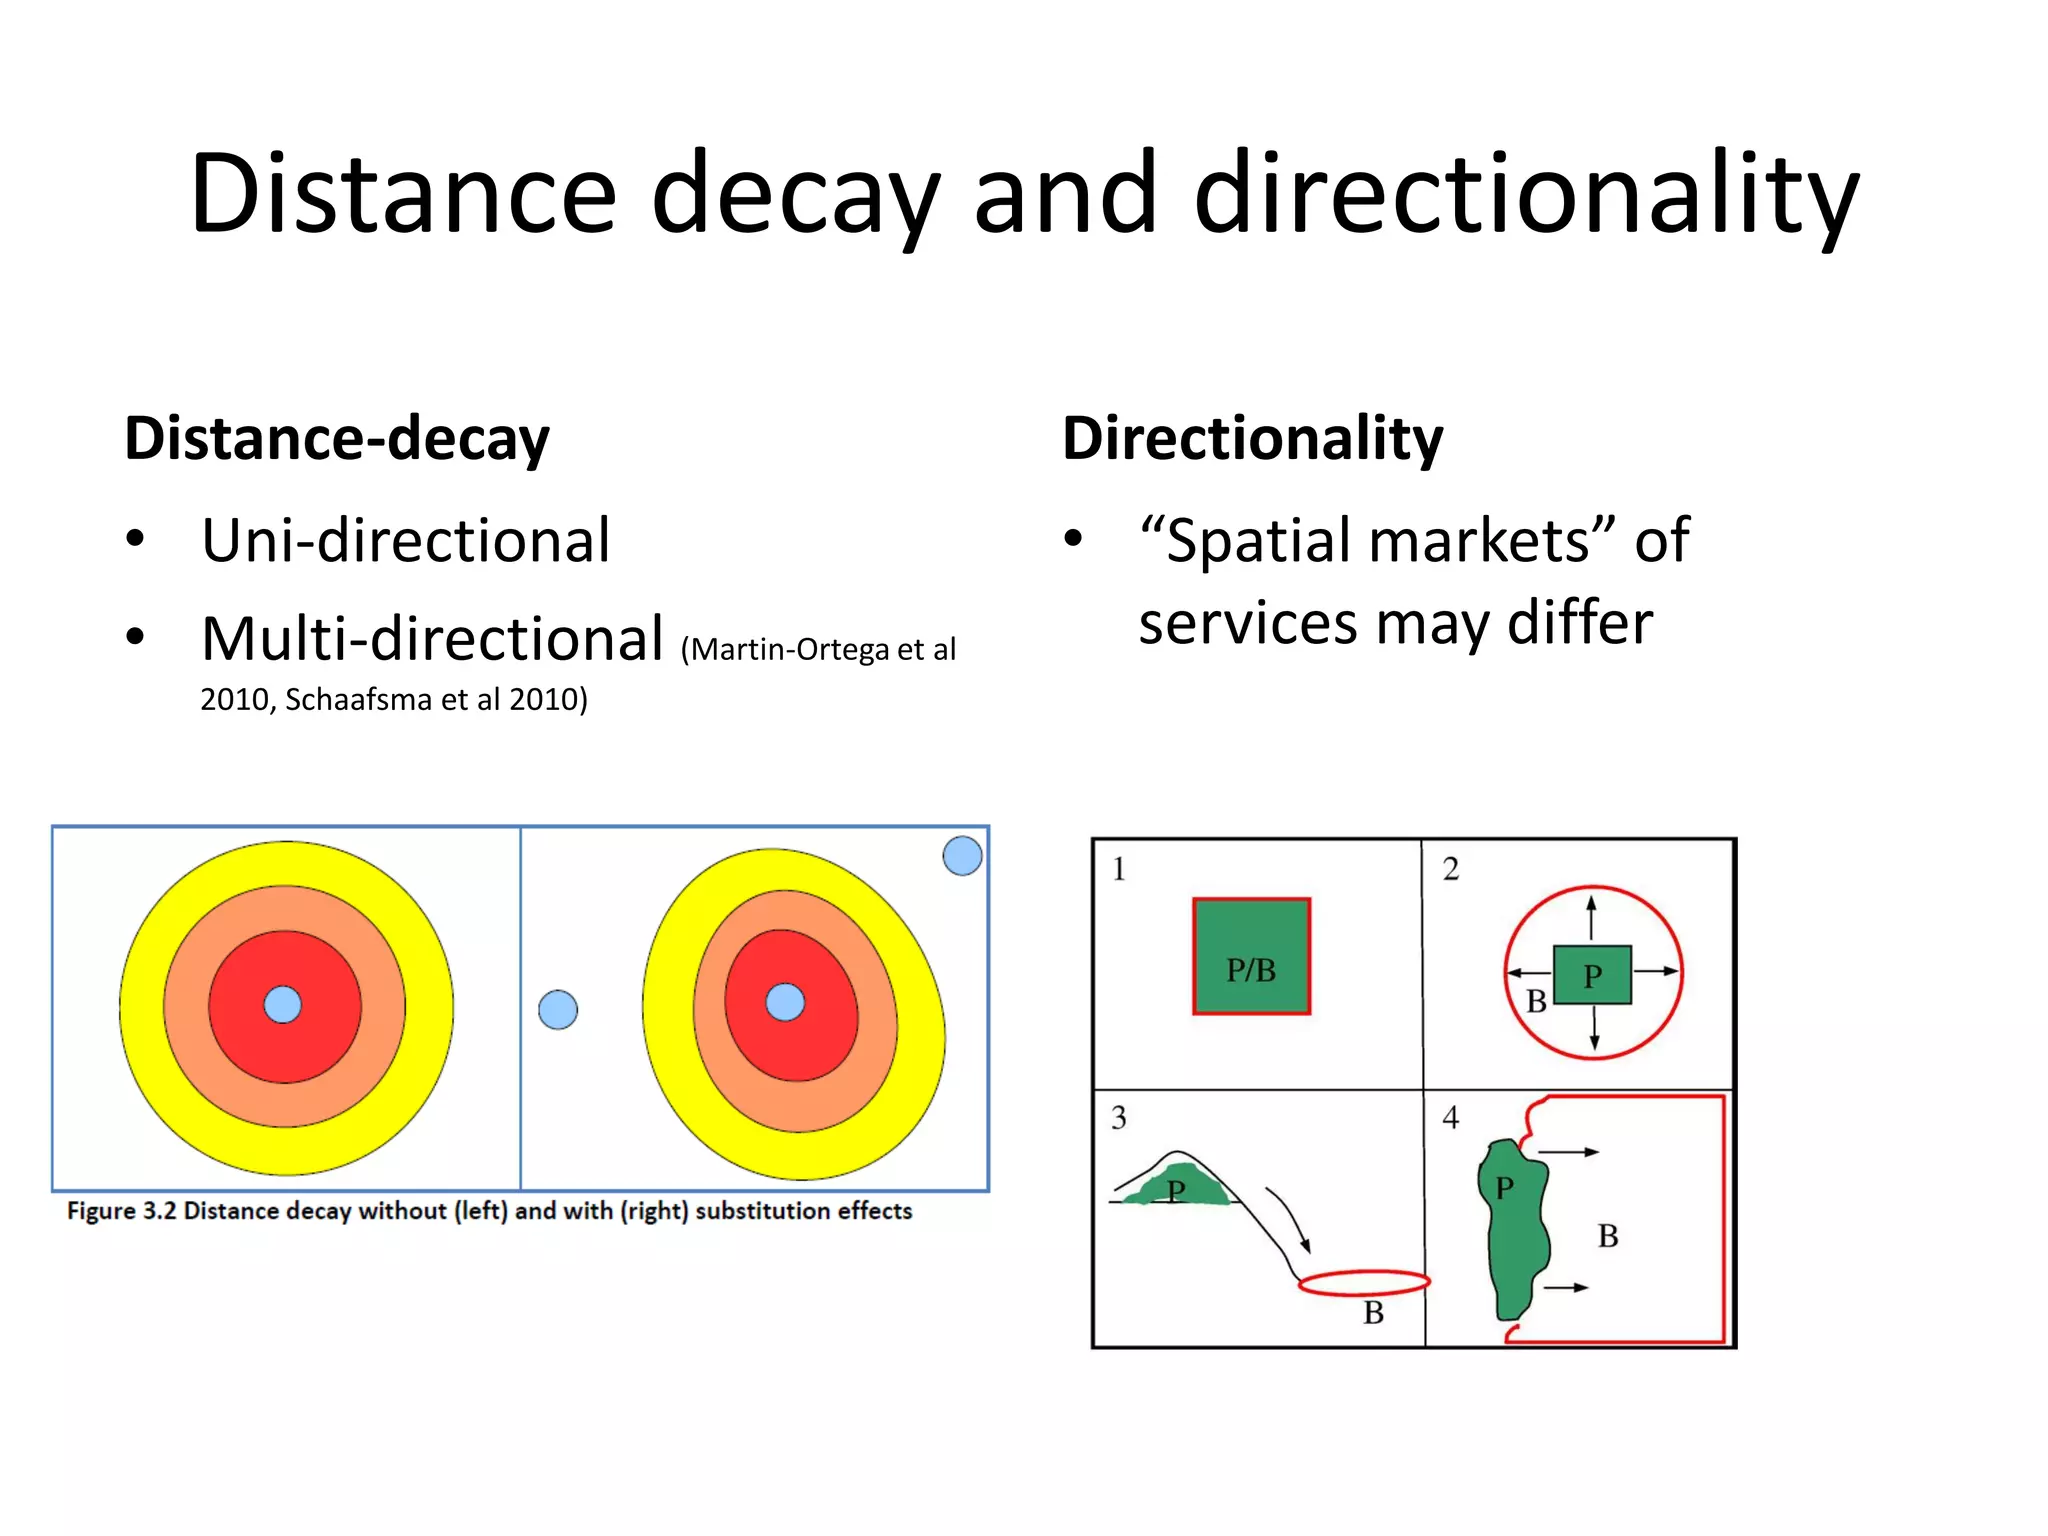
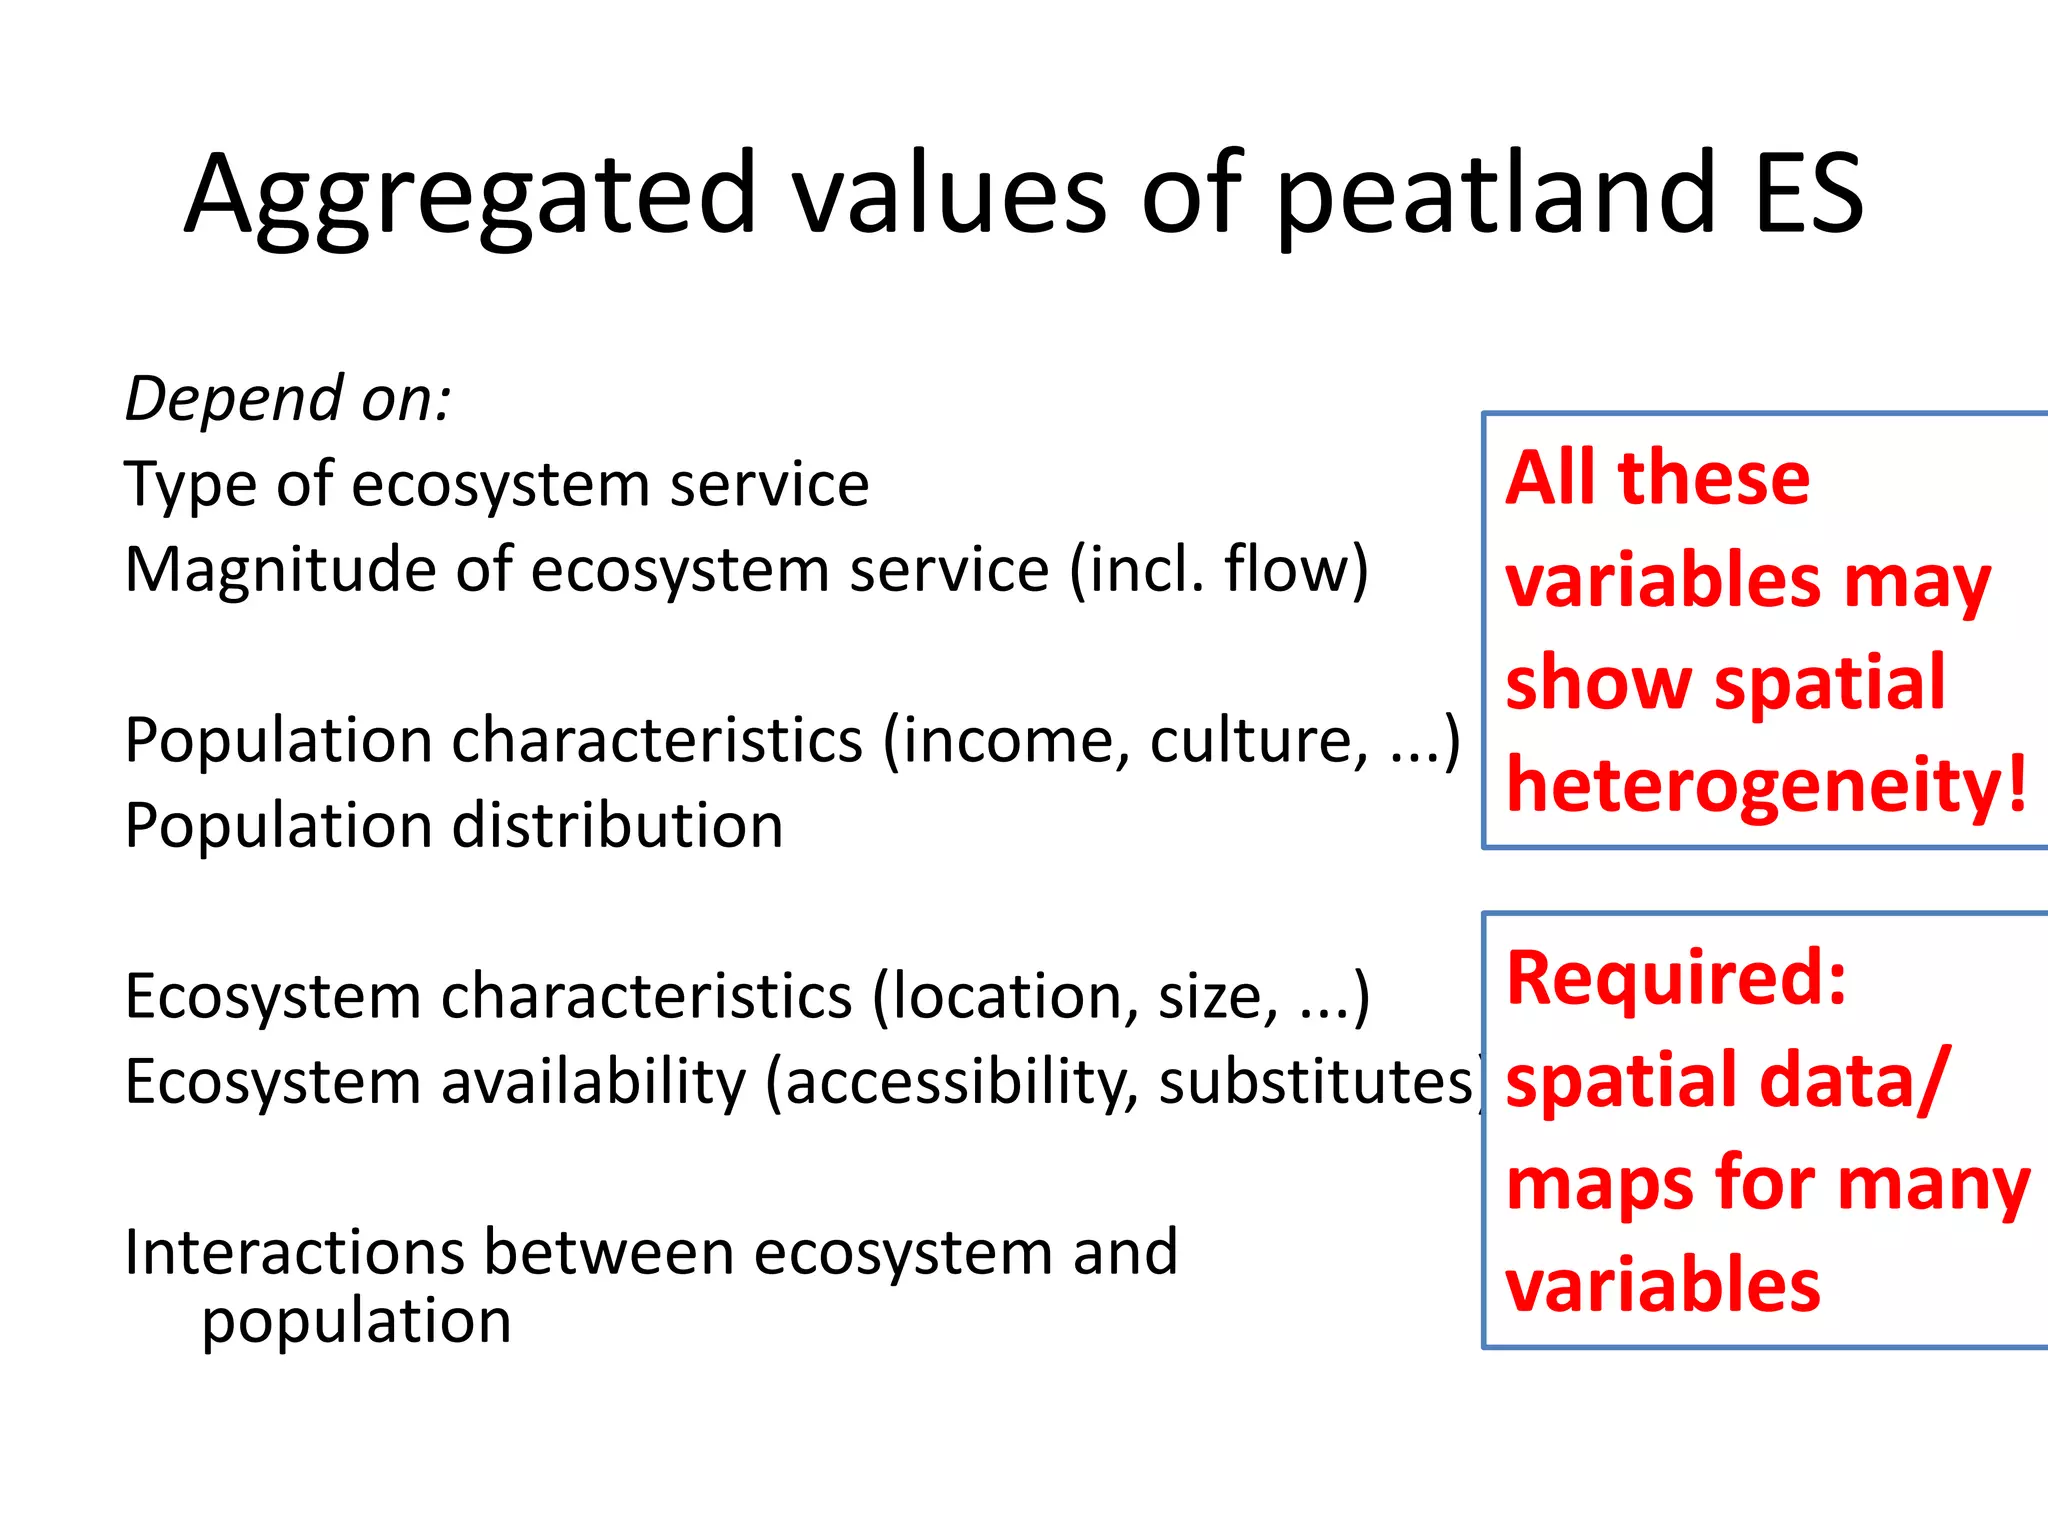
Space and scale issues in valuation
of ecosystem services of peatlands
            in the UK
            Marije Schaafsma
               CSERGE, UK
           VNN – 18-19 Jan 2012
Monetary valuation
• WHAT does the ecosystem provide?
• WHERE do these ES flow to?
• By HOW MUCH does this provision
  CHANGE if the ecosystem changes?
• WHO are the main beneficiaries?
  WHERE are they located?
• HOW MUCH do they benefit from
  the ecosystem services?
What does the ecosystem provide?
Ecosystem services of peatlands           Scale of benefits   Valuation method
Carbon sequestration / regulation         Global              Market/cost-based
Biodiversity, landscape                   Regional - Global   Stated Preference
Water (supply / quality regulation)       Regional            Stated Preference, cost
                                                              -based
Recreation (walking, wildlife watching)   Local – Regional    Travel cost
Pasture/Agricultural land                 Local - Regional    Market prices
Raw material (peat)                       Local – Regional?   Market prices
Game, materials (reed, timber)            Local               Market prices
?
?
See Wichmann et al (in press, CUP)
1. Quantification of the physical flows of
   these services is required for valuation
2. Development options: consider the
   opportunity costs of conservation
Marginal valuation: change in ES provision

• Economic valuation:
   – Market (financial) and non-market
     benefits
• Scenario: BAU => Alternative future
• Change in ES provision (flow) => utility
  (welfare) change   (Turner et al. 2010)

   – Marginal change: relatively small change,
     no large-scale state change (matter of
     scale)
   – Not near thresholds
   – Avoid double counting in total value
     estimation
Example: Carbon valuation
• Annual value depends on annual change in
  carbon stock
   – annual storage increase (+) or peatland
     conversion (-), sequestration (+), product
     emissions (-) and peatland degradation (-)
• Do not value total stock; only (avoided)
  changes in flow
   – BAU: risk of conversion?
• Several price indices:
   – Market prices (EU)
   – DECC rates (abatement costs)
   – Social cost of carbon (Tol, etc)
• £/tC does not vary across space, but costs and
  co-benefits of carbon-related projects may
WHERE are the benefits?
                                 Peatland values vary widely –
                                 context dependent
                                 •Spatial information needed for
                                 human and biophysical aspects
                                 •Where do the services flow to?
                                 •Where are the beneficiaries?
                                 •How do individual values vary
                                 across space?


Fisher et al. (2011)
Spatial aspects of valuation
(1) Value mapping: at location of provision
   (ecosystem) or at location of
   beneficiary?

(2) Spatial heterogeneity in overall values:
   differences                   WTP
• between different peatland ES
• between beneficiaries
   – Distance decay
   – Substitution (scarcity)
   – Overall scale of ES
Distance decay and directionality
Distance-decay                             Directionality
• Uni-directional                          • “Spatial markets” of
• Multi-directional (Martin-Ortega et al      services may differ
   2010, Schaafsma et al 2010)
Aggregated values of peatland ES
Depend on:
Type of ecosystem service                         All these
Magnitude of ecosystem service (incl. flow)       variables may
                                                  show spatial
Population characteristics (income, culture, ...)
Population distribution
                                                  heterogeneity!

Ecosystem characteristics (location, size, ...)     Required:
Ecosystem availability (accessibility, substitutes) spatial data/
                                                 maps for many
Interactions between ecosystem and
   population                                    variables
Scale issues
• Different actors at different scales:
   – Optimising local benefits may not be
     globally optimal
   – Carbon vs Water
• biophysical boundaries vs
  Economic markets vs
  policy jurisdictions
   – Cross-boundary (political)
     collaboration
      • Directionality
          – Examples from international riverbasin
            cooperation
Peatland valuation in NEA (1)
• Benefit transfer: use values from (multiple) study
  sites to value larger policy site (UK)
   – Reliability of transfer depends on
      • Comparability of the good under valuation
      • Comparability of the sites and populations
          – potential of site to provide ES depends on location (e.g. flood risk)
      • Soundness of original valuation study
   – Required reliability depends on scale of analysis/policy:
      • benefit transfer sufficient or local/site-specific values
        required?
• There are very few primary valuation studies
  about peatlands
Peatland valuation in NEA (2)
No specific peatland values – MMH?
Carbon
• Soil carbon values were based land use model / land conversion
• Distinction between peat and non-peat soils
• Fixed estimates for England, Wales, and Scotland & carbon pools
Cultural heritage values, recreation: not specific to peatlands
• but applicable to more general upland studies. Probably heterogeneous.
• Recreation models based on English data
Water quality:
• Benefits from avoided costs of treatment around £5 million over 10 years
   (n=1) , but coloration, etc. (Julia)
Biodiversity non-use values: Brander et al. wetlands meta-analysis
• Original studies from Italy, the Netherlands, Sweden, UK (1, 1991):
• peatlands have lowest value of all wetland types, no carbon values.
References
• Brander et al. (2012) Scaling up ecosystem services values:
  methodology, applicability, and a case study, ERE
• Fisher et al. (2009) Defining and classifying ecosystem services for
  decision making. Ecological Economics 68: 643–653
• Fisher et al. (2011) Measuring, modeling and mapping ecosystem
  services in the Eastern Arc Mountains of Tanzania. Progress in
  Physical Geography 2011 35: 595
• Martin-Ortega et al (2010)
• Schaafsma (2010) Spatial effects in Stated Preference Studies for
  Environmental Valuation, PhD VU University Amsterdam.
• Tinch et al. 2010
• Turner et al. (2010) Ecosystem valuation: A sequential decision
  support system and quality assessment issues, ANYAS 1185: 79–101
• Wichmann et al (in press) Valuing peatland ecosystem services. CUP

Who benefits from what and where? Considerations of scale and methods for valuing from peatland restoration & conservation

  • 1.
    Space and scaleissues in valuation of ecosystem services of peatlands in the UK Marije Schaafsma CSERGE, UK VNN – 18-19 Jan 2012
  • 2.
    Monetary valuation • WHATdoes the ecosystem provide? • WHERE do these ES flow to? • By HOW MUCH does this provision CHANGE if the ecosystem changes? • WHO are the main beneficiaries? WHERE are they located? • HOW MUCH do they benefit from the ecosystem services?
  • 3.
    What does theecosystem provide? Ecosystem services of peatlands Scale of benefits Valuation method Carbon sequestration / regulation Global Market/cost-based Biodiversity, landscape Regional - Global Stated Preference Water (supply / quality regulation) Regional Stated Preference, cost -based Recreation (walking, wildlife watching) Local – Regional Travel cost Pasture/Agricultural land Local - Regional Market prices Raw material (peat) Local – Regional? Market prices Game, materials (reed, timber) Local Market prices ? ? See Wichmann et al (in press, CUP) 1. Quantification of the physical flows of these services is required for valuation 2. Development options: consider the opportunity costs of conservation
  • 4.
    Marginal valuation: changein ES provision • Economic valuation: – Market (financial) and non-market benefits • Scenario: BAU => Alternative future • Change in ES provision (flow) => utility (welfare) change (Turner et al. 2010) – Marginal change: relatively small change, no large-scale state change (matter of scale) – Not near thresholds – Avoid double counting in total value estimation
  • 5.
    Example: Carbon valuation •Annual value depends on annual change in carbon stock – annual storage increase (+) or peatland conversion (-), sequestration (+), product emissions (-) and peatland degradation (-) • Do not value total stock; only (avoided) changes in flow – BAU: risk of conversion? • Several price indices: – Market prices (EU) – DECC rates (abatement costs) – Social cost of carbon (Tol, etc) • £/tC does not vary across space, but costs and co-benefits of carbon-related projects may
  • 6.
    WHERE are thebenefits? Peatland values vary widely – context dependent •Spatial information needed for human and biophysical aspects •Where do the services flow to? •Where are the beneficiaries? •How do individual values vary across space? Fisher et al. (2011)
  • 7.
    Spatial aspects ofvaluation (1) Value mapping: at location of provision (ecosystem) or at location of beneficiary? (2) Spatial heterogeneity in overall values: differences WTP • between different peatland ES • between beneficiaries – Distance decay – Substitution (scarcity) – Overall scale of ES
  • 8.
    Distance decay anddirectionality Distance-decay Directionality • Uni-directional • “Spatial markets” of • Multi-directional (Martin-Ortega et al services may differ 2010, Schaafsma et al 2010)
  • 9.
    Aggregated values ofpeatland ES Depend on: Type of ecosystem service All these Magnitude of ecosystem service (incl. flow) variables may show spatial Population characteristics (income, culture, ...) Population distribution heterogeneity! Ecosystem characteristics (location, size, ...) Required: Ecosystem availability (accessibility, substitutes) spatial data/ maps for many Interactions between ecosystem and population variables
  • 10.
    Scale issues • Differentactors at different scales: – Optimising local benefits may not be globally optimal – Carbon vs Water • biophysical boundaries vs Economic markets vs policy jurisdictions – Cross-boundary (political) collaboration • Directionality – Examples from international riverbasin cooperation
  • 11.
    Peatland valuation inNEA (1) • Benefit transfer: use values from (multiple) study sites to value larger policy site (UK) – Reliability of transfer depends on • Comparability of the good under valuation • Comparability of the sites and populations – potential of site to provide ES depends on location (e.g. flood risk) • Soundness of original valuation study – Required reliability depends on scale of analysis/policy: • benefit transfer sufficient or local/site-specific values required? • There are very few primary valuation studies about peatlands
  • 12.
    Peatland valuation inNEA (2) No specific peatland values – MMH? Carbon • Soil carbon values were based land use model / land conversion • Distinction between peat and non-peat soils • Fixed estimates for England, Wales, and Scotland & carbon pools Cultural heritage values, recreation: not specific to peatlands • but applicable to more general upland studies. Probably heterogeneous. • Recreation models based on English data Water quality: • Benefits from avoided costs of treatment around £5 million over 10 years (n=1) , but coloration, etc. (Julia) Biodiversity non-use values: Brander et al. wetlands meta-analysis • Original studies from Italy, the Netherlands, Sweden, UK (1, 1991): • peatlands have lowest value of all wetland types, no carbon values.
  • 13.
    References • Brander etal. (2012) Scaling up ecosystem services values: methodology, applicability, and a case study, ERE • Fisher et al. (2009) Defining and classifying ecosystem services for decision making. Ecological Economics 68: 643–653 • Fisher et al. (2011) Measuring, modeling and mapping ecosystem services in the Eastern Arc Mountains of Tanzania. Progress in Physical Geography 2011 35: 595 • Martin-Ortega et al (2010) • Schaafsma (2010) Spatial effects in Stated Preference Studies for Environmental Valuation, PhD VU University Amsterdam. • Tinch et al. 2010 • Turner et al. (2010) Ecosystem valuation: A sequential decision support system and quality assessment issues, ANYAS 1185: 79–101 • Wichmann et al (in press) Valuing peatland ecosystem services. CUP