Download as PDF, PPTX
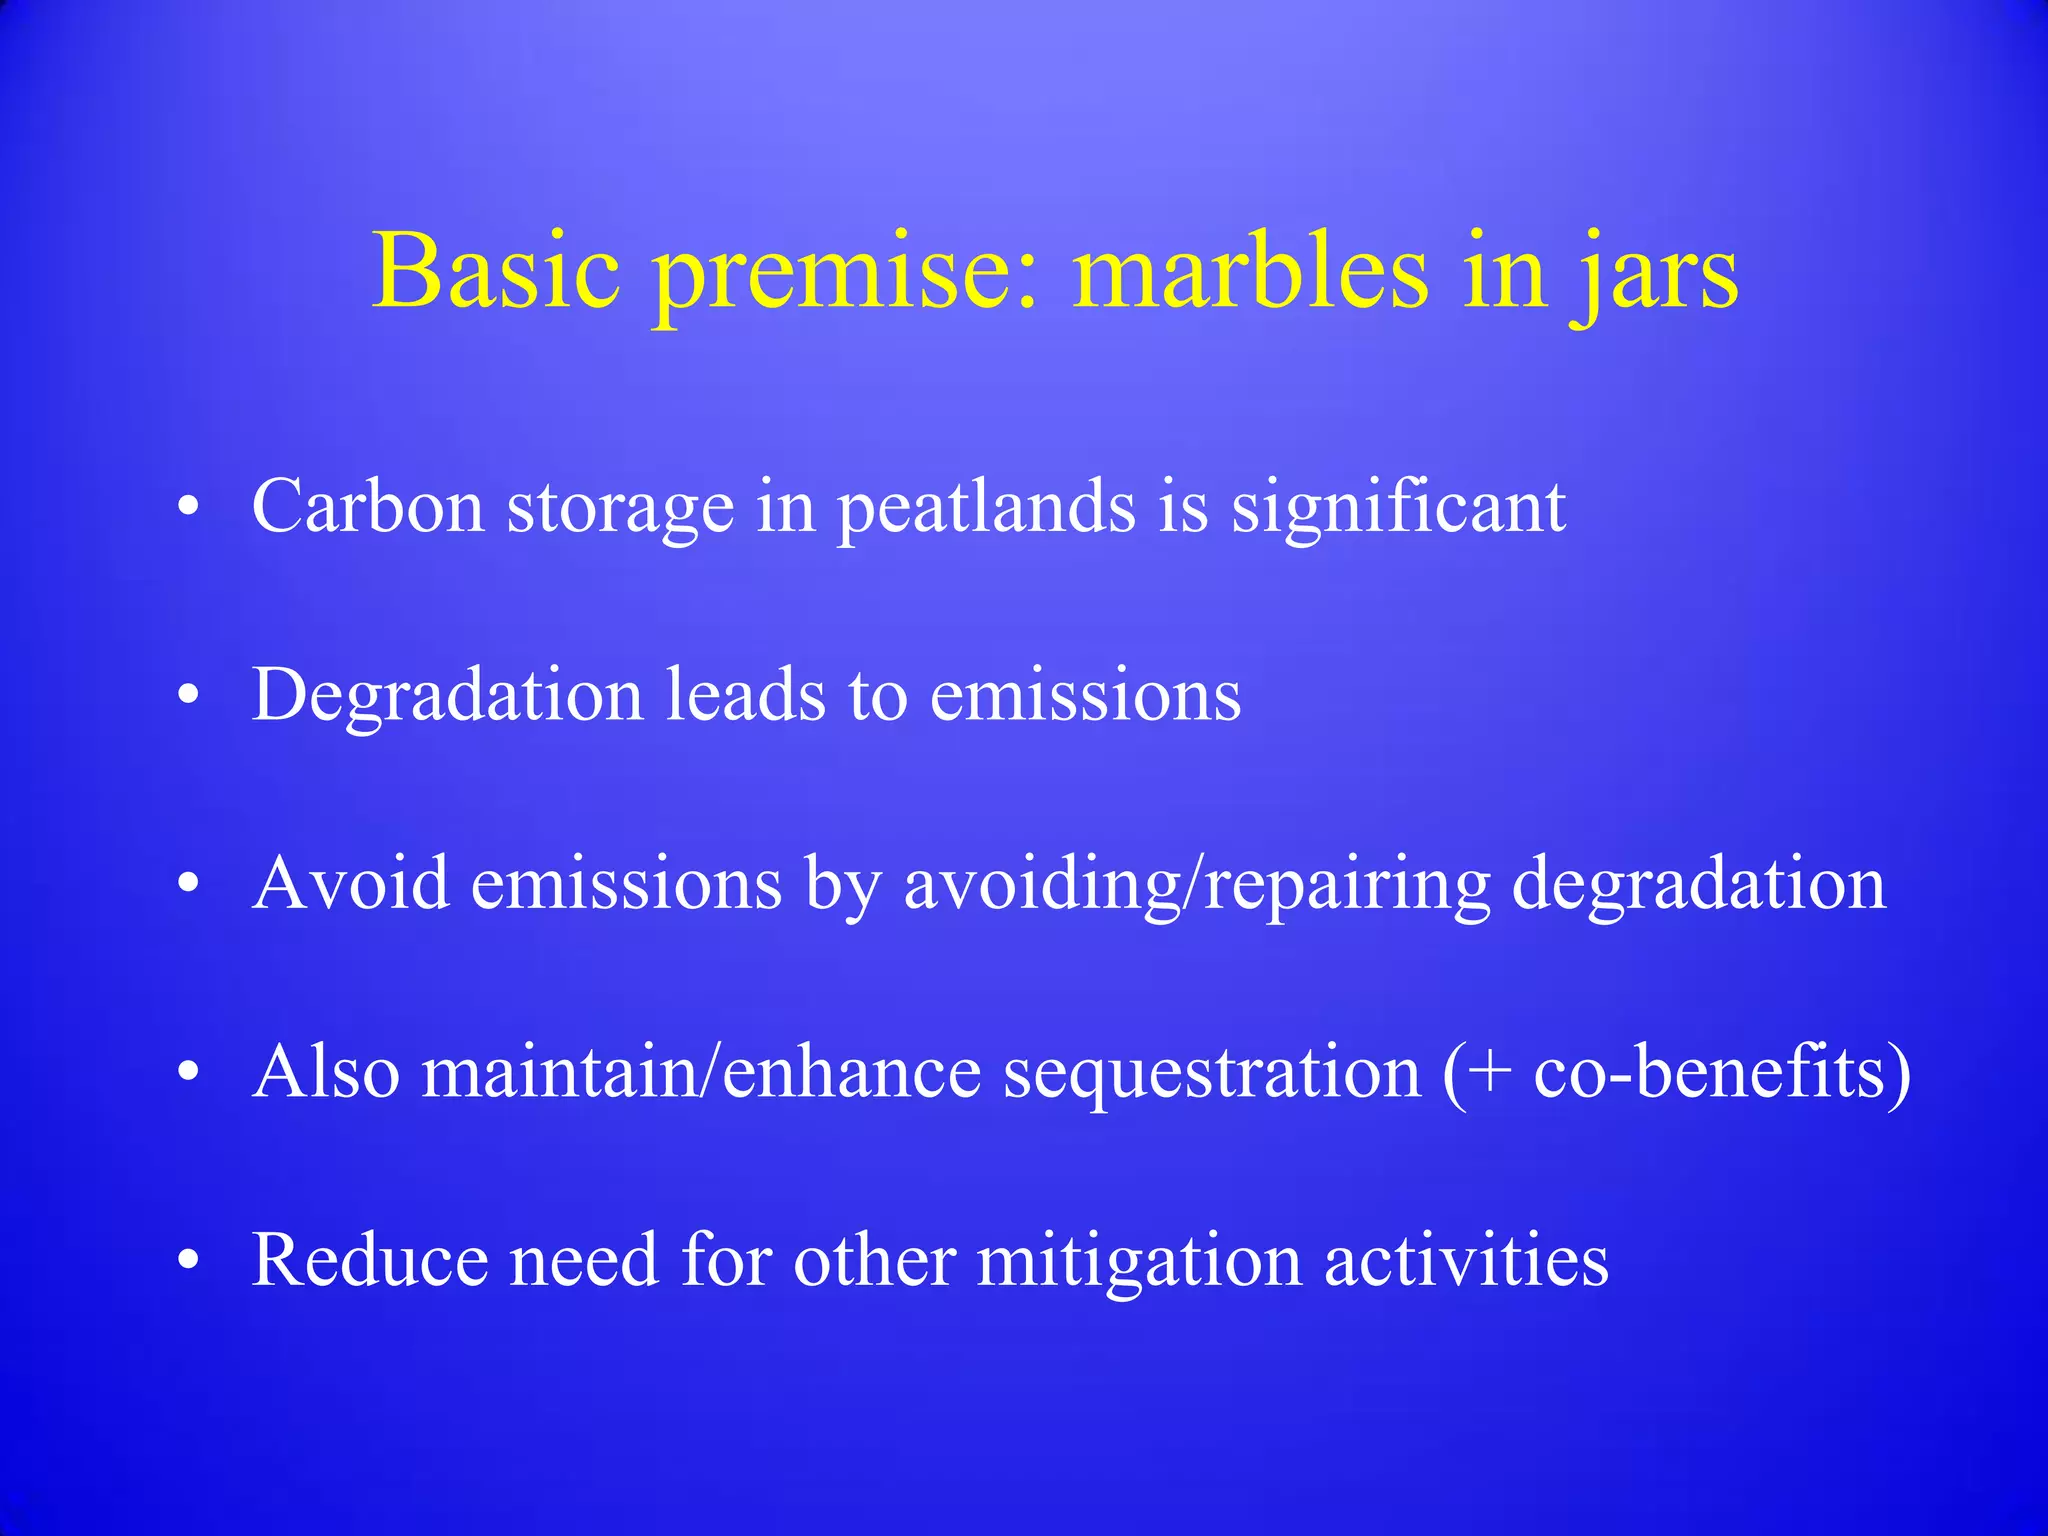
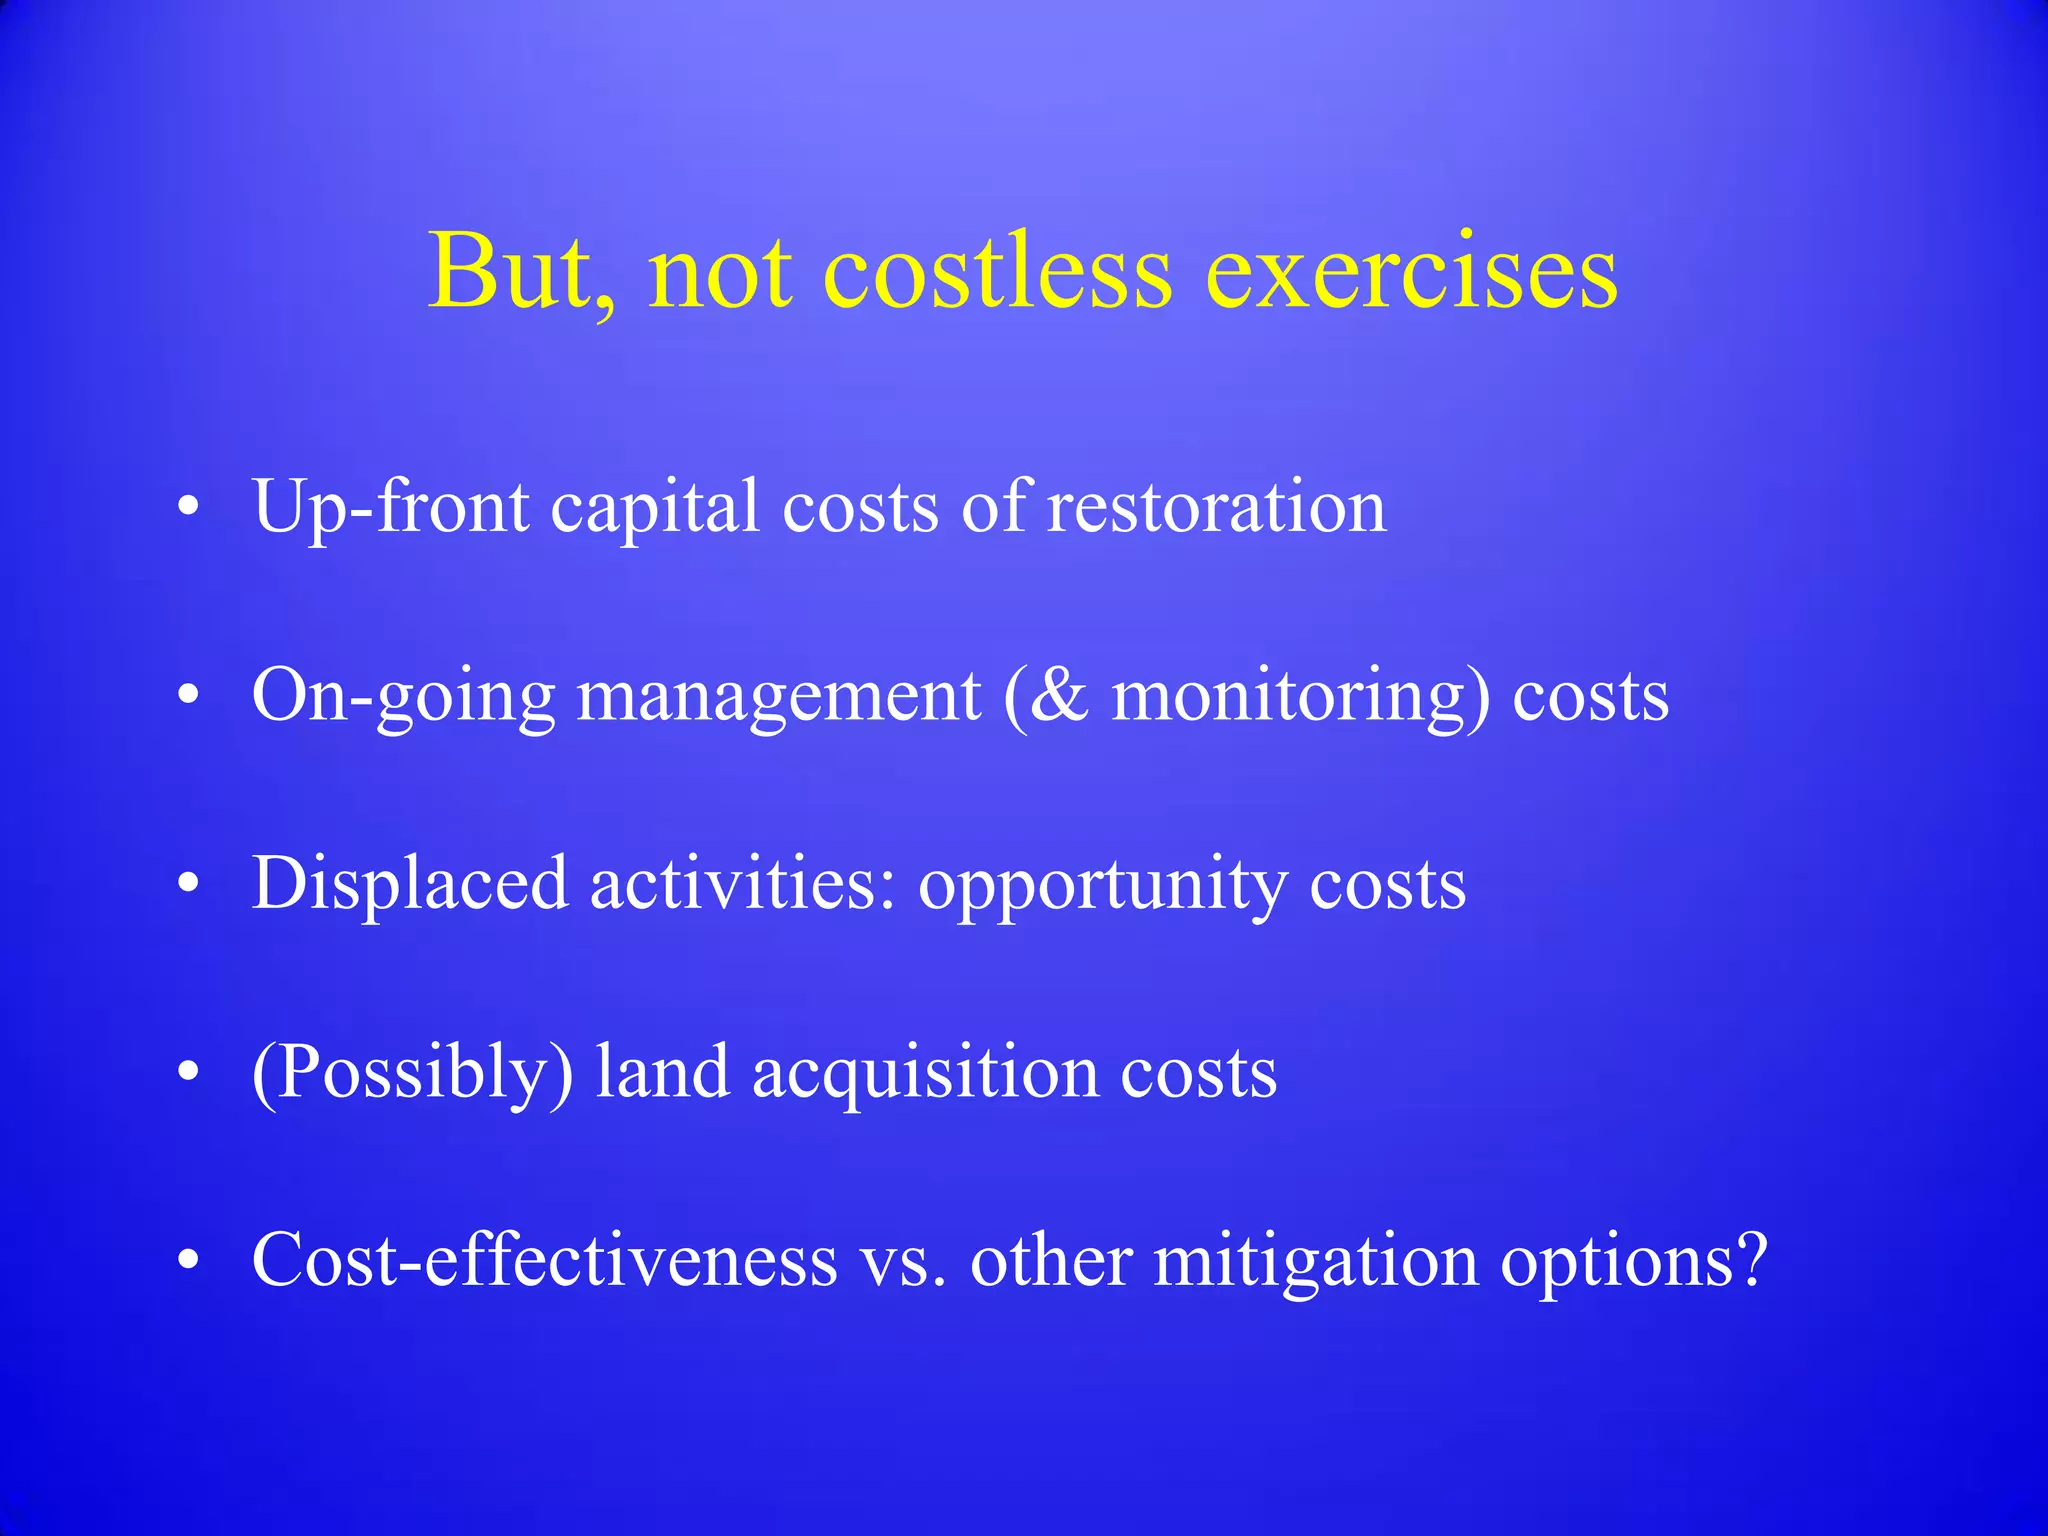
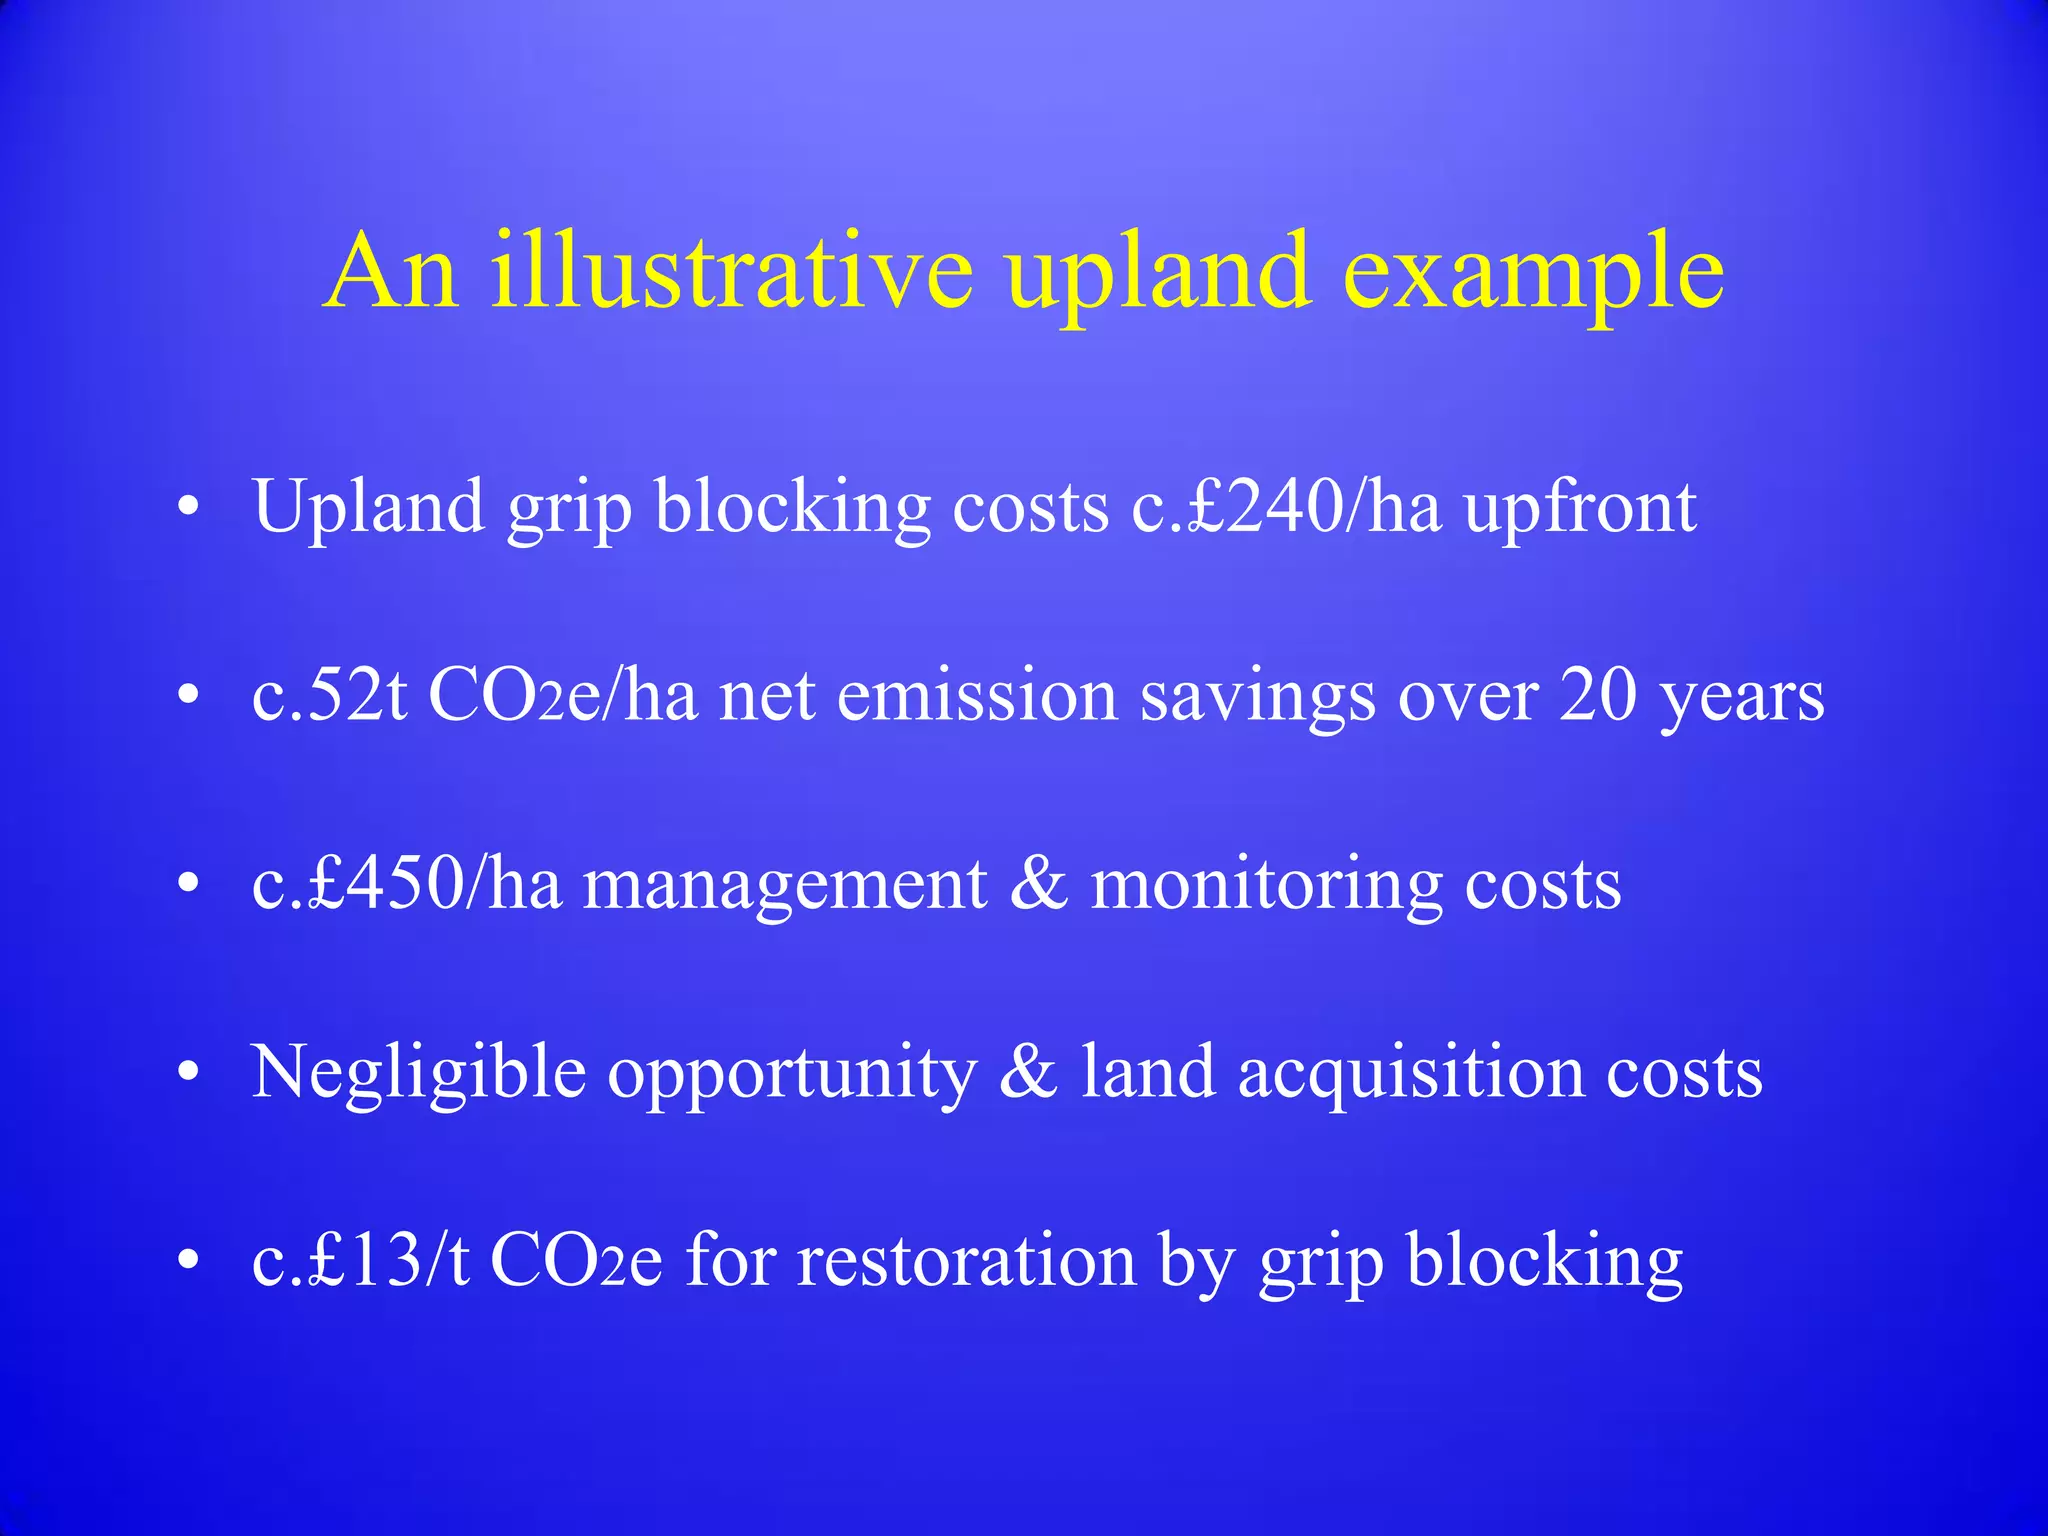
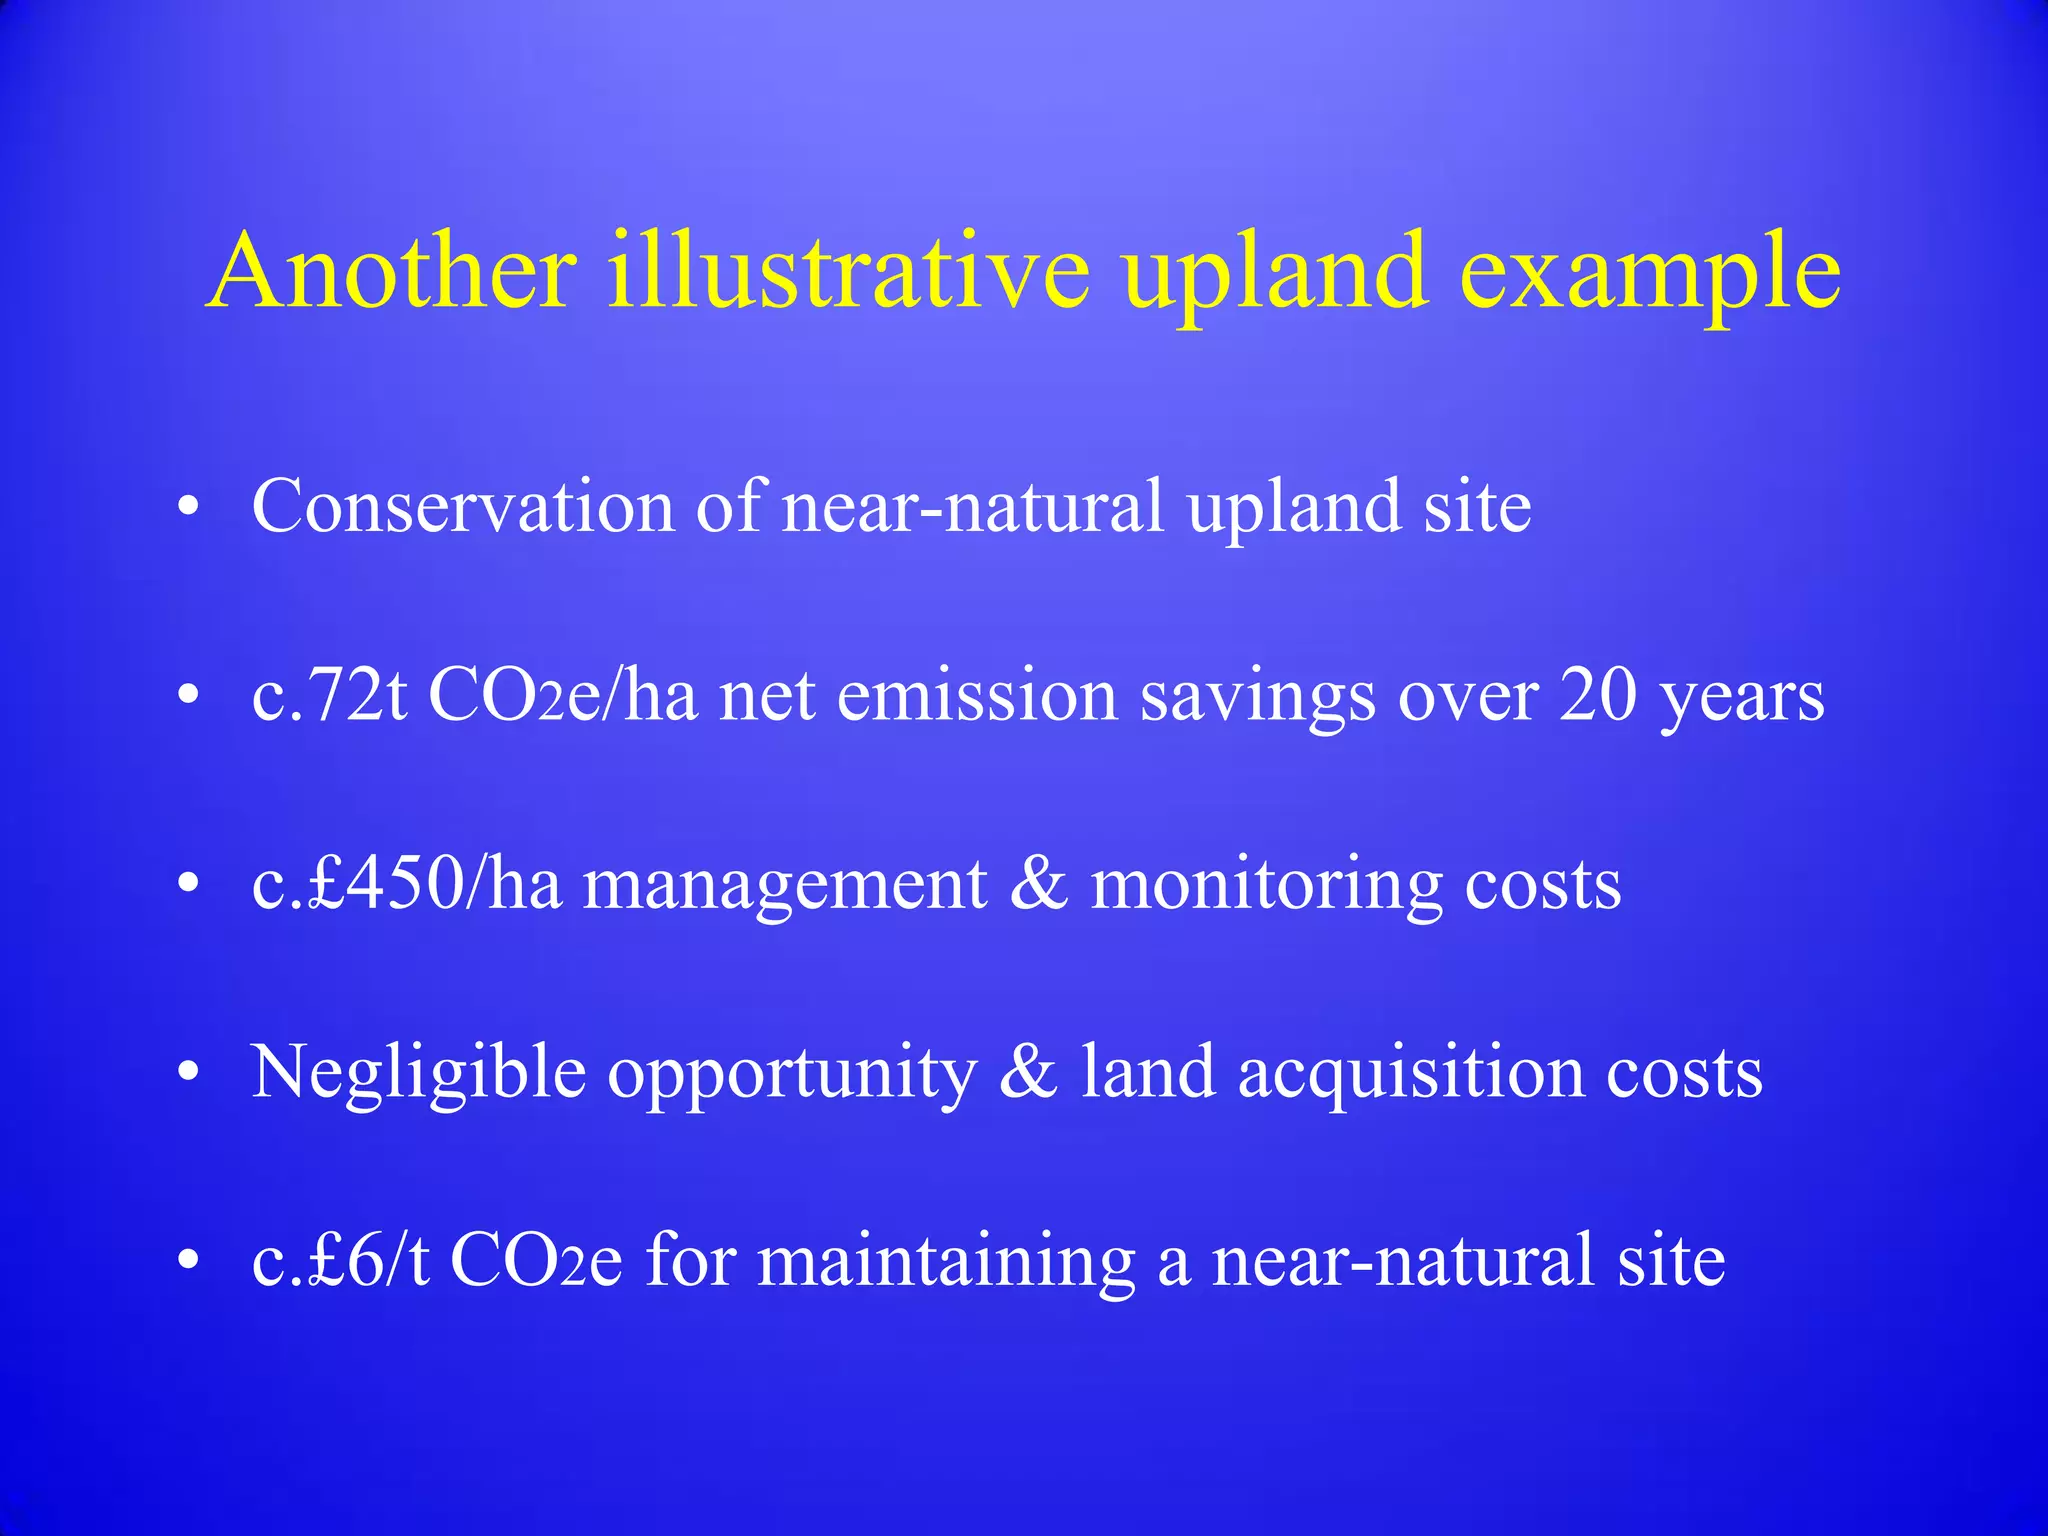
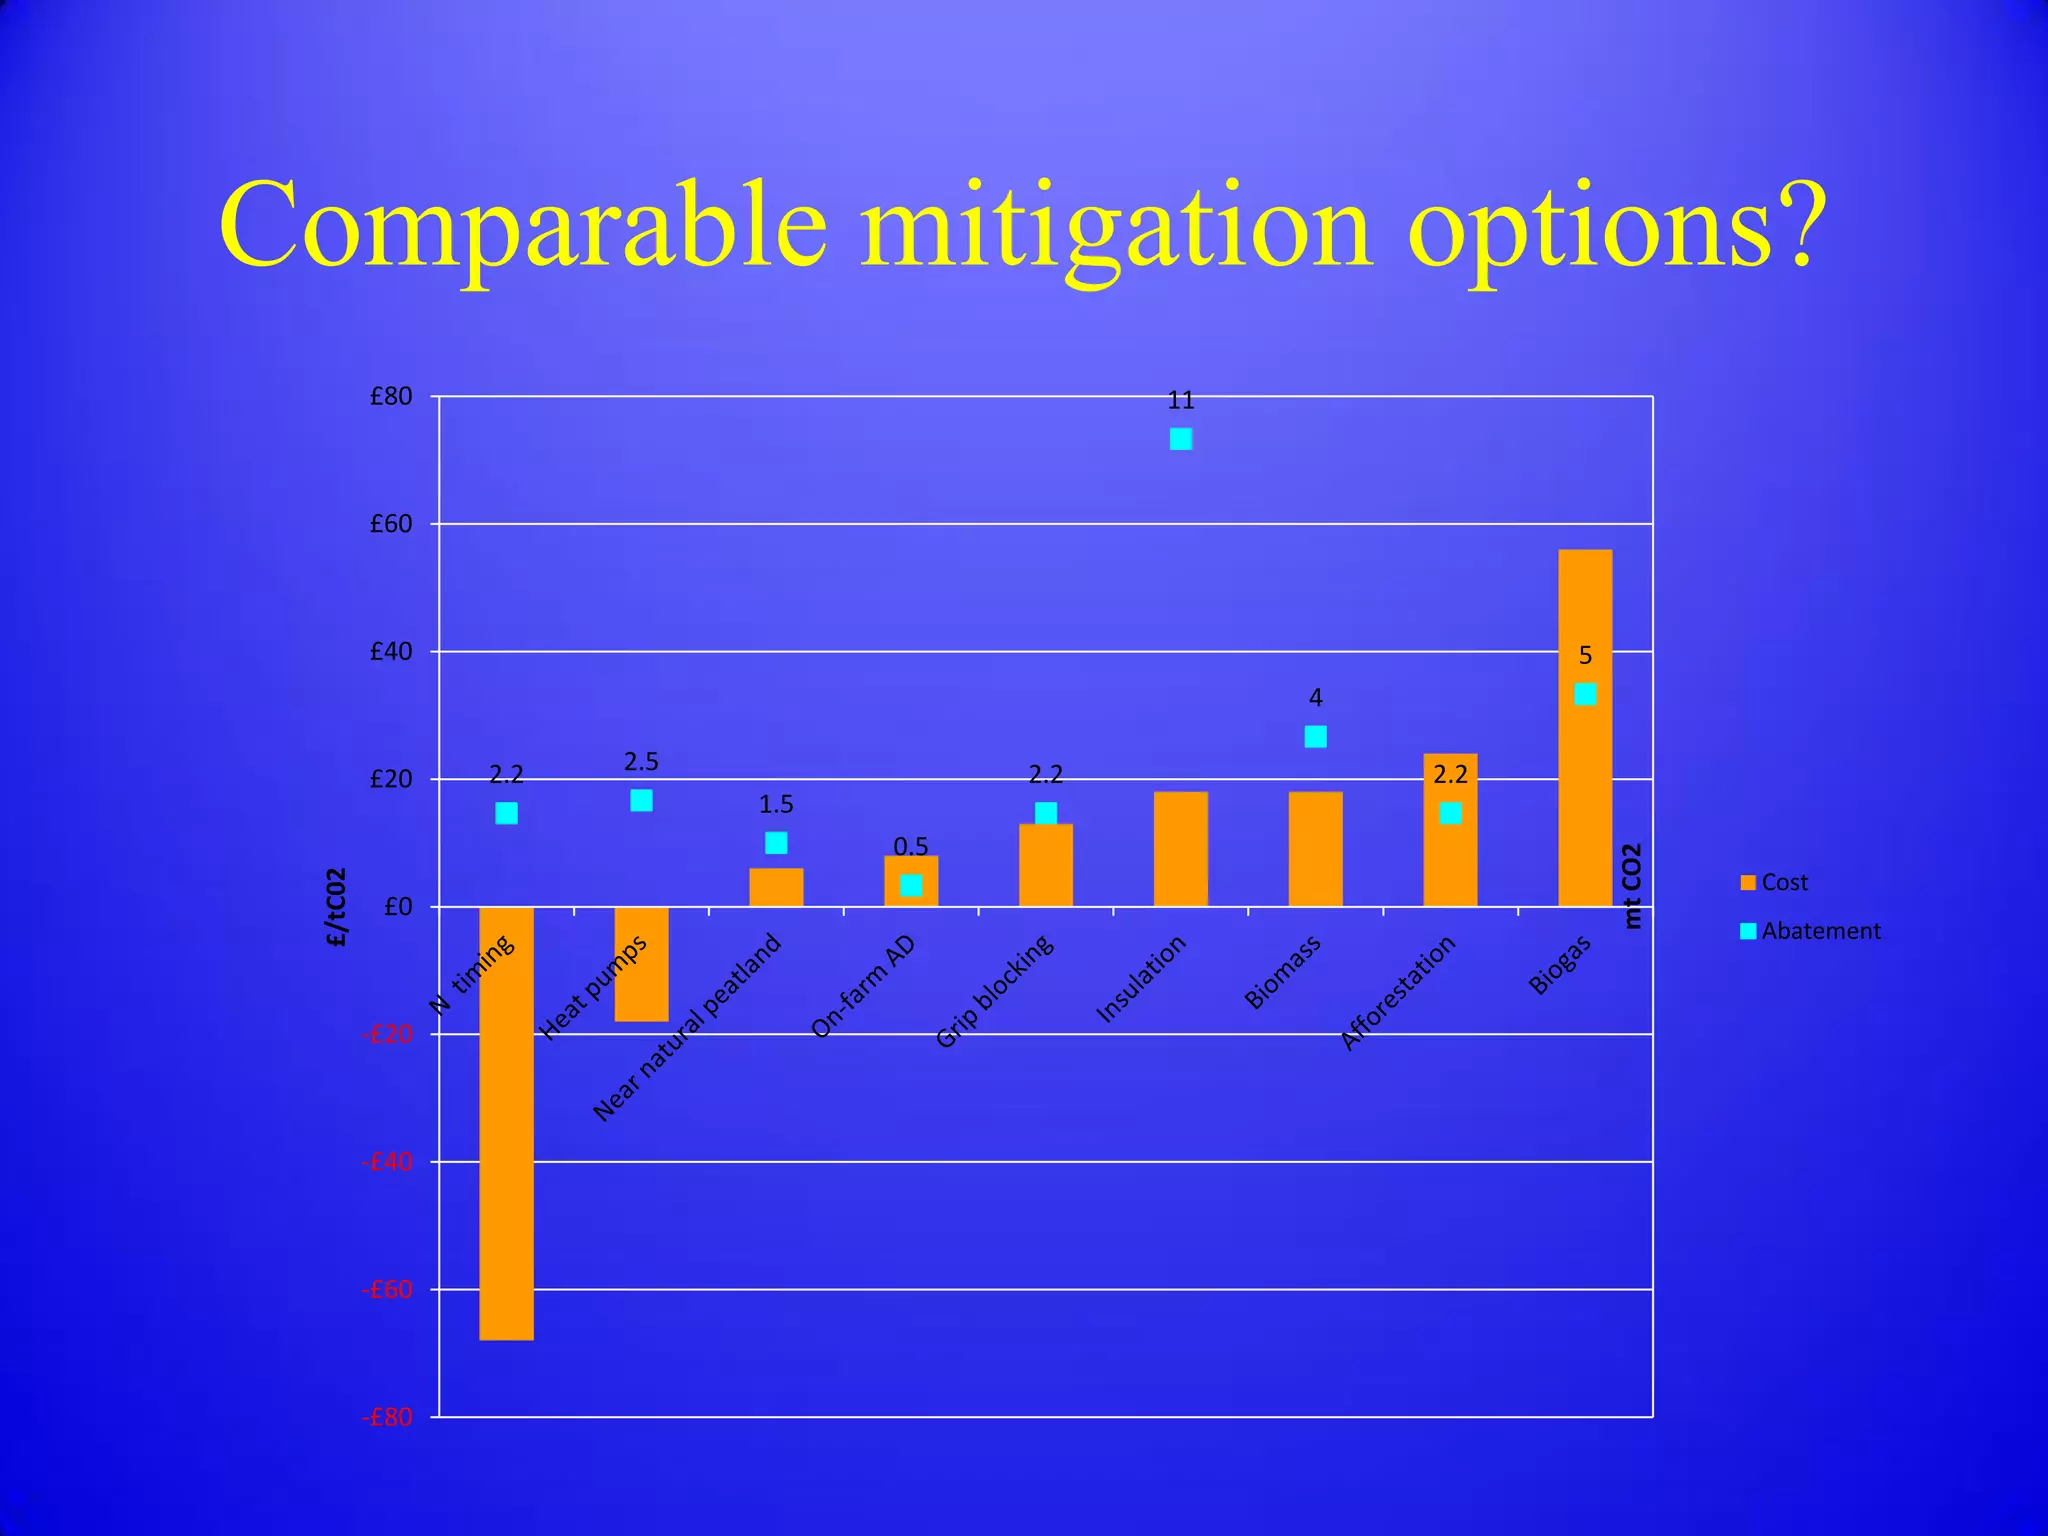
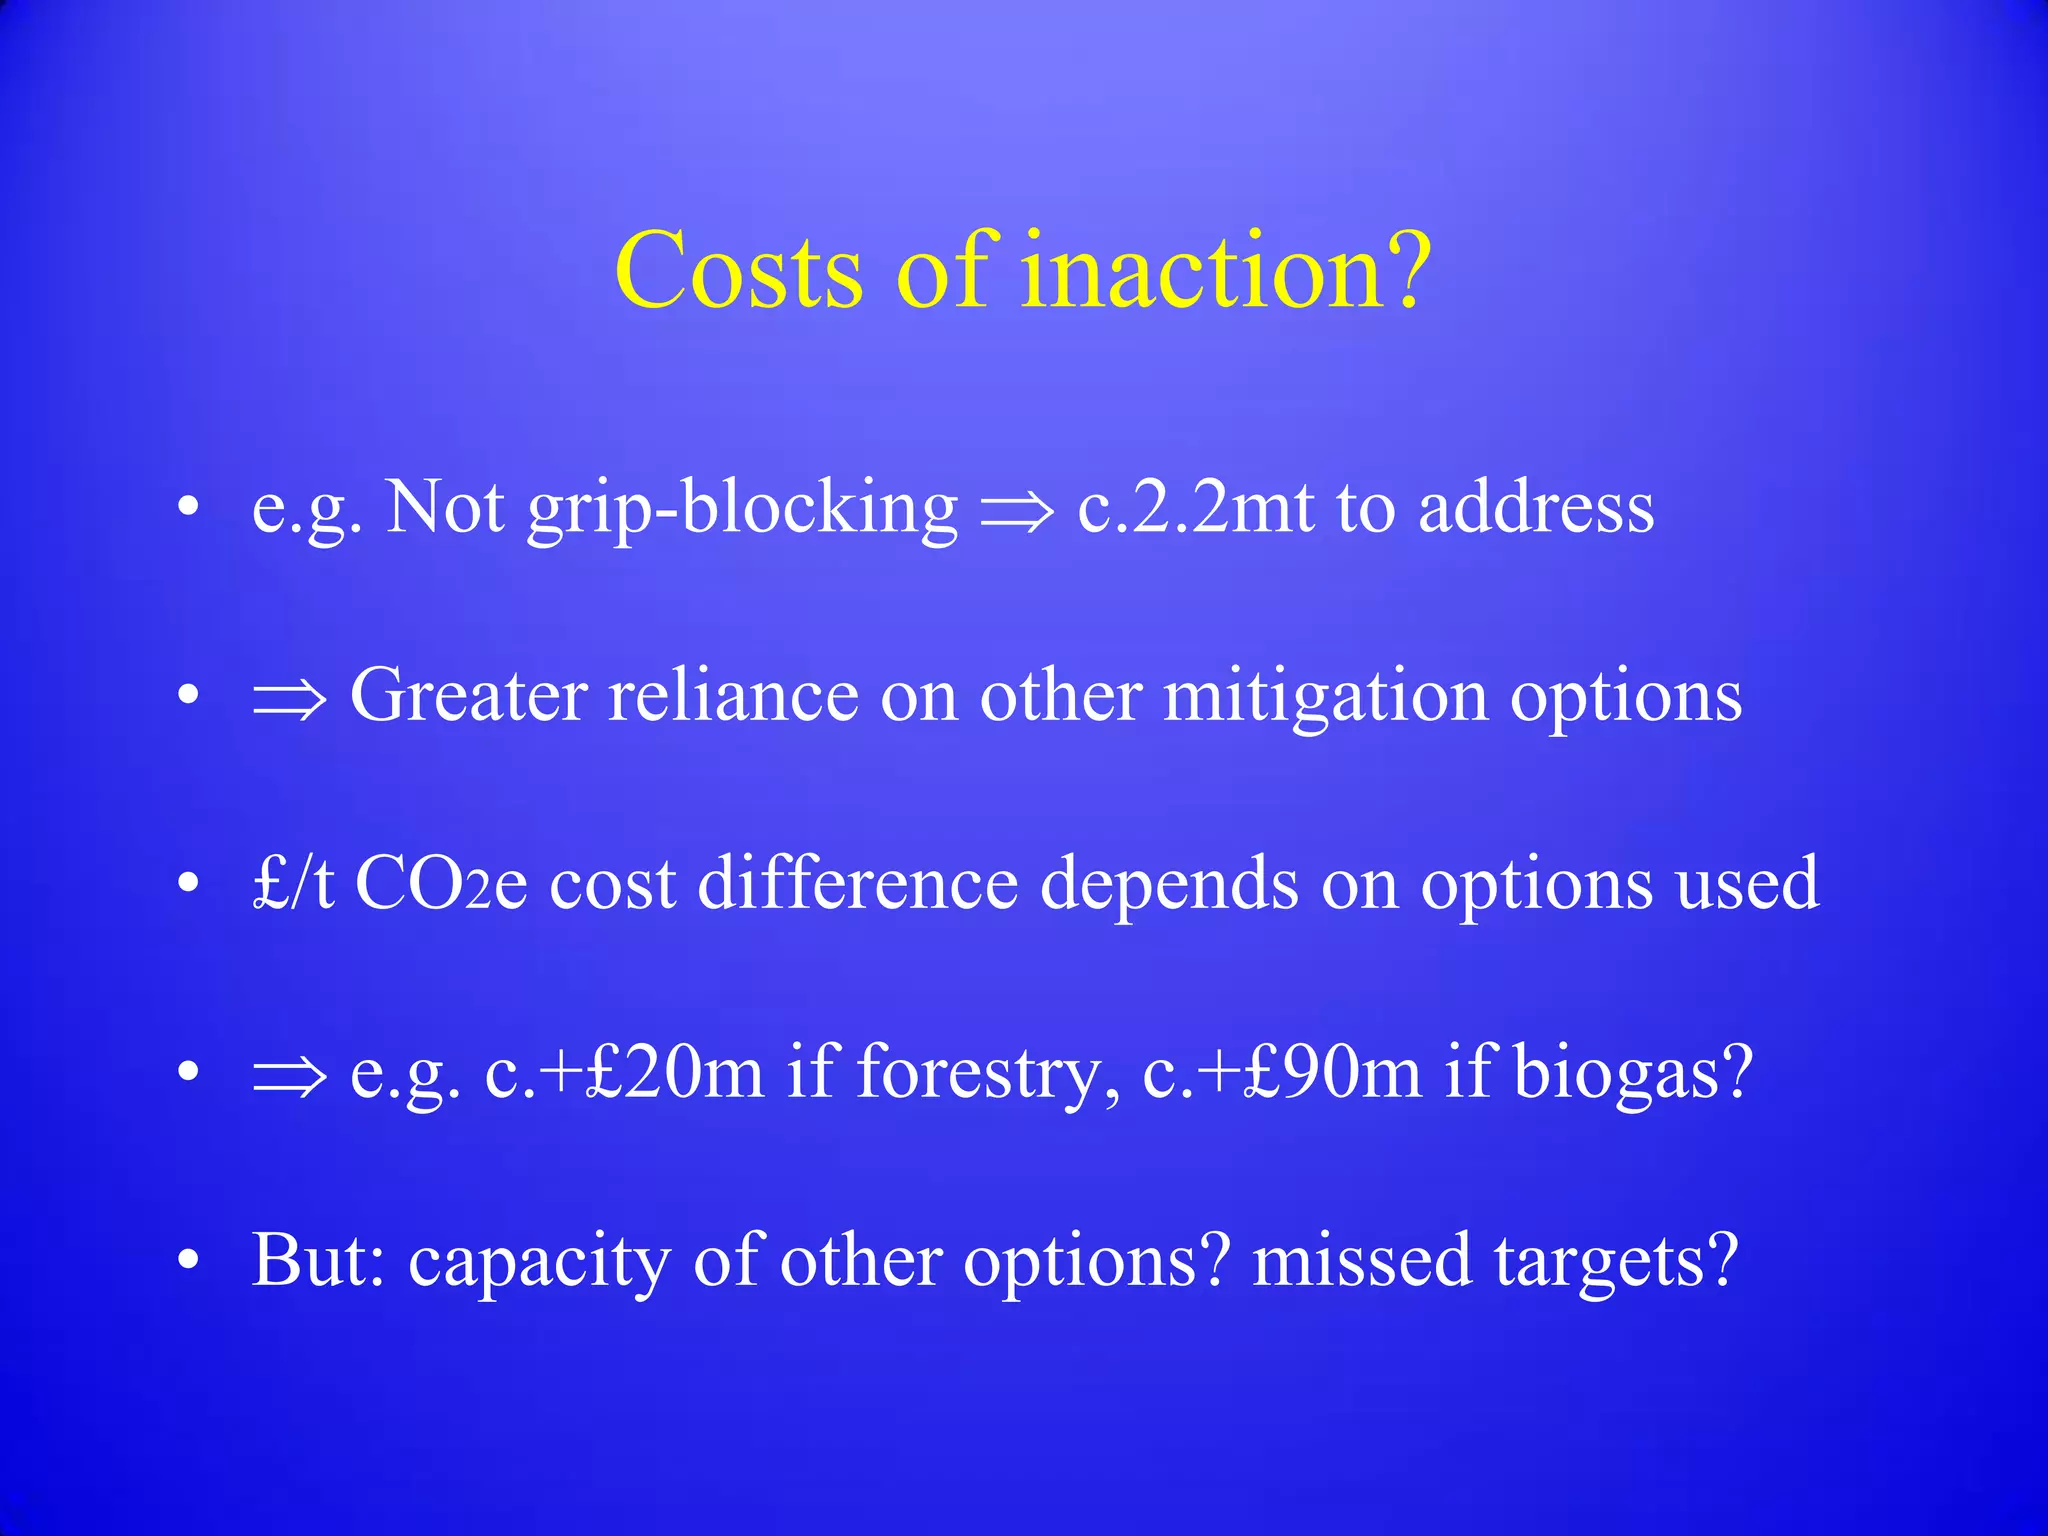
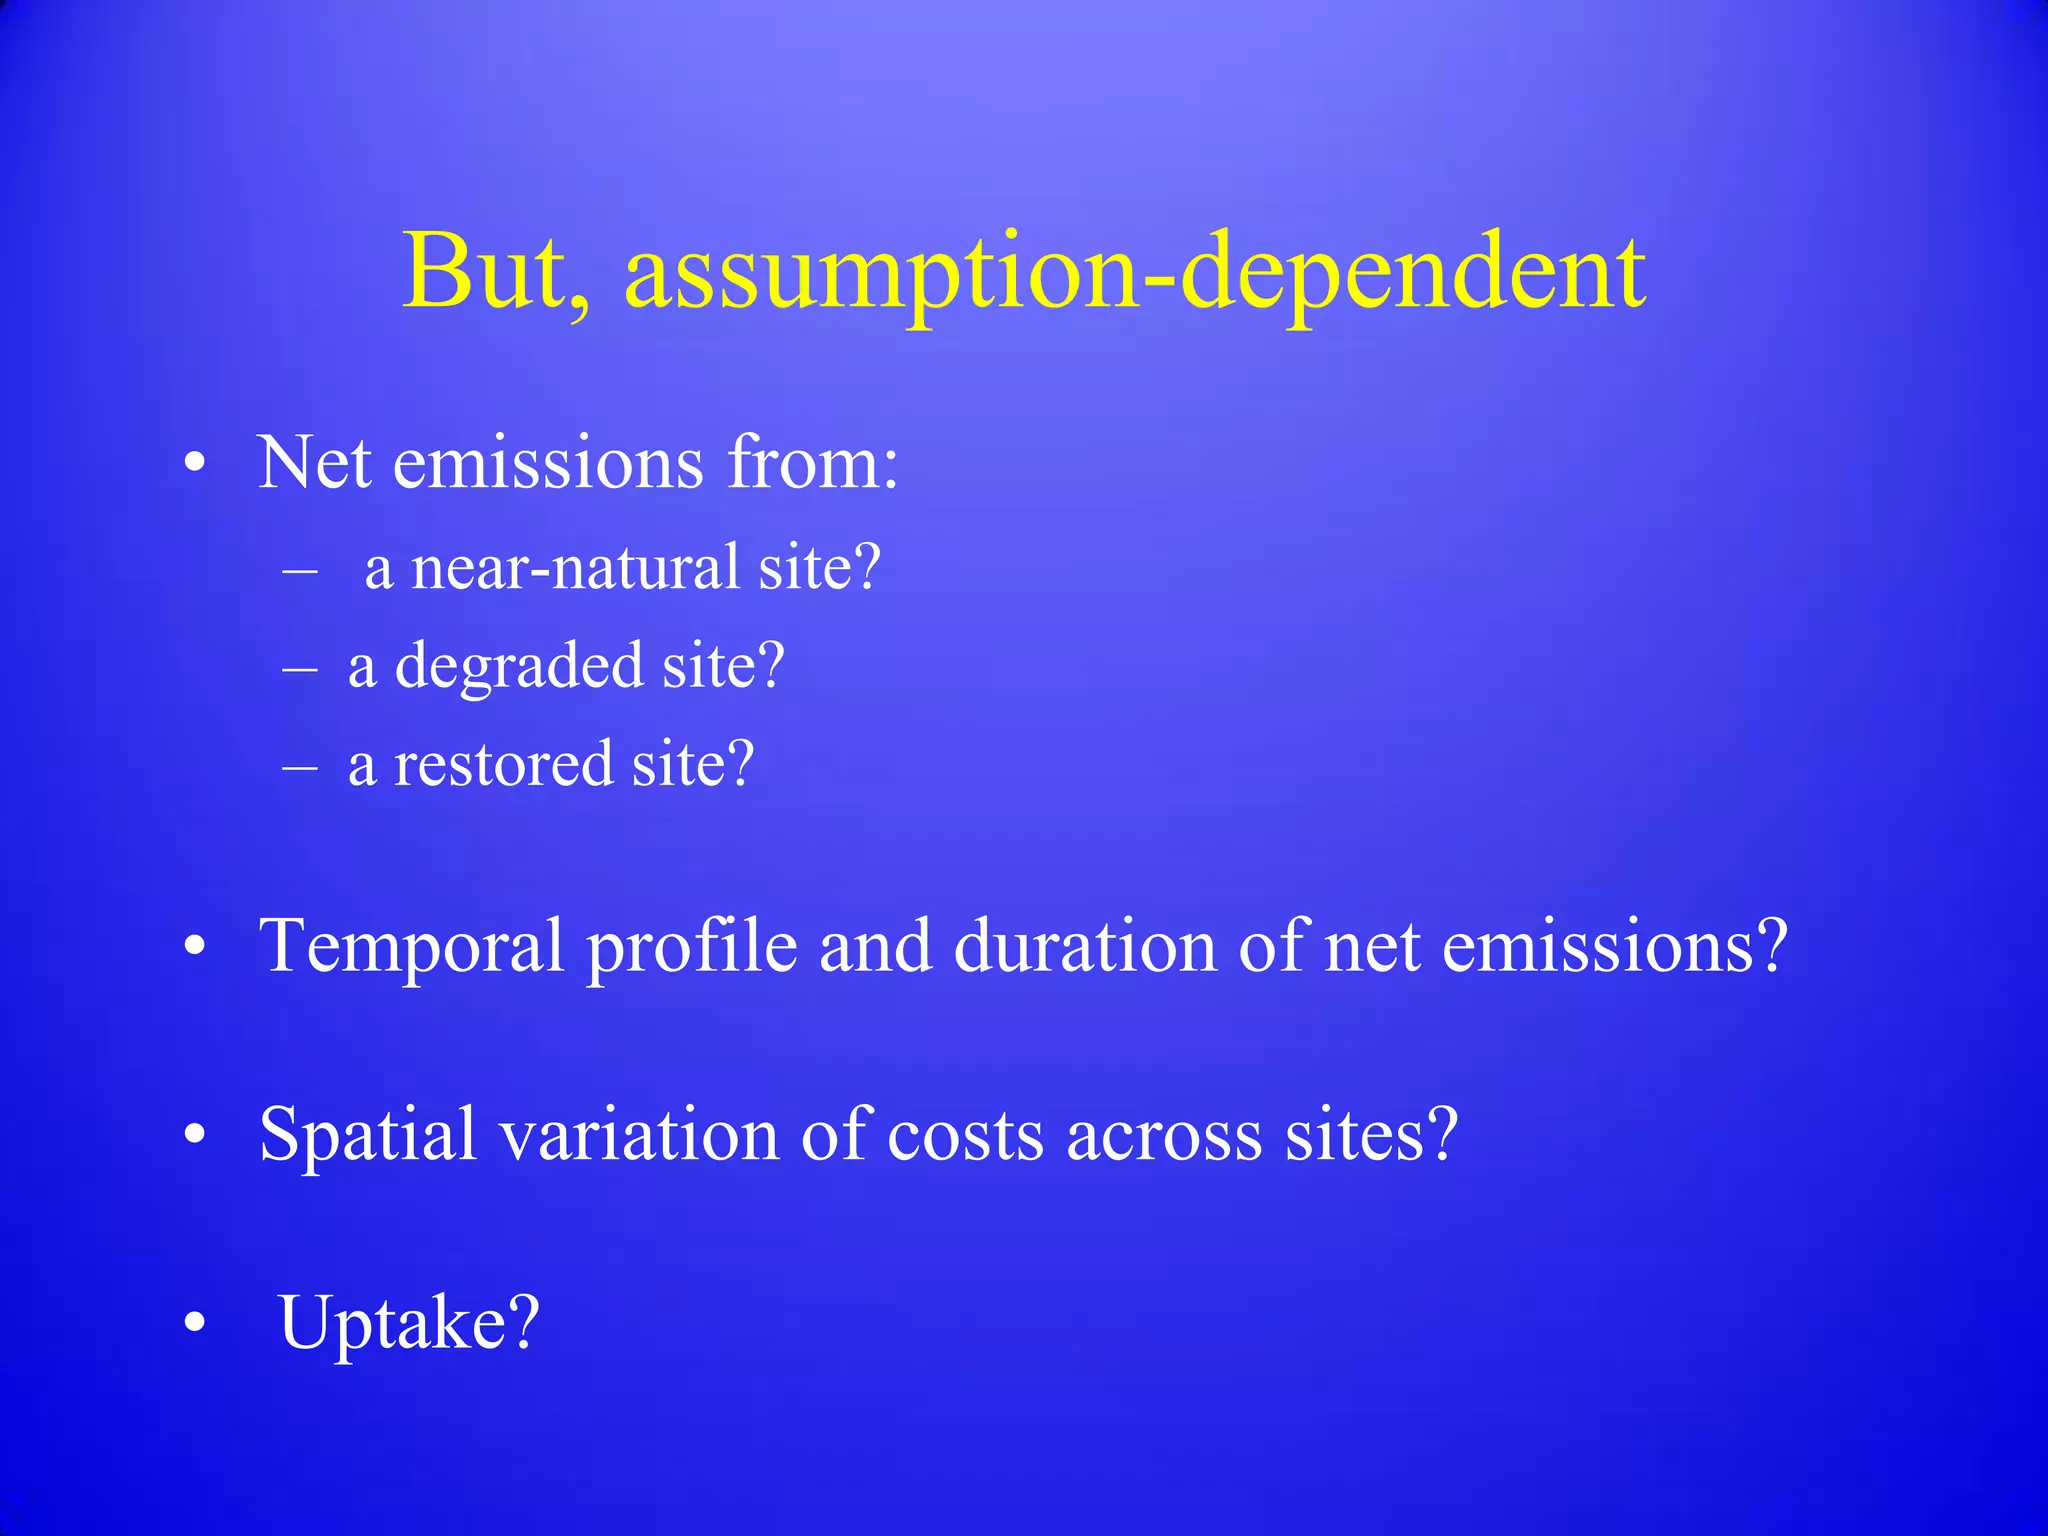
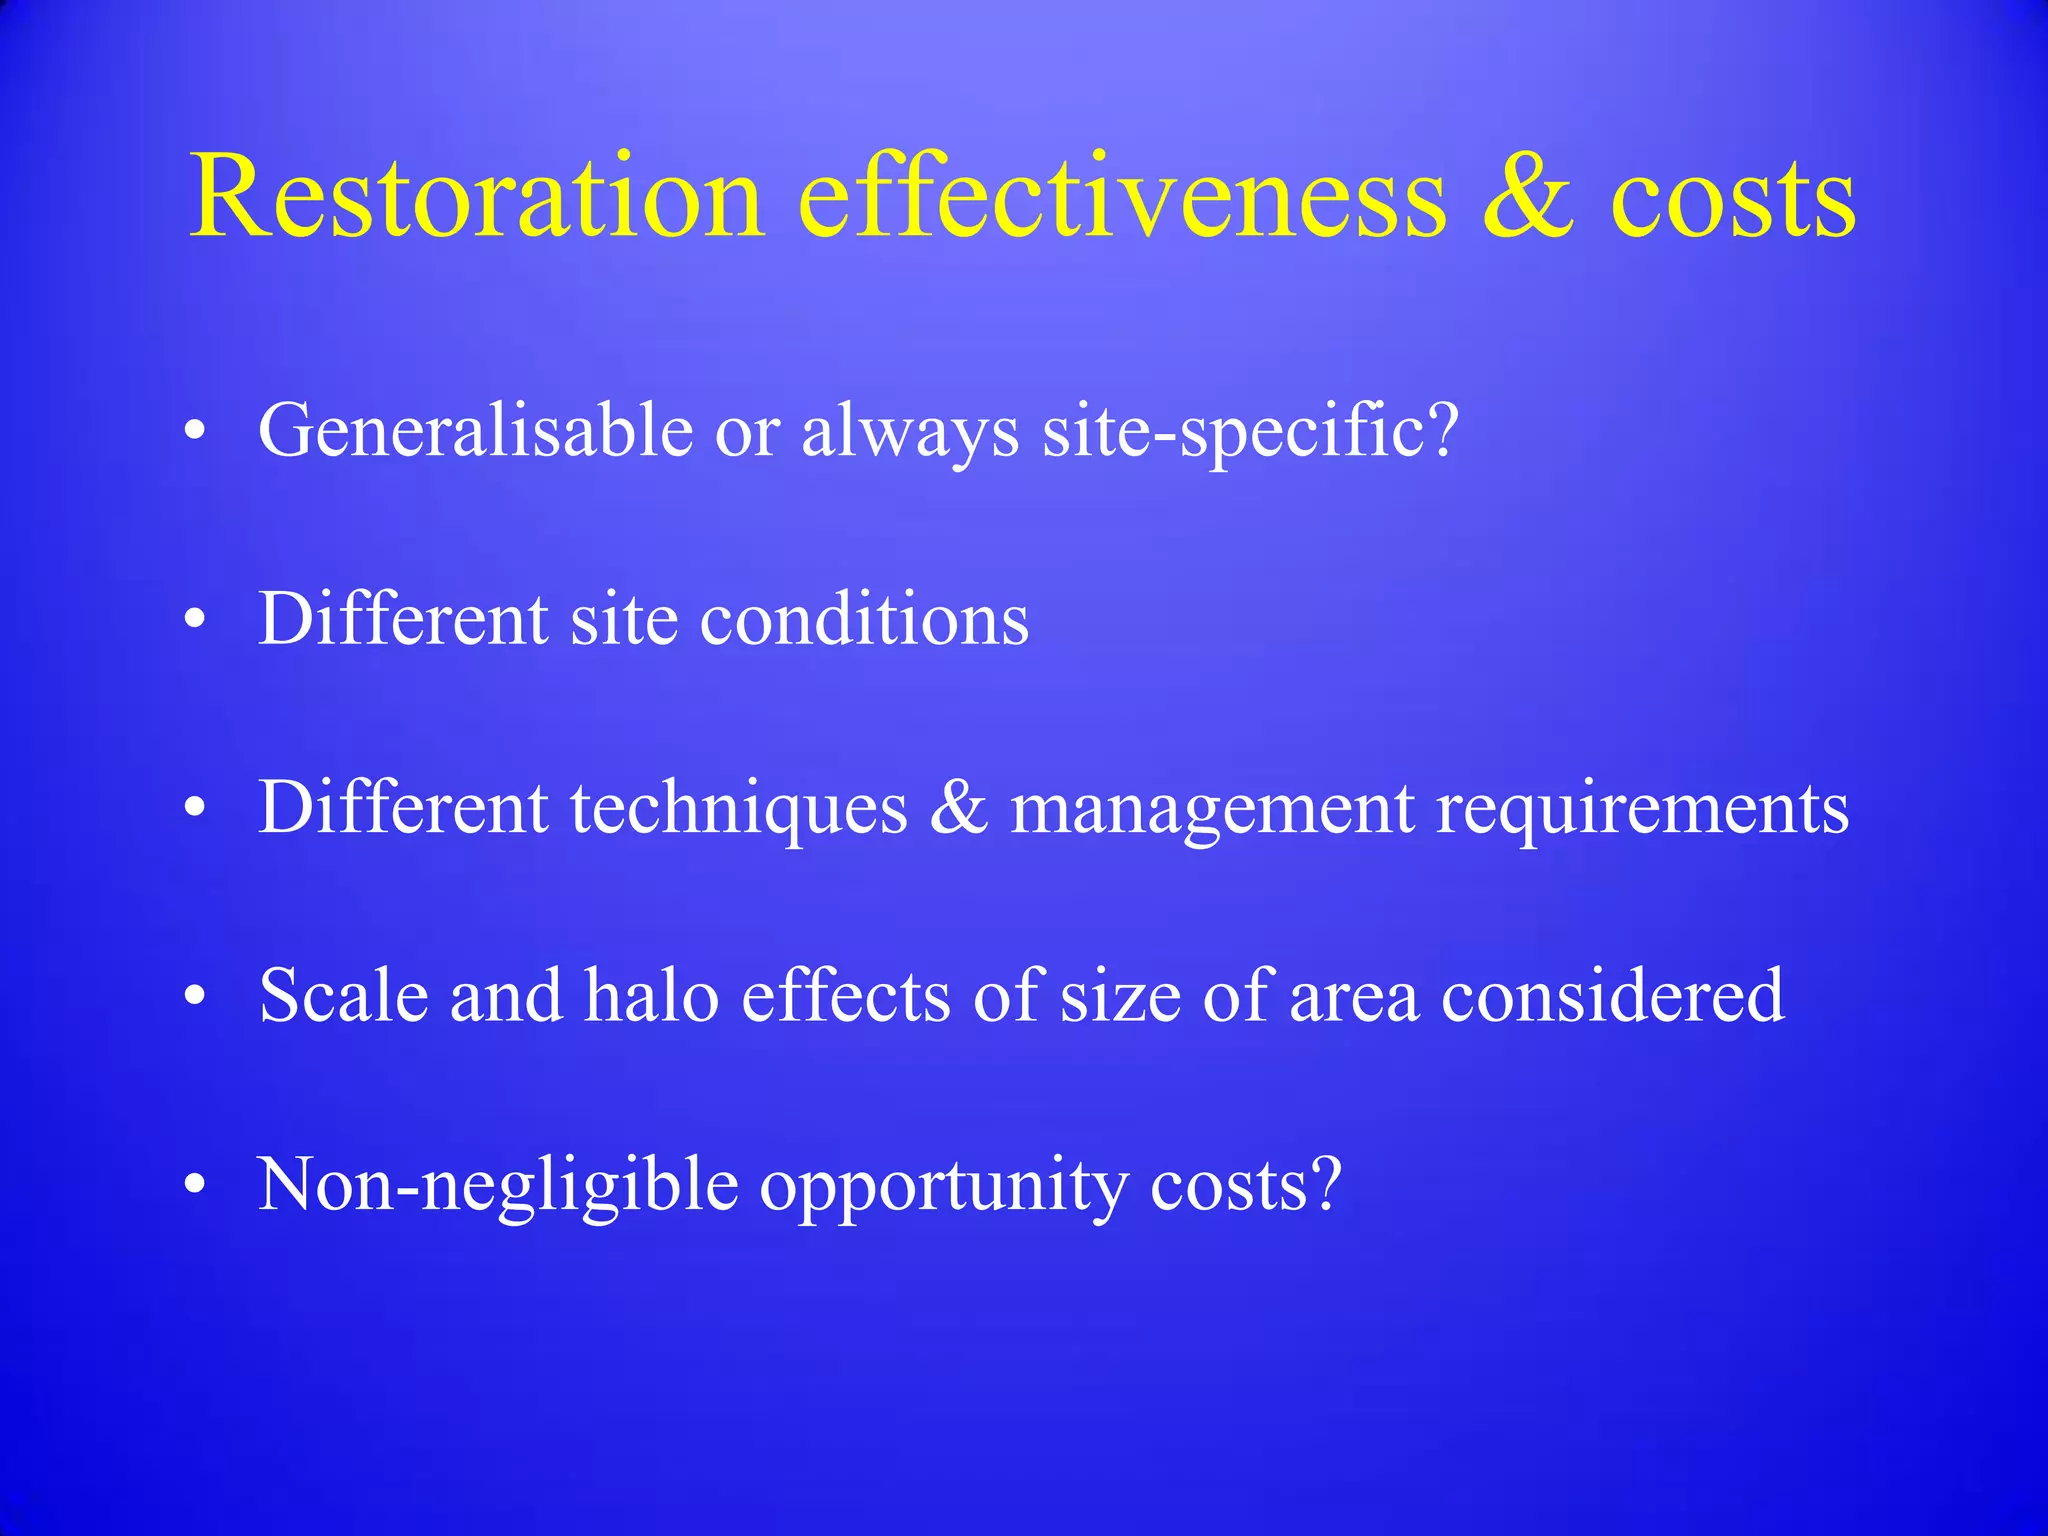
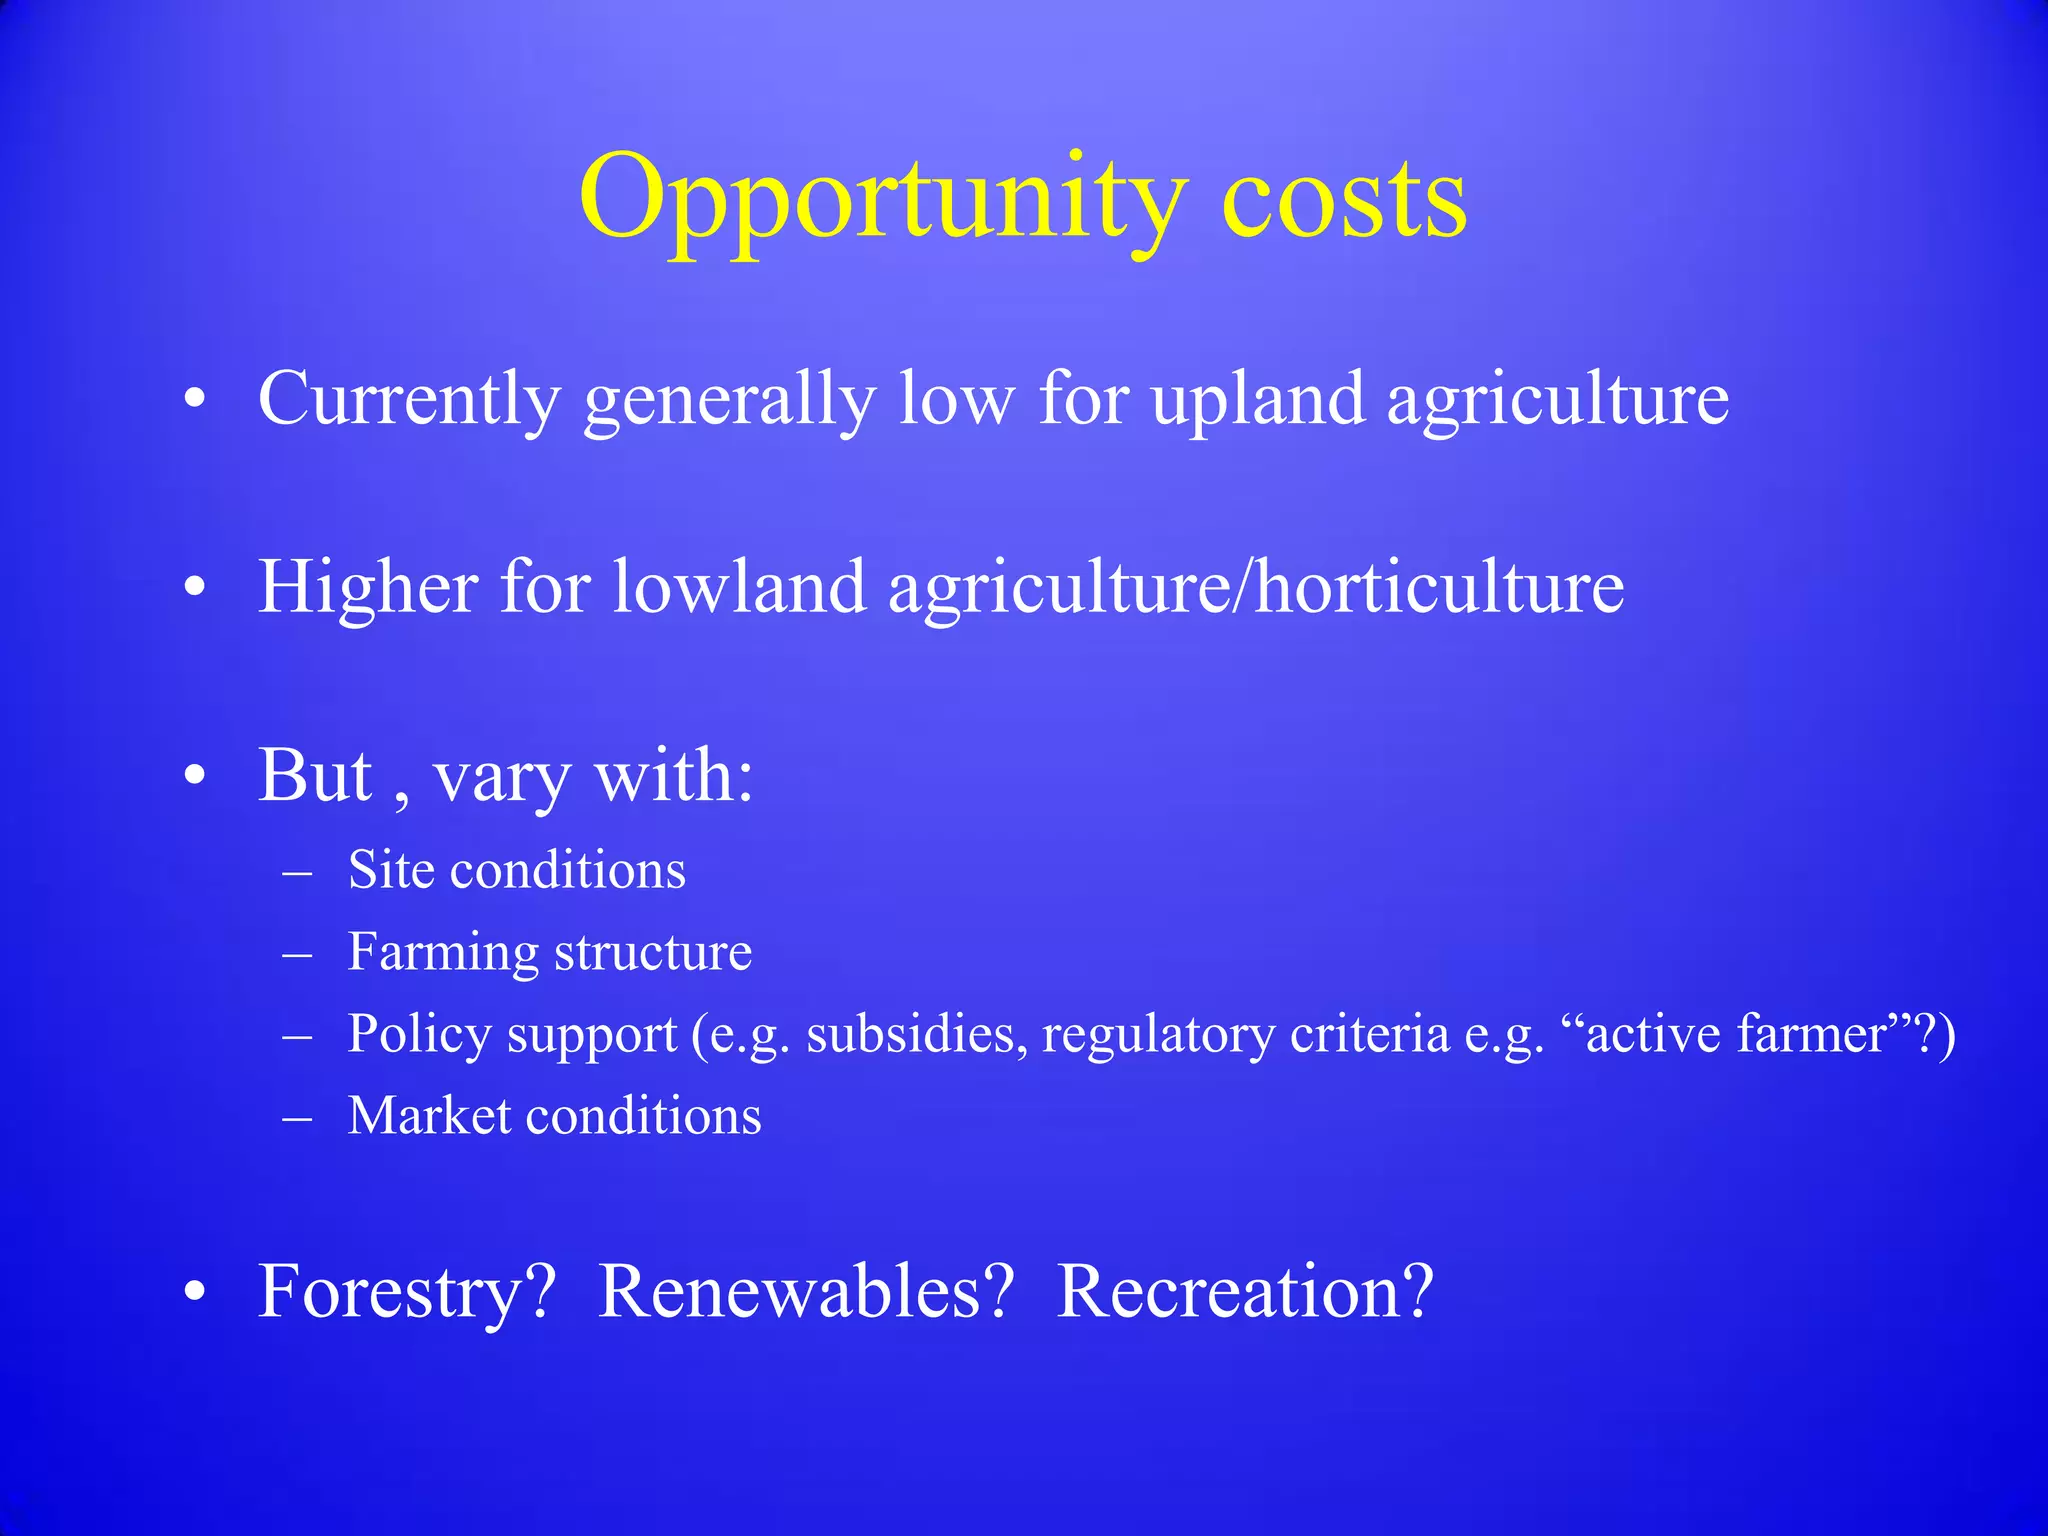
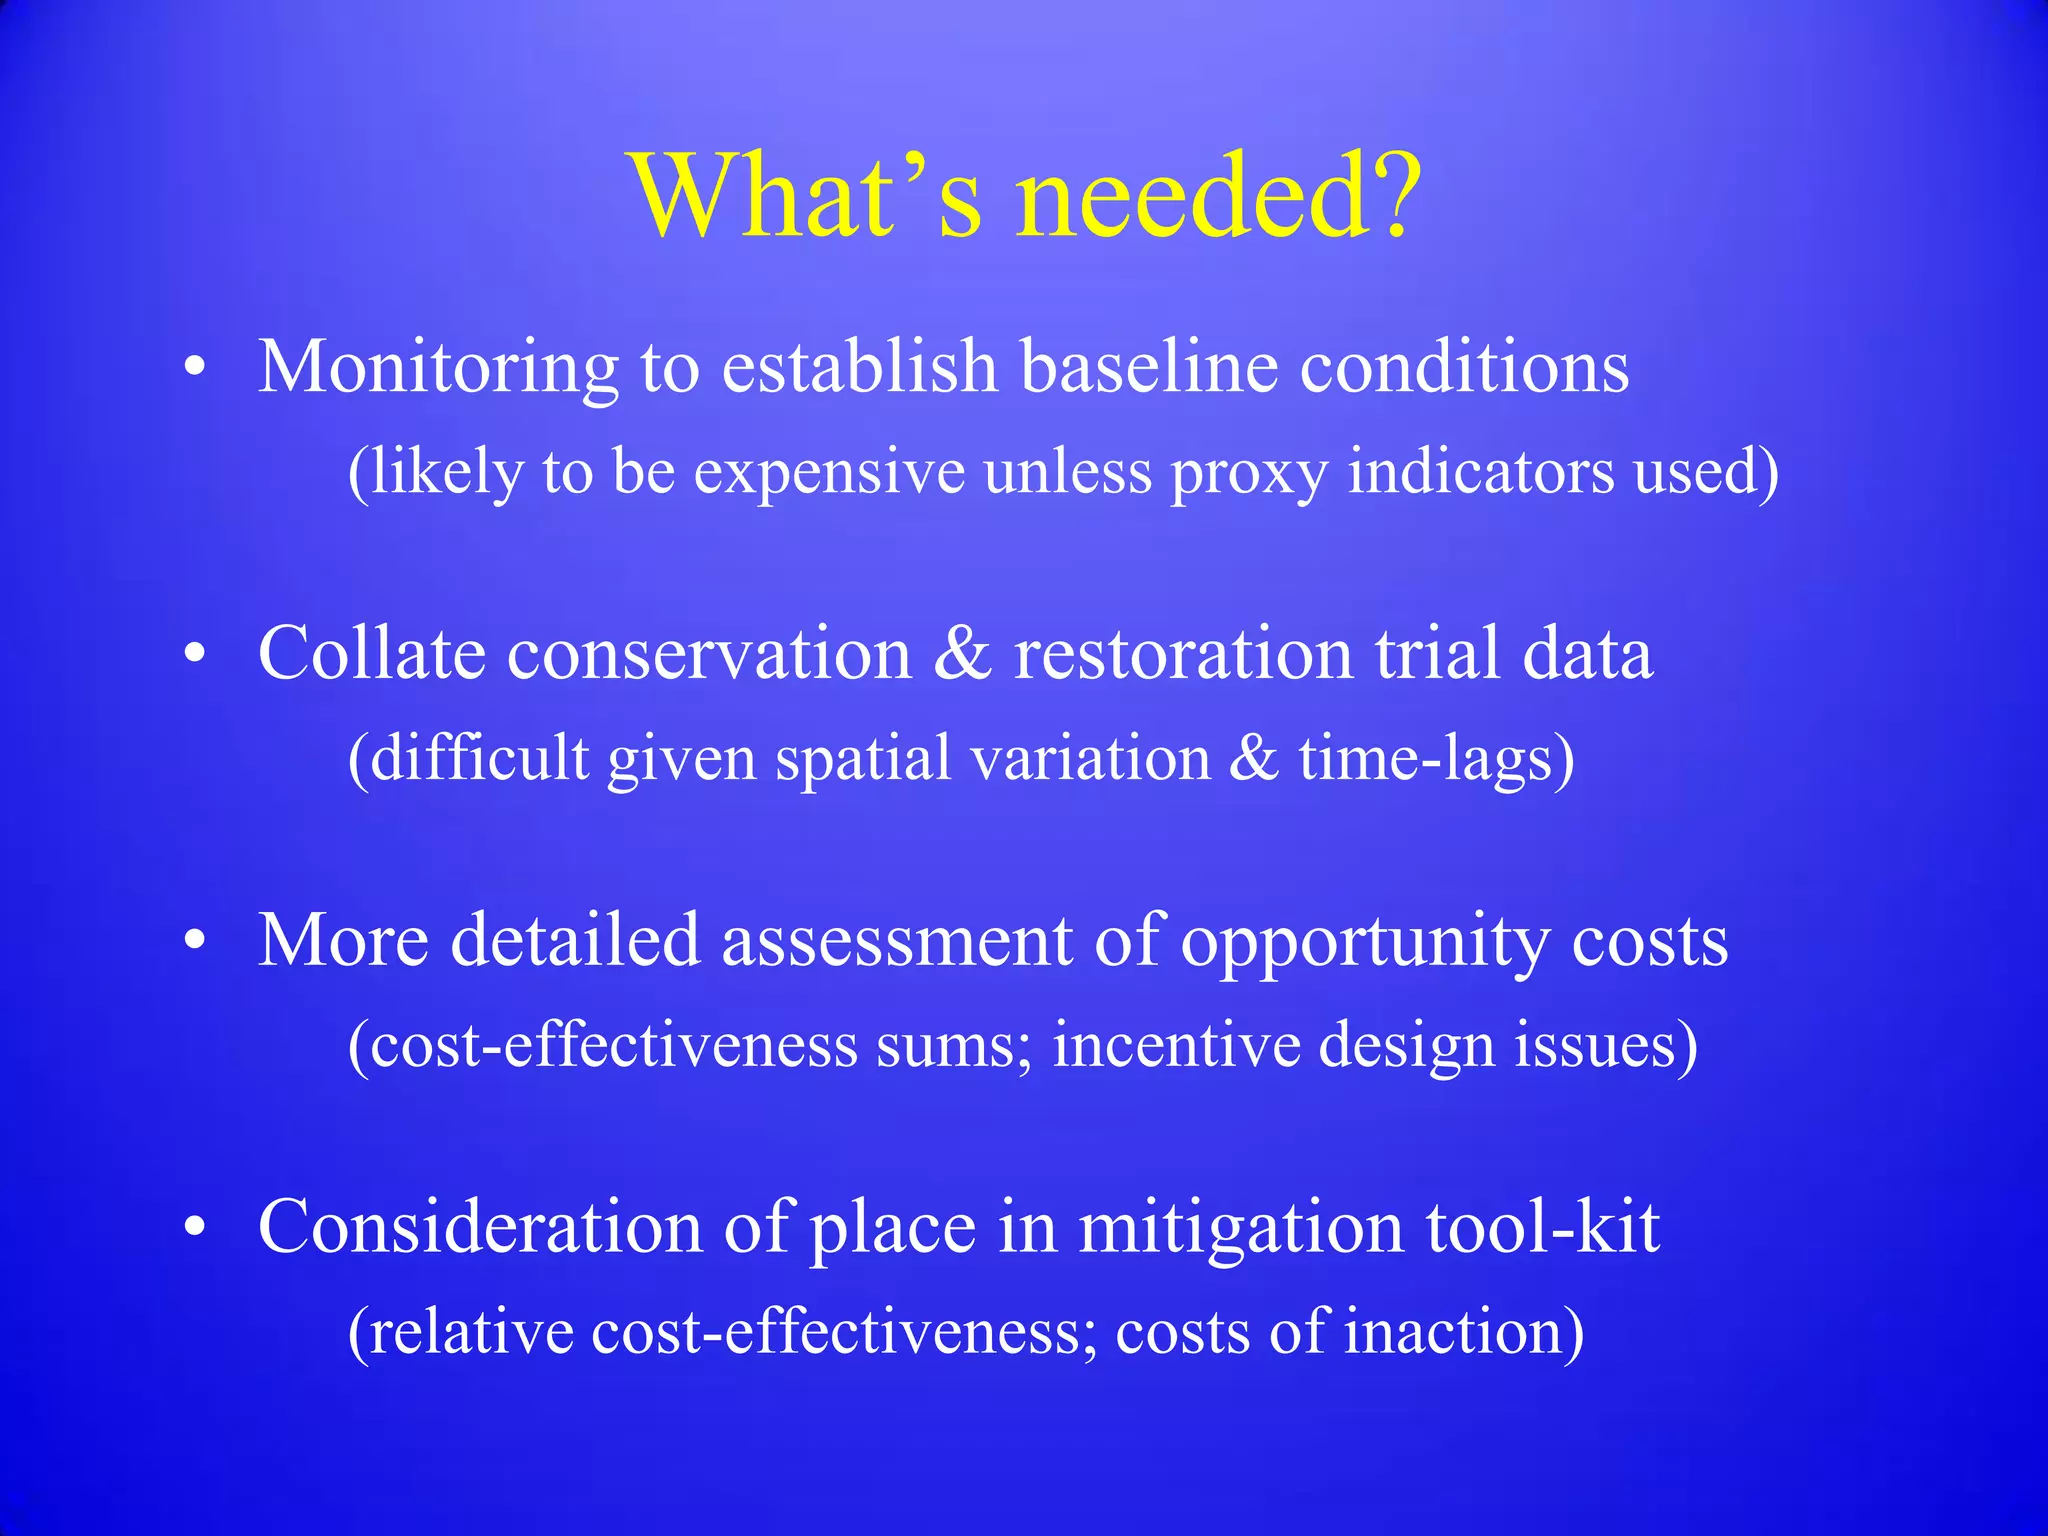
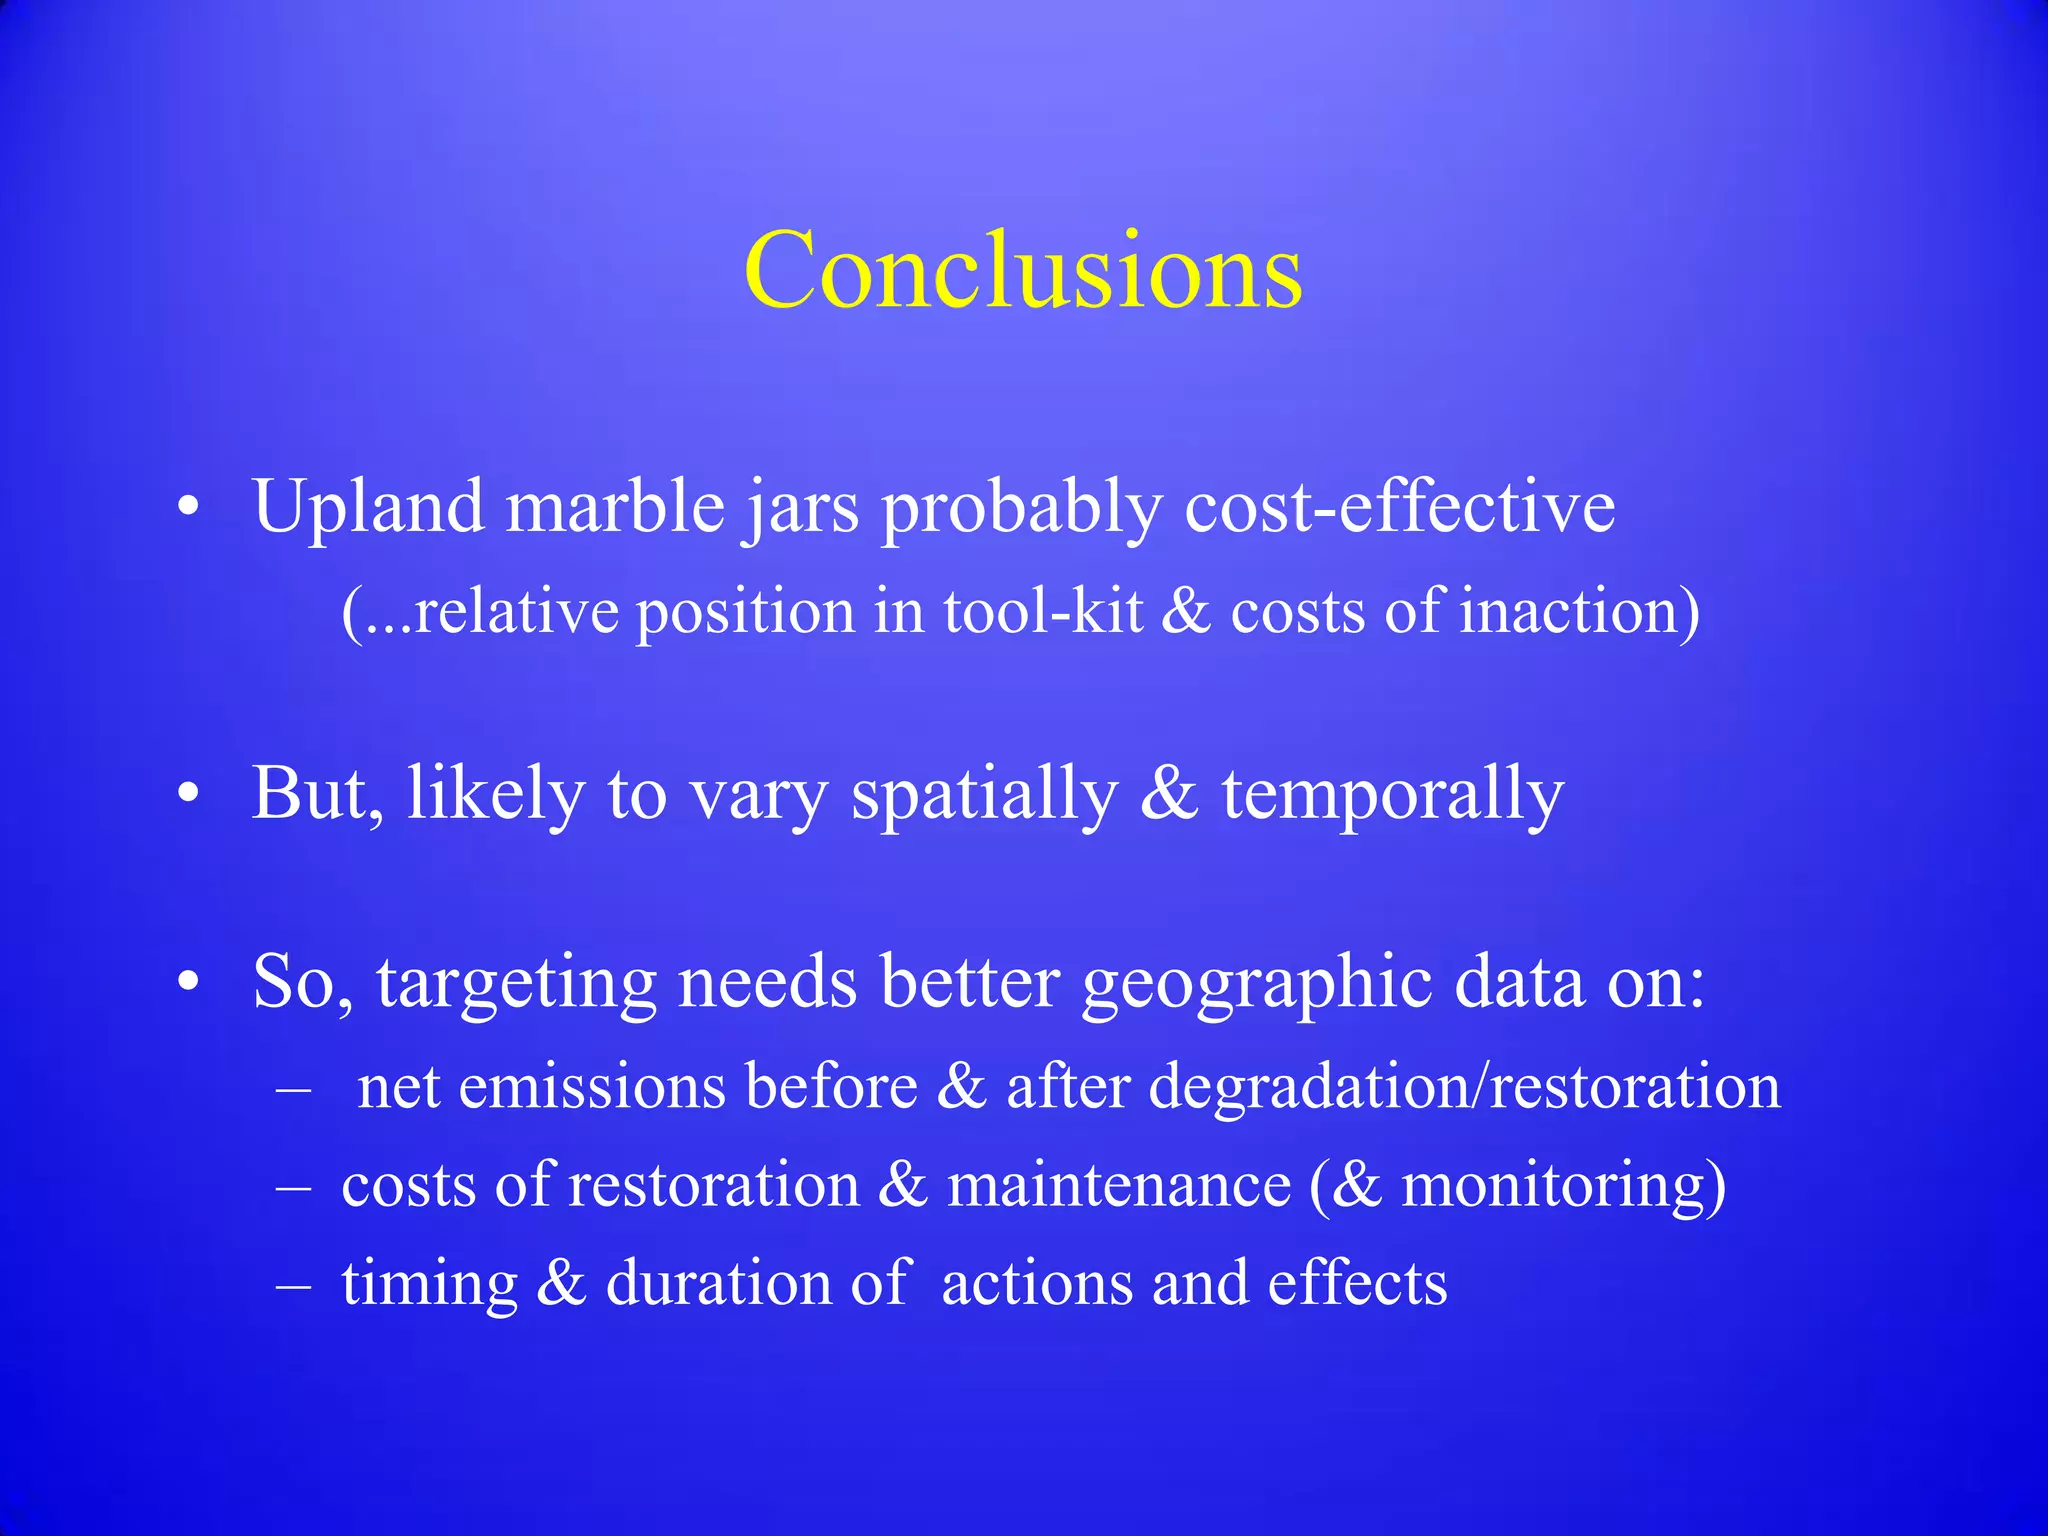

The document discusses the cost effectiveness of peatland management and restoration. It provides some illustrative examples showing the upfront and ongoing costs of restoration techniques like grip blocking in uplands, and compares the costs per ton of carbon dioxide saved to other mitigation options. However, it notes the results are dependent on assumptions and site-specific conditions that require more detailed monitoring and data collection to properly assess overall cost effectiveness relative to other options and the costs of inaction. Proper targeting of restoration efforts needs better geographic data.


![[Vihreä Foorumi 28.2.2013]: Matti Kuittinen: Puu vähähiilisessä rakentamisessa](https://cdn.slidesharecdn.com/ss_thumbnails/mattikuittinenjulkinen-130306015218-phpapp01-thumbnail.jpg?width=640&height=640&fit=bounds)


