Download as PDF, PPTX


![A/B testing
© 2020 ThoughtWorks
Control [A]
Test [B]](https://image.slidesharecdn.com/whenindoubtgolive-xconf20-200706065838/75/When-in-doubt-go-live-32-2048.jpg)


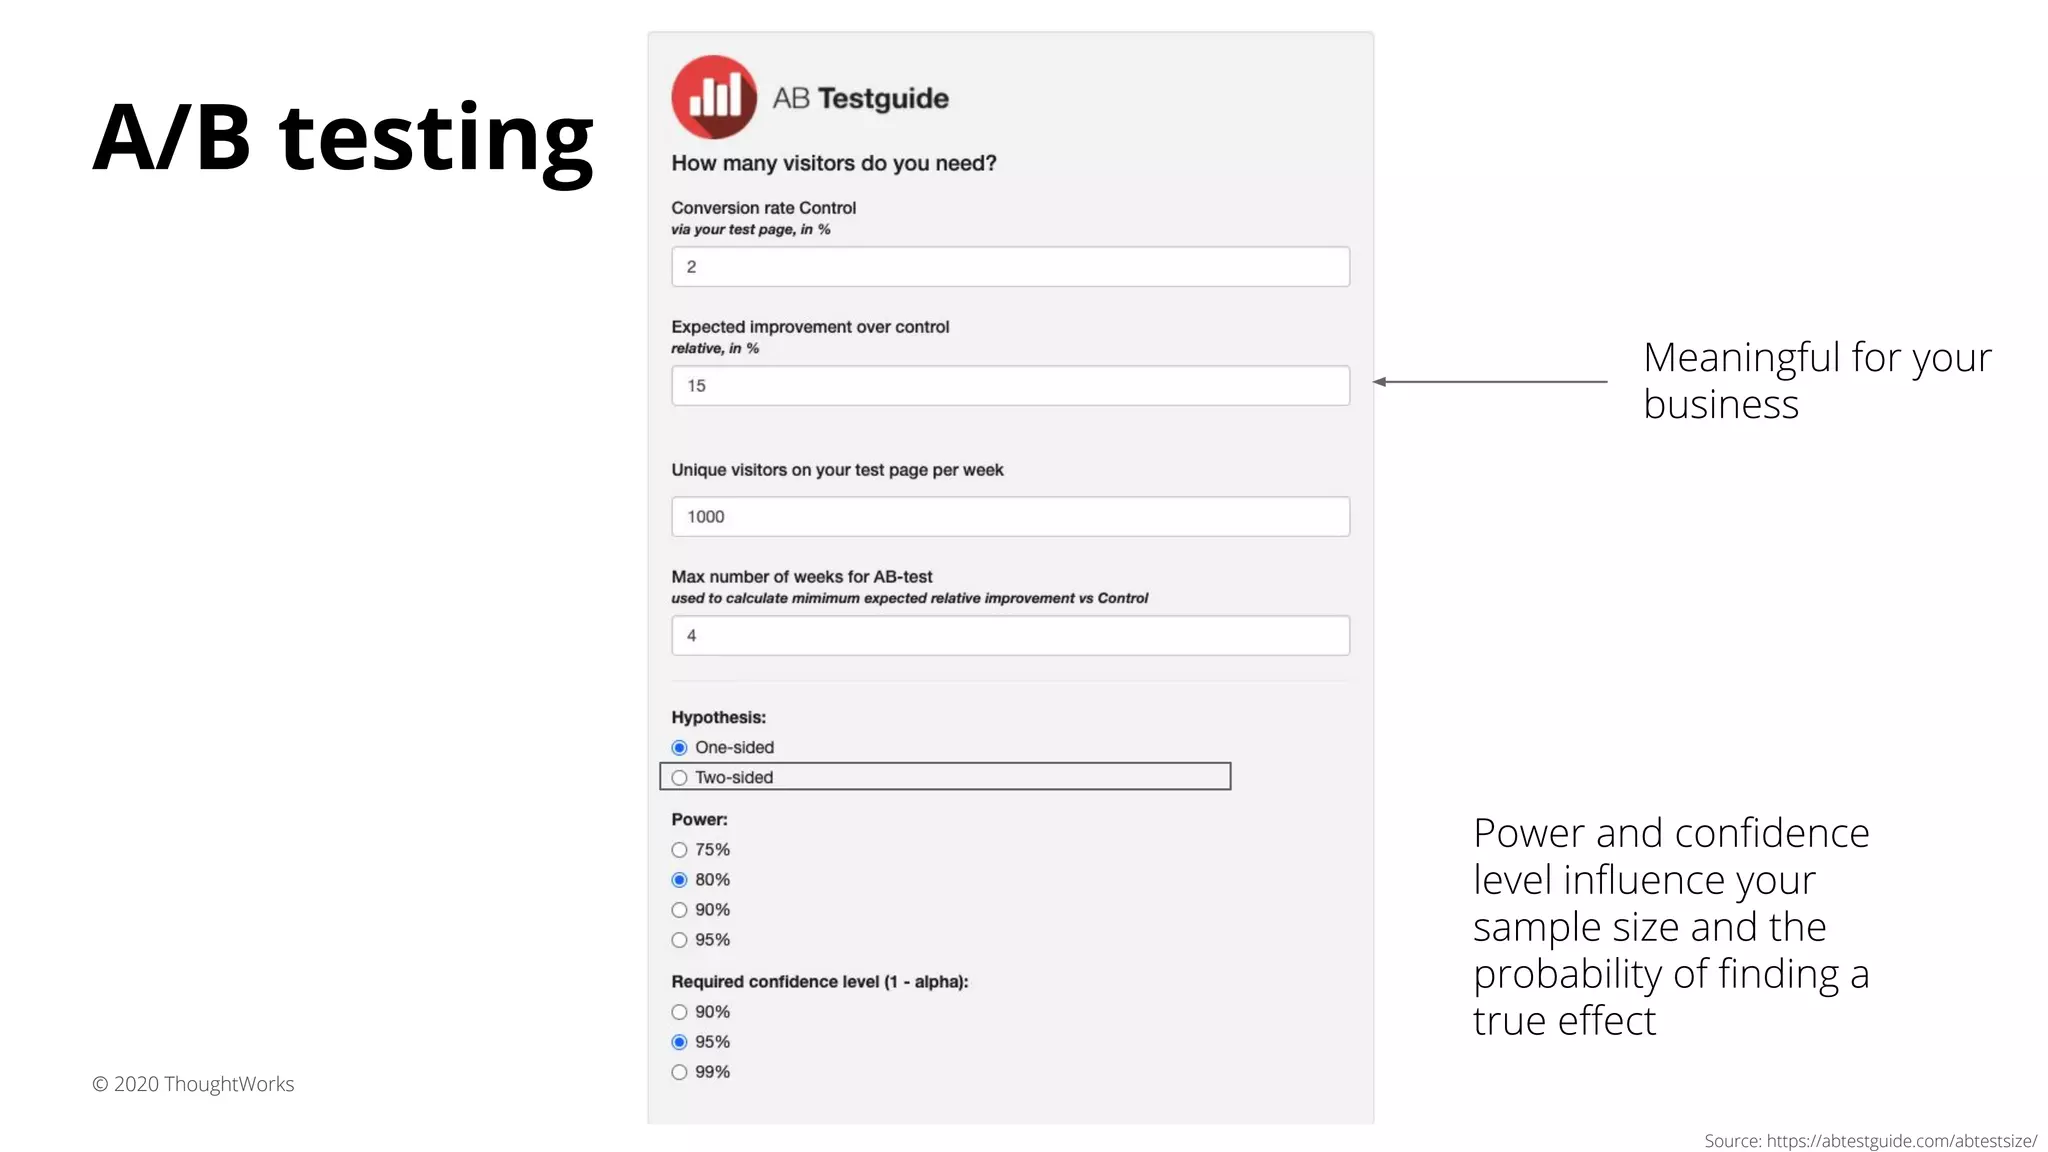
![A/B testing
© 2020 ThoughtWorks
Source: https://abtestguide.com/abtestsize/
Metrics
we know We decide from
previous data or
knowledge about
this variable
[effect size]](https://image.slidesharecdn.com/whenindoubtgolive-xconf20-200706065838/75/When-in-doubt-go-live-37-2048.jpg)
![A/B testing
© 2020 ThoughtWorks
Source: https://abtestguide.com/abtestsize/
Metrics
we know
We decide from
previous data or
knowledge about
this variable
[effect size]
Dependent on the
variable and what we
are looking for
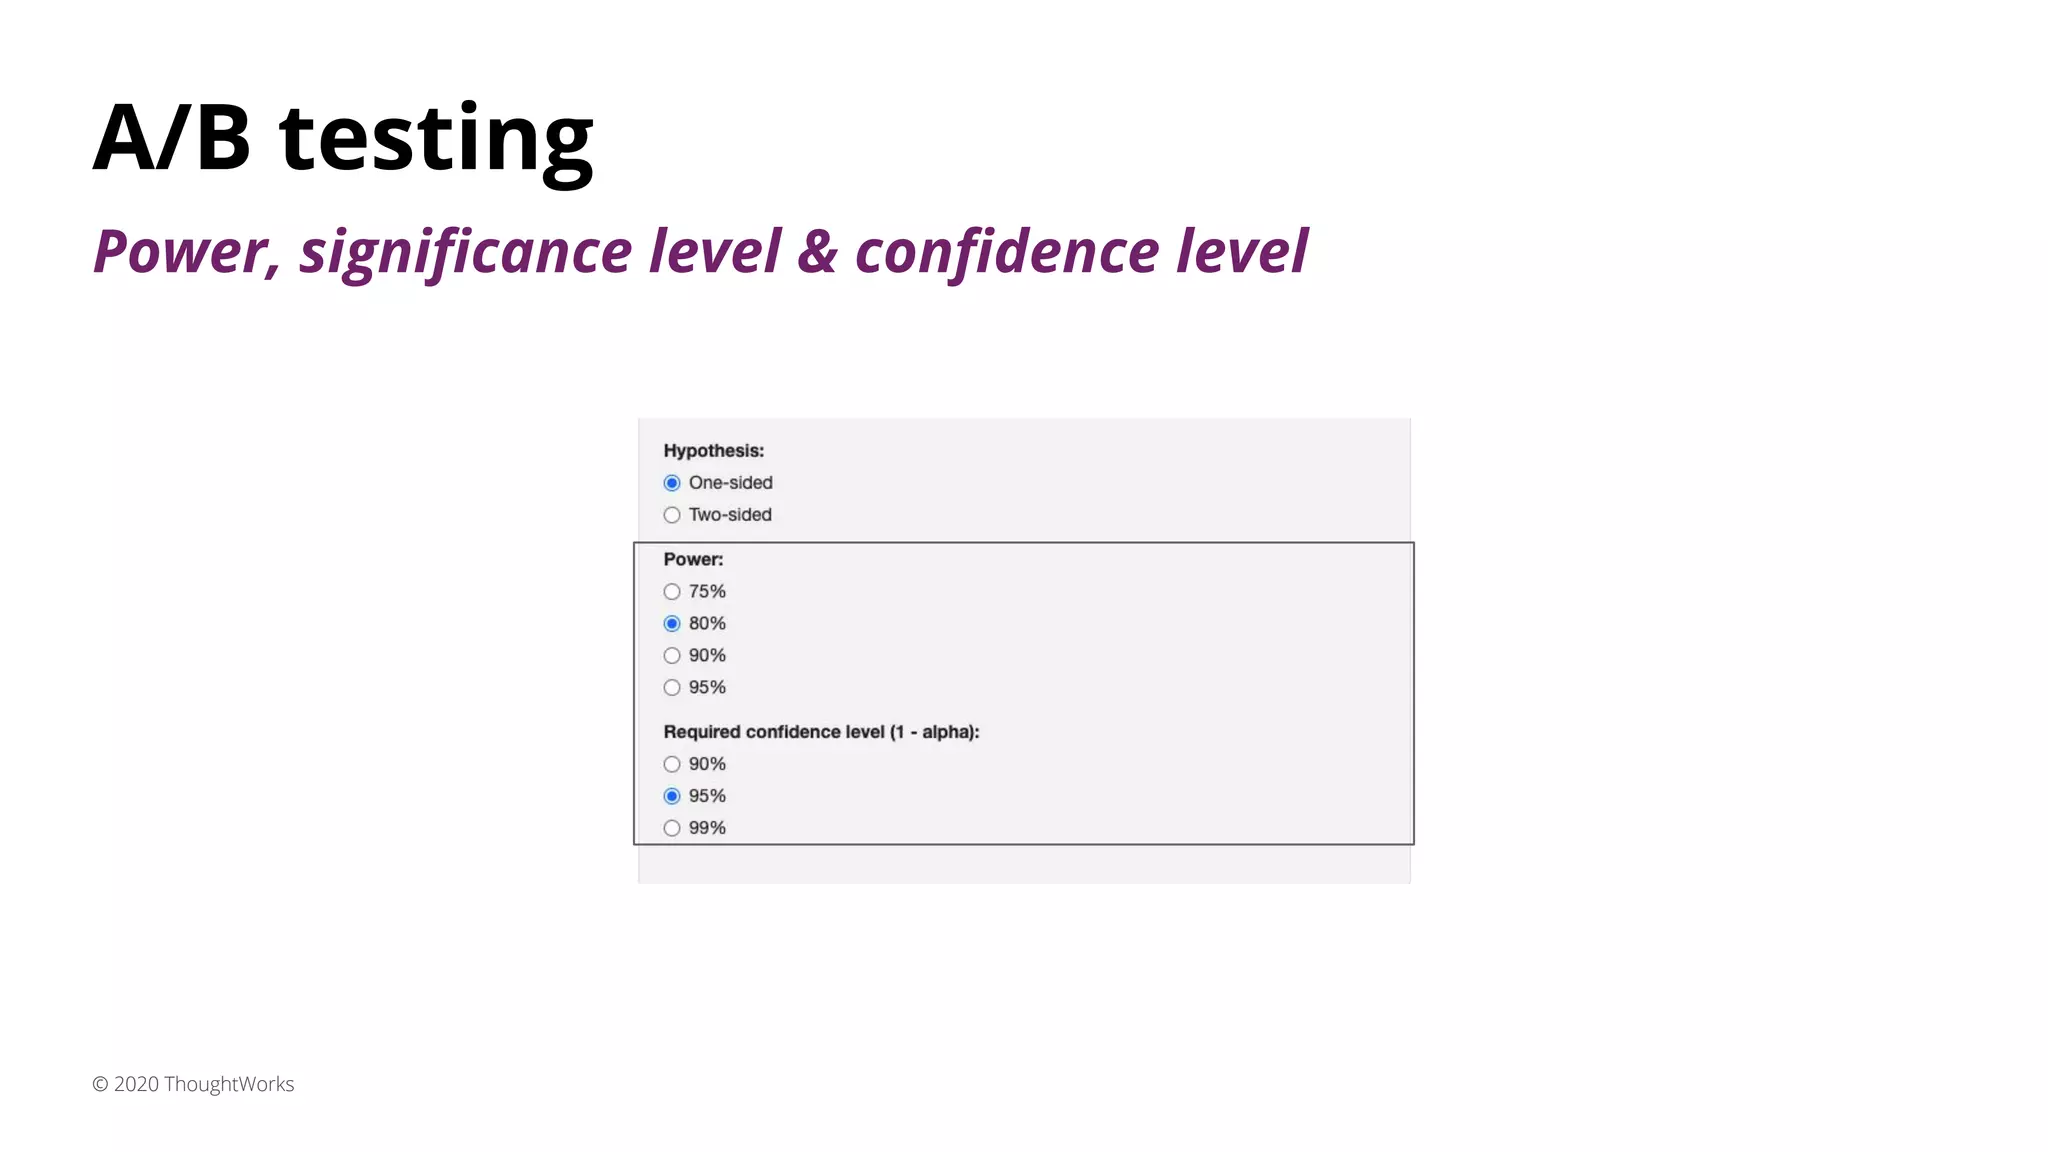
[normally two-sided]](https://image.slidesharecdn.com/whenindoubtgolive-xconf20-200706065838/75/When-in-doubt-go-live-38-2048.jpg)
![A/B testing
© 2020 ThoughtWorks
Source: https://abtestguide.com/abtestsize/
Metrics
we know
We decide from
previous data or
knowledge about
this variable
[effect size]
We can play but
mostly by
convention and
dependent on traffic
[accuracy]
Dependent on the
variable and what we
are looking for
[normally two-sided]](https://image.slidesharecdn.com/whenindoubtgolive-xconf20-200706065838/75/When-in-doubt-go-live-39-2048.jpg)


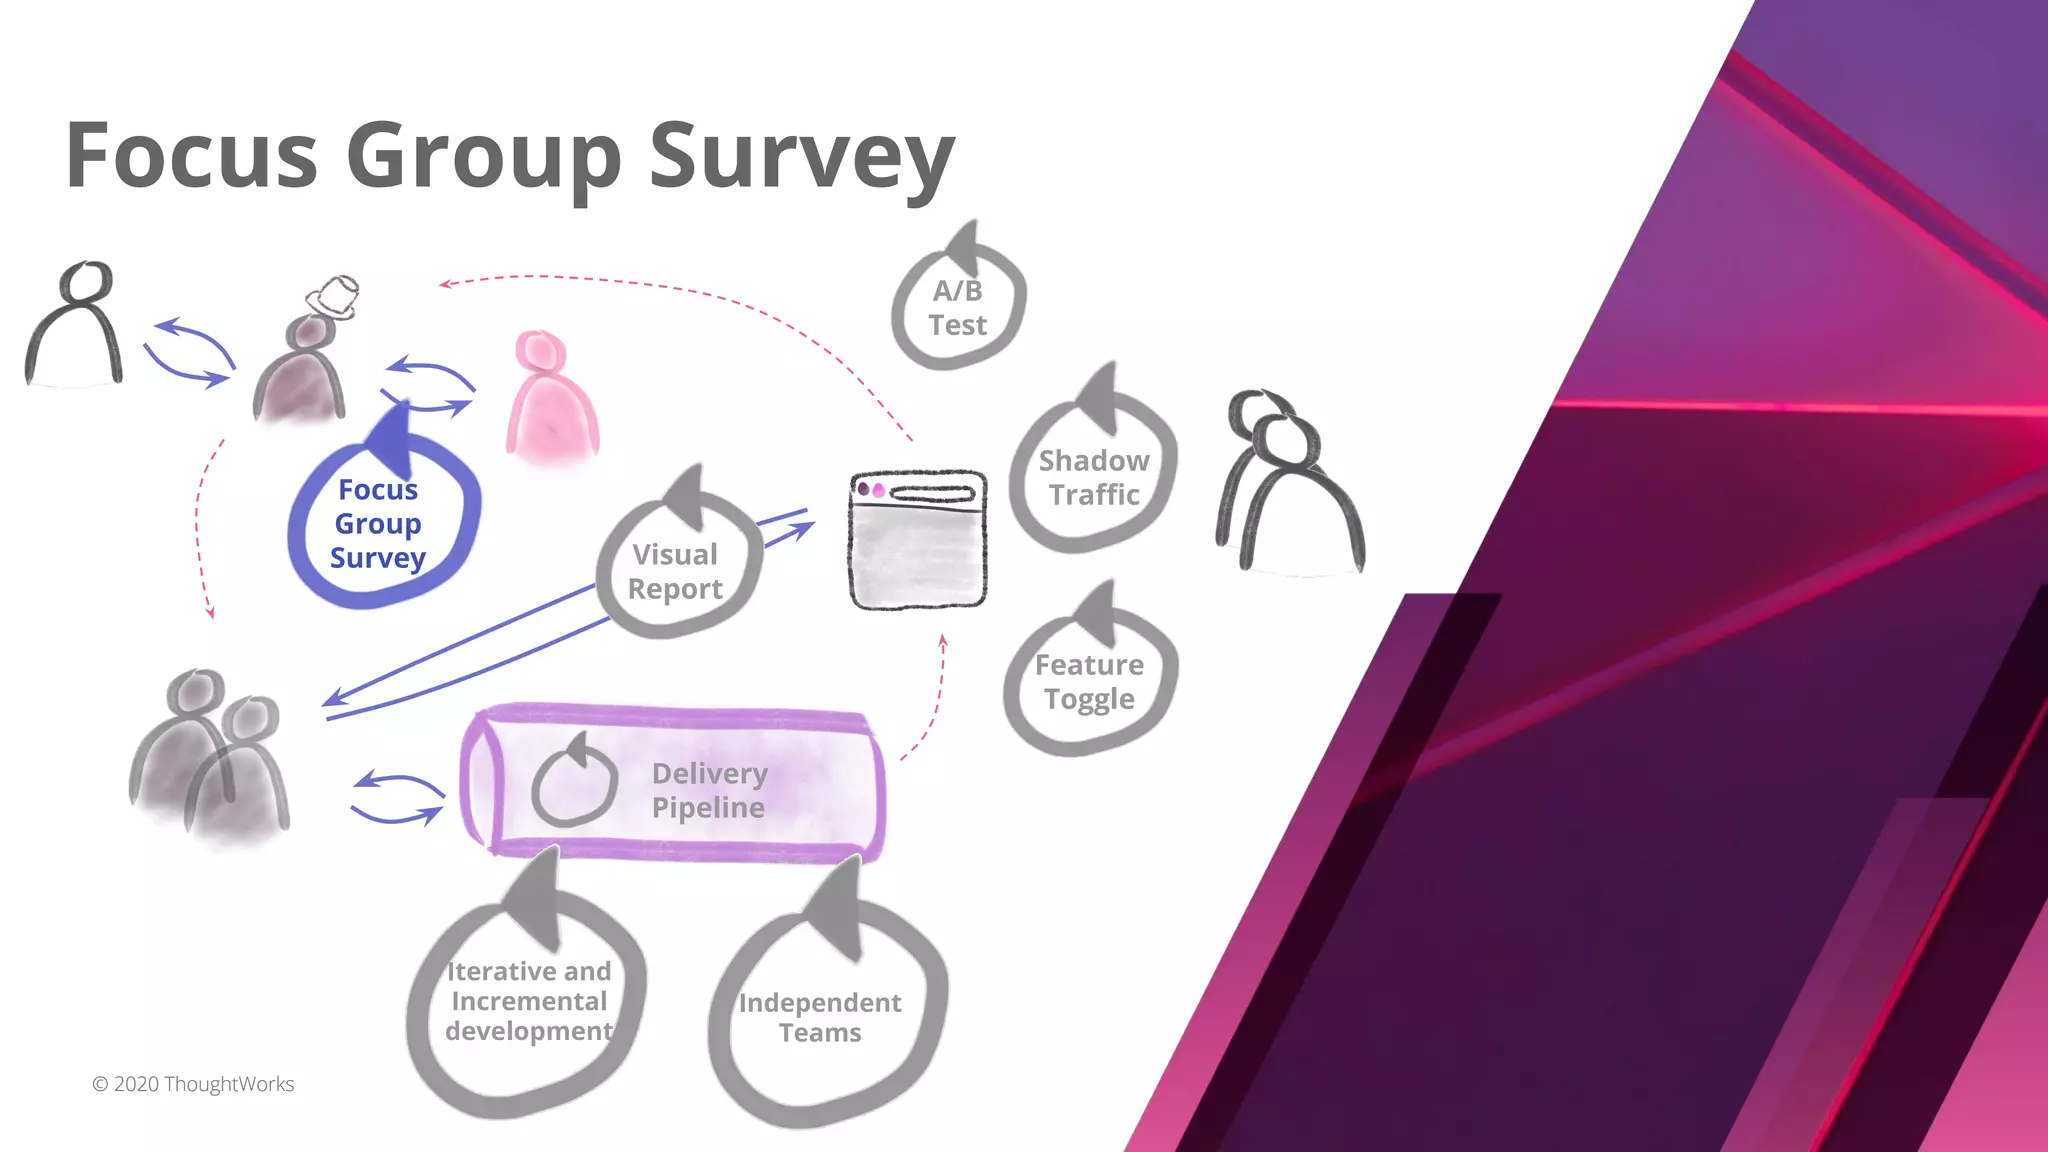


![Focus Group Survey
© 2020 ThoughtWorks
Stronglydisagree
Disagree
Neutral
Agree
Stronglyagree
Likert Scale
[categorical variable]
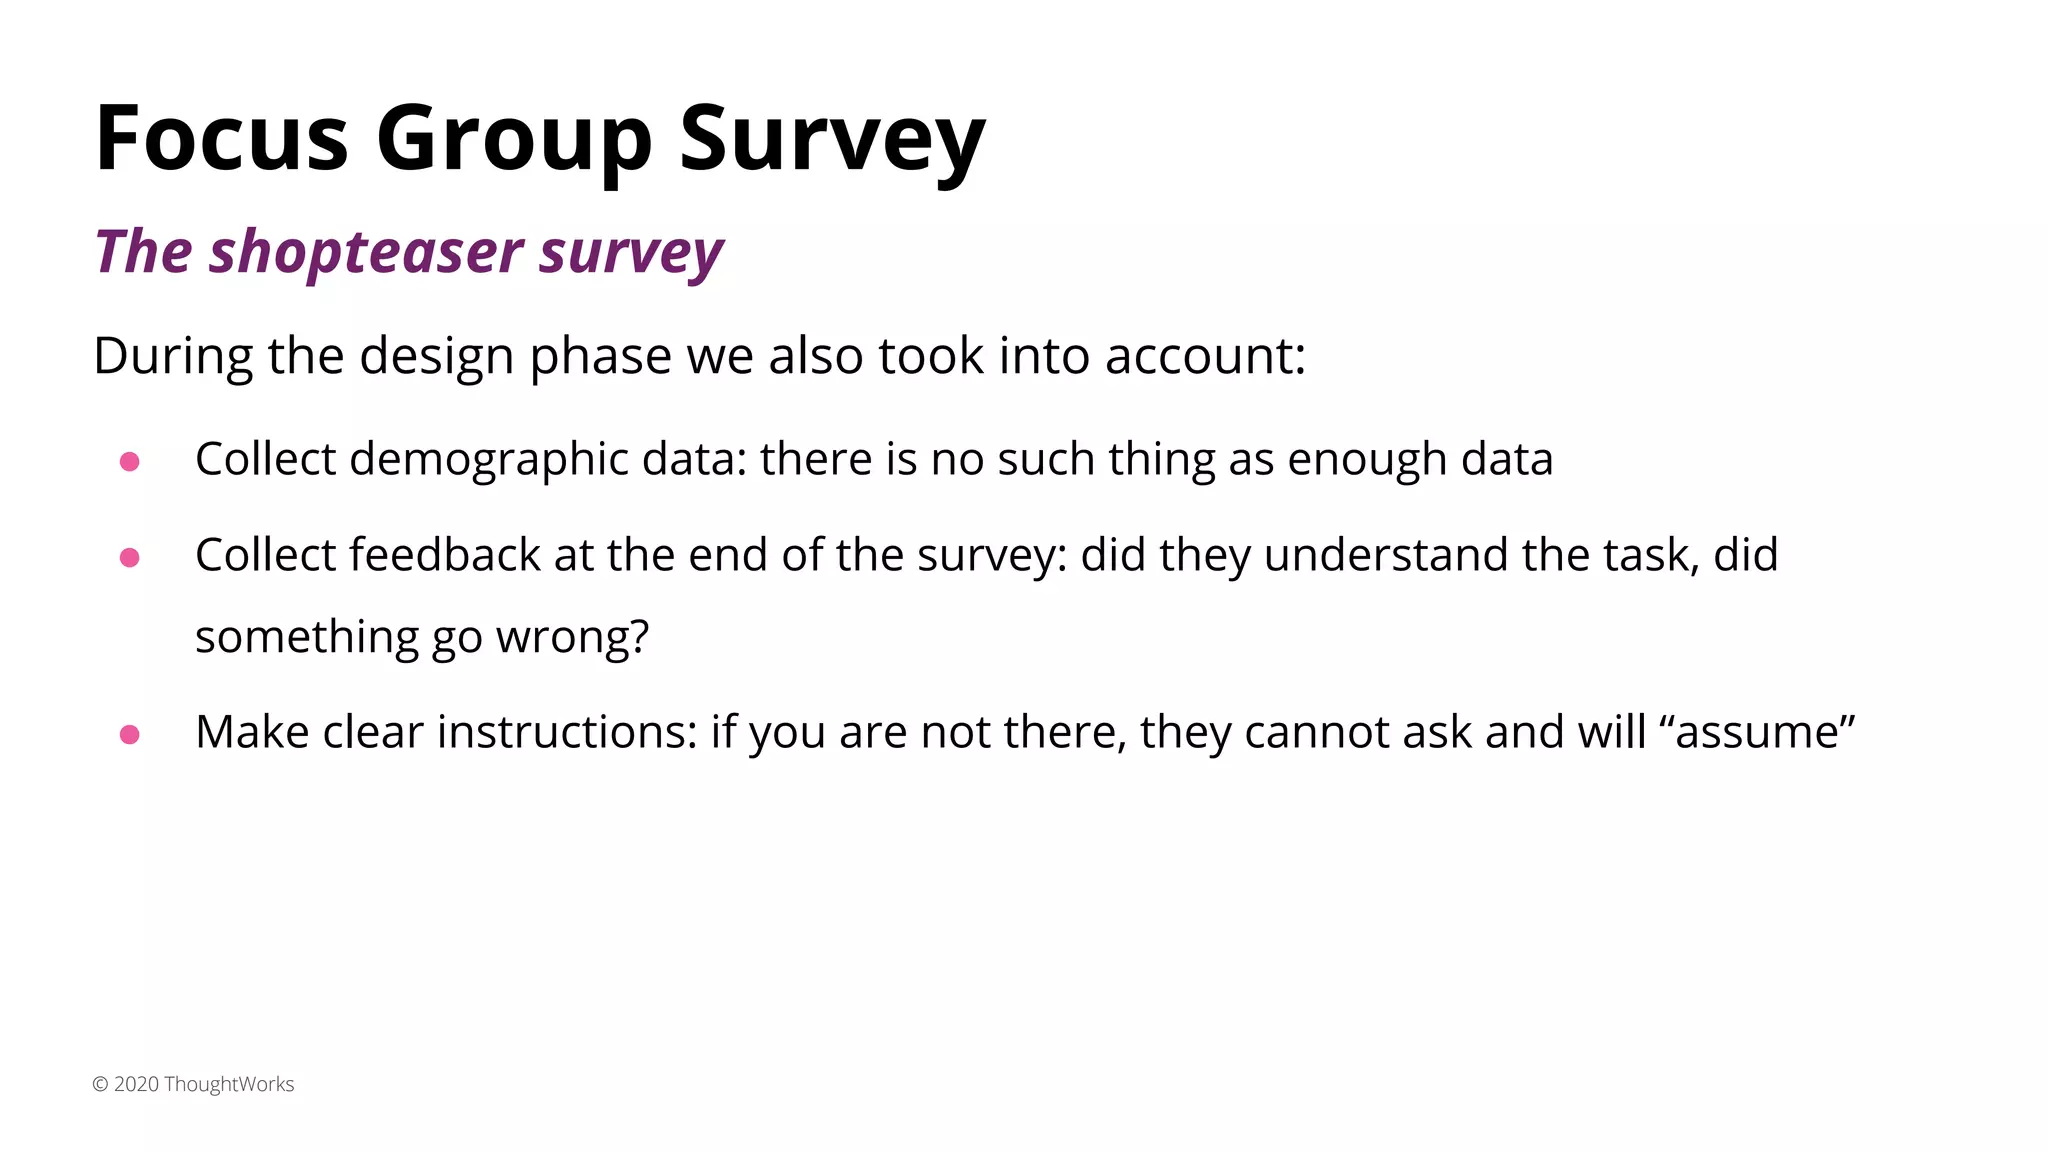
The shopteaser survey
Your research question will
drive the design of the
experiment and also the
analysis of your data
trial
trial
trial
trial](https://image.slidesharecdn.com/whenindoubtgolive-xconf20-200706065838/75/When-in-doubt-go-live-60-2048.jpg)
![Focus Group Survey
© 2020 ThoughtWorks
Stronglydisagree
Disagree
Neutral
Agree
Stronglyagree
Likert Scale
The shopteaser survey
trial
trial
trial
Things that could go wrong:
- Familiarity bias
Methodology examples:
- Gave 5s per trial so the
answers would be
spontaneous
- The first trials were
discarded
[categorical variable that can be
transformed to continuous -
scale 1-5]](https://image.slidesharecdn.com/whenindoubtgolive-xconf20-200706065838/75/When-in-doubt-go-live-61-2048.jpg)


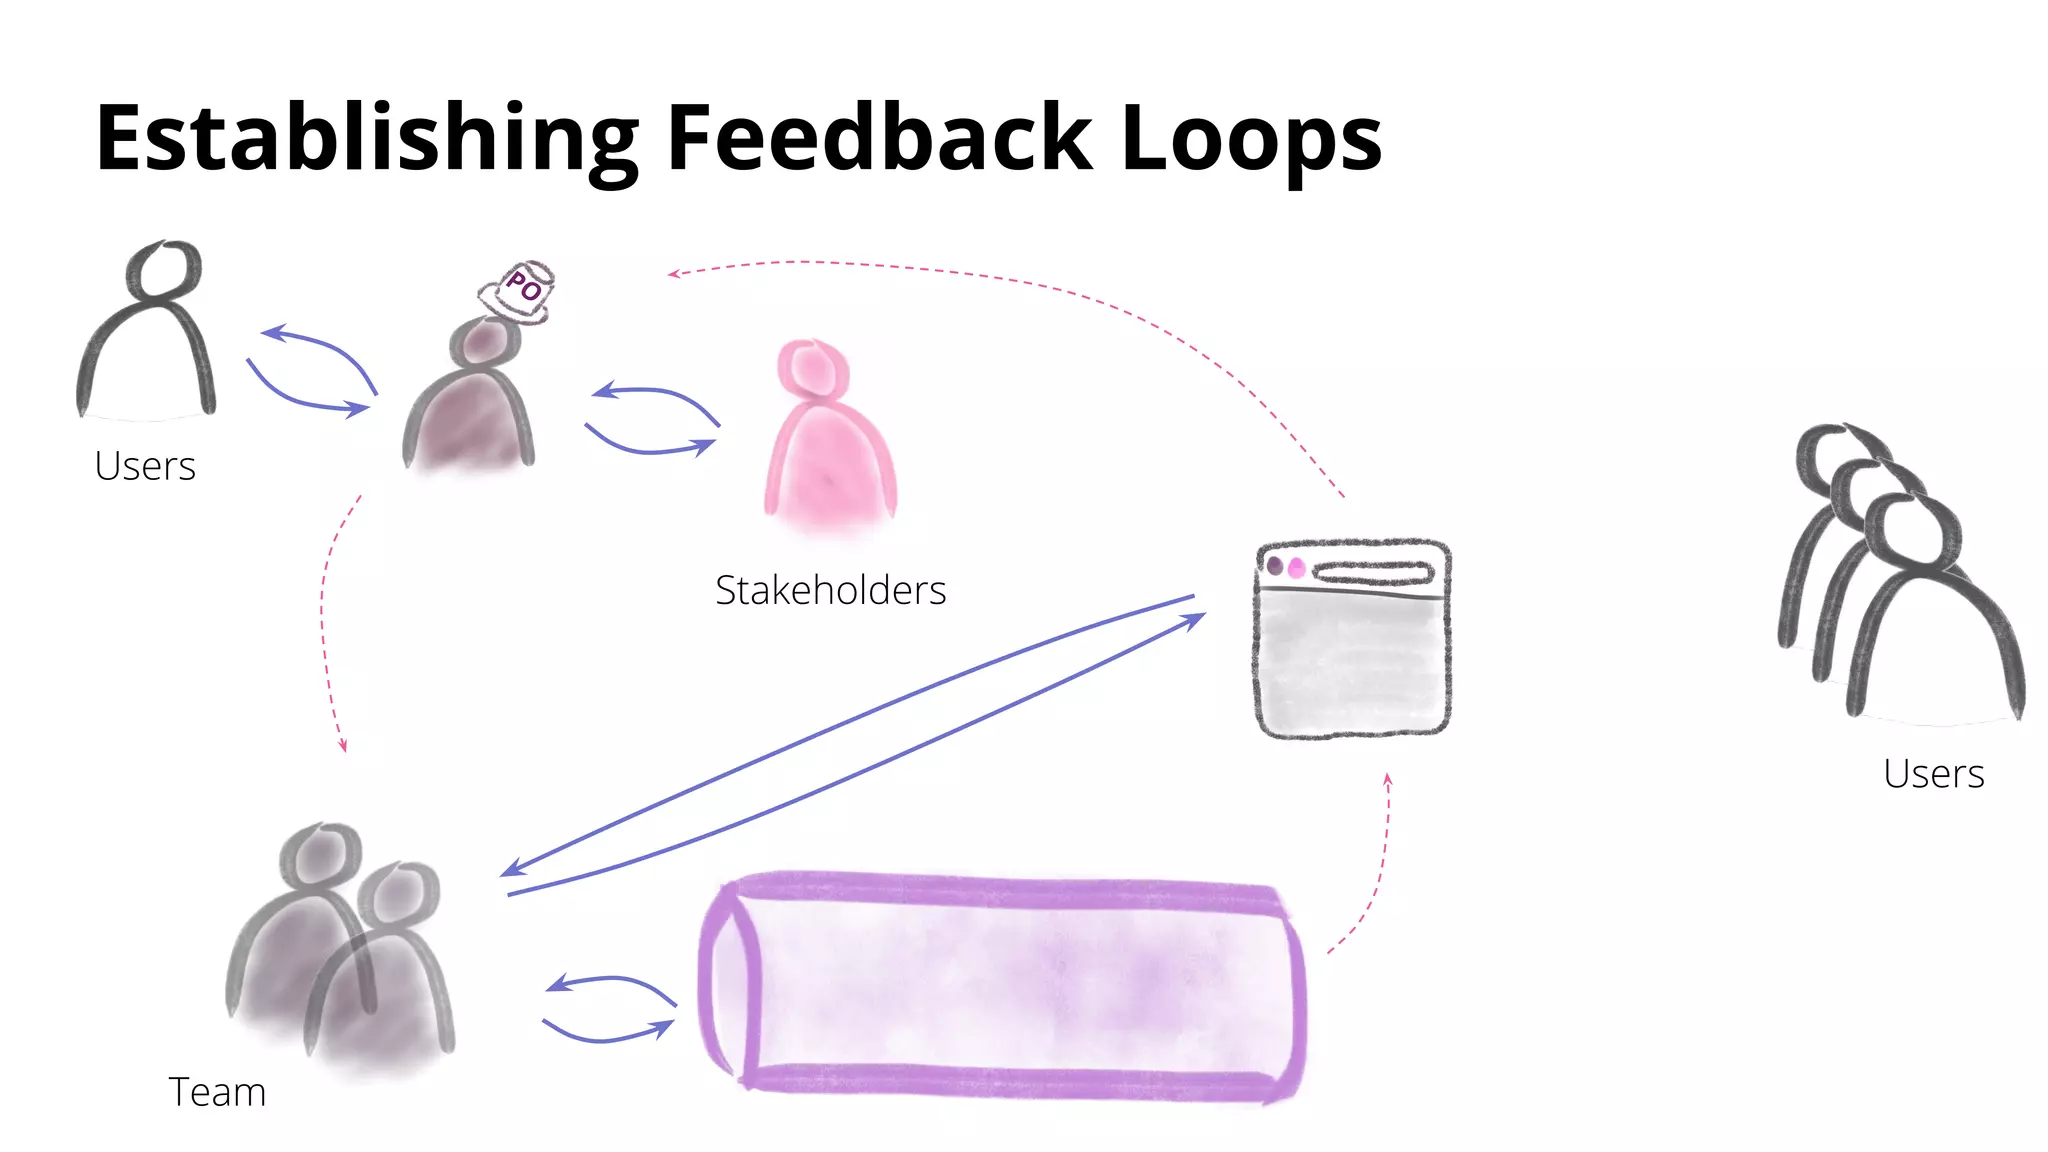
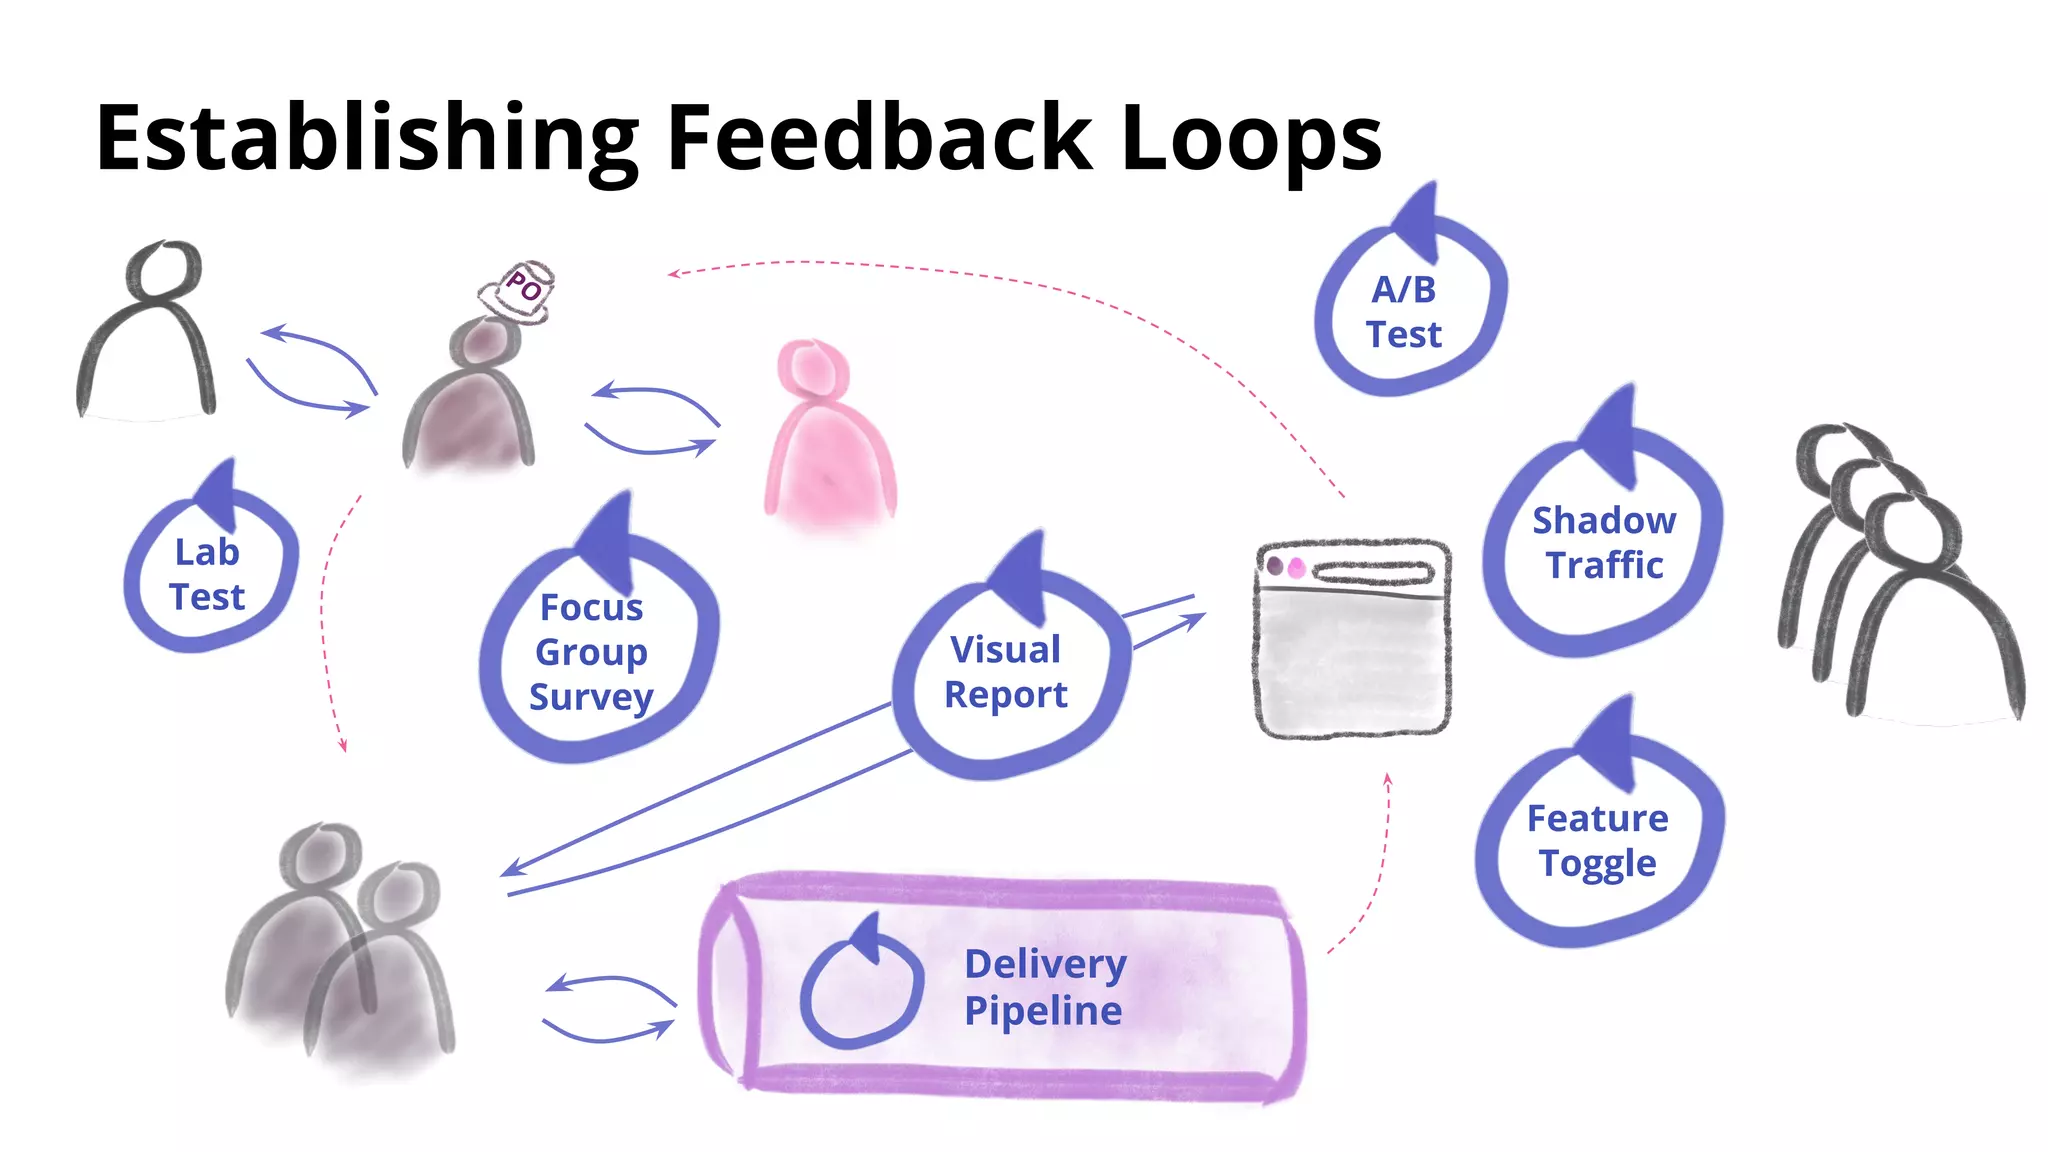
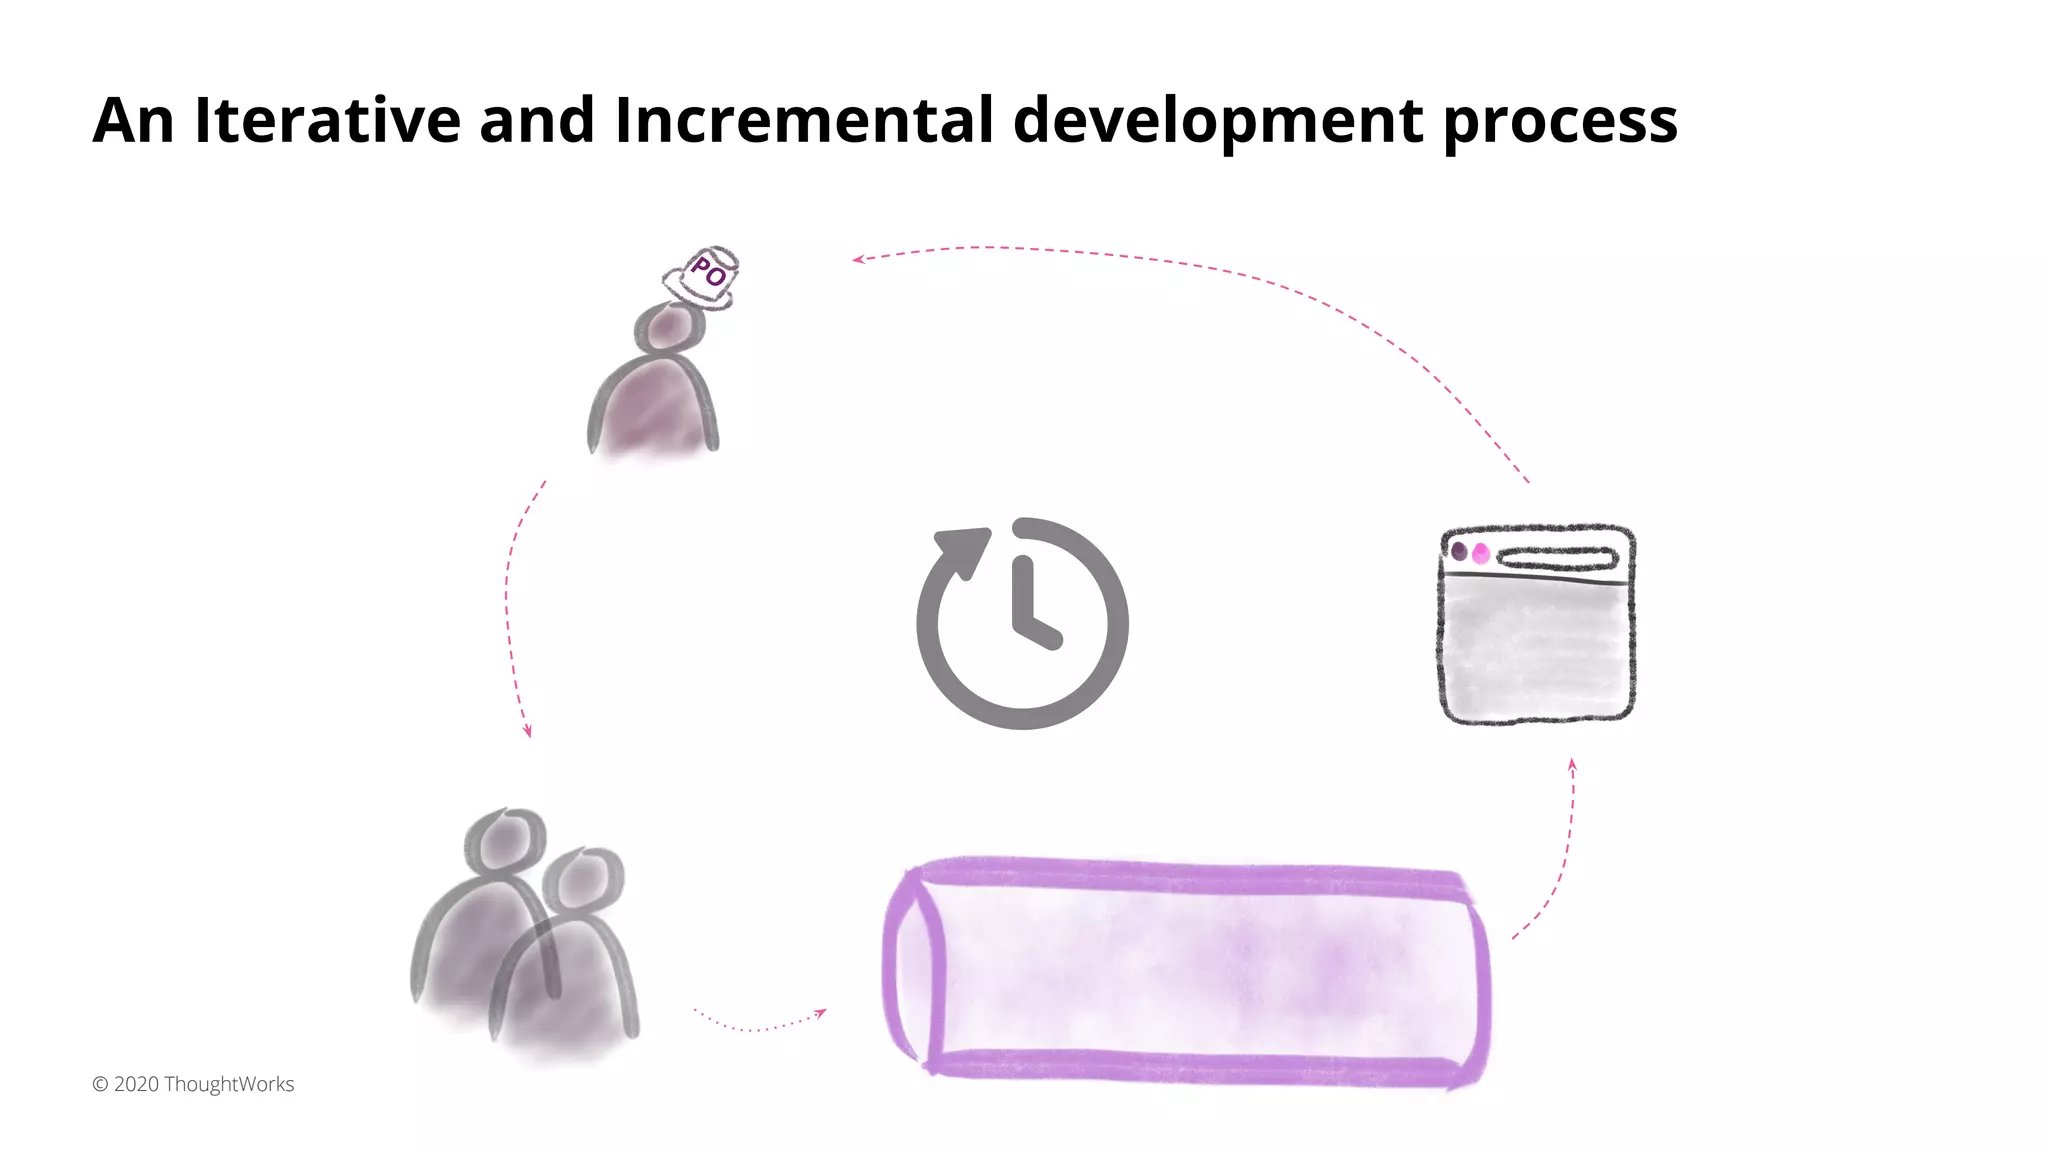
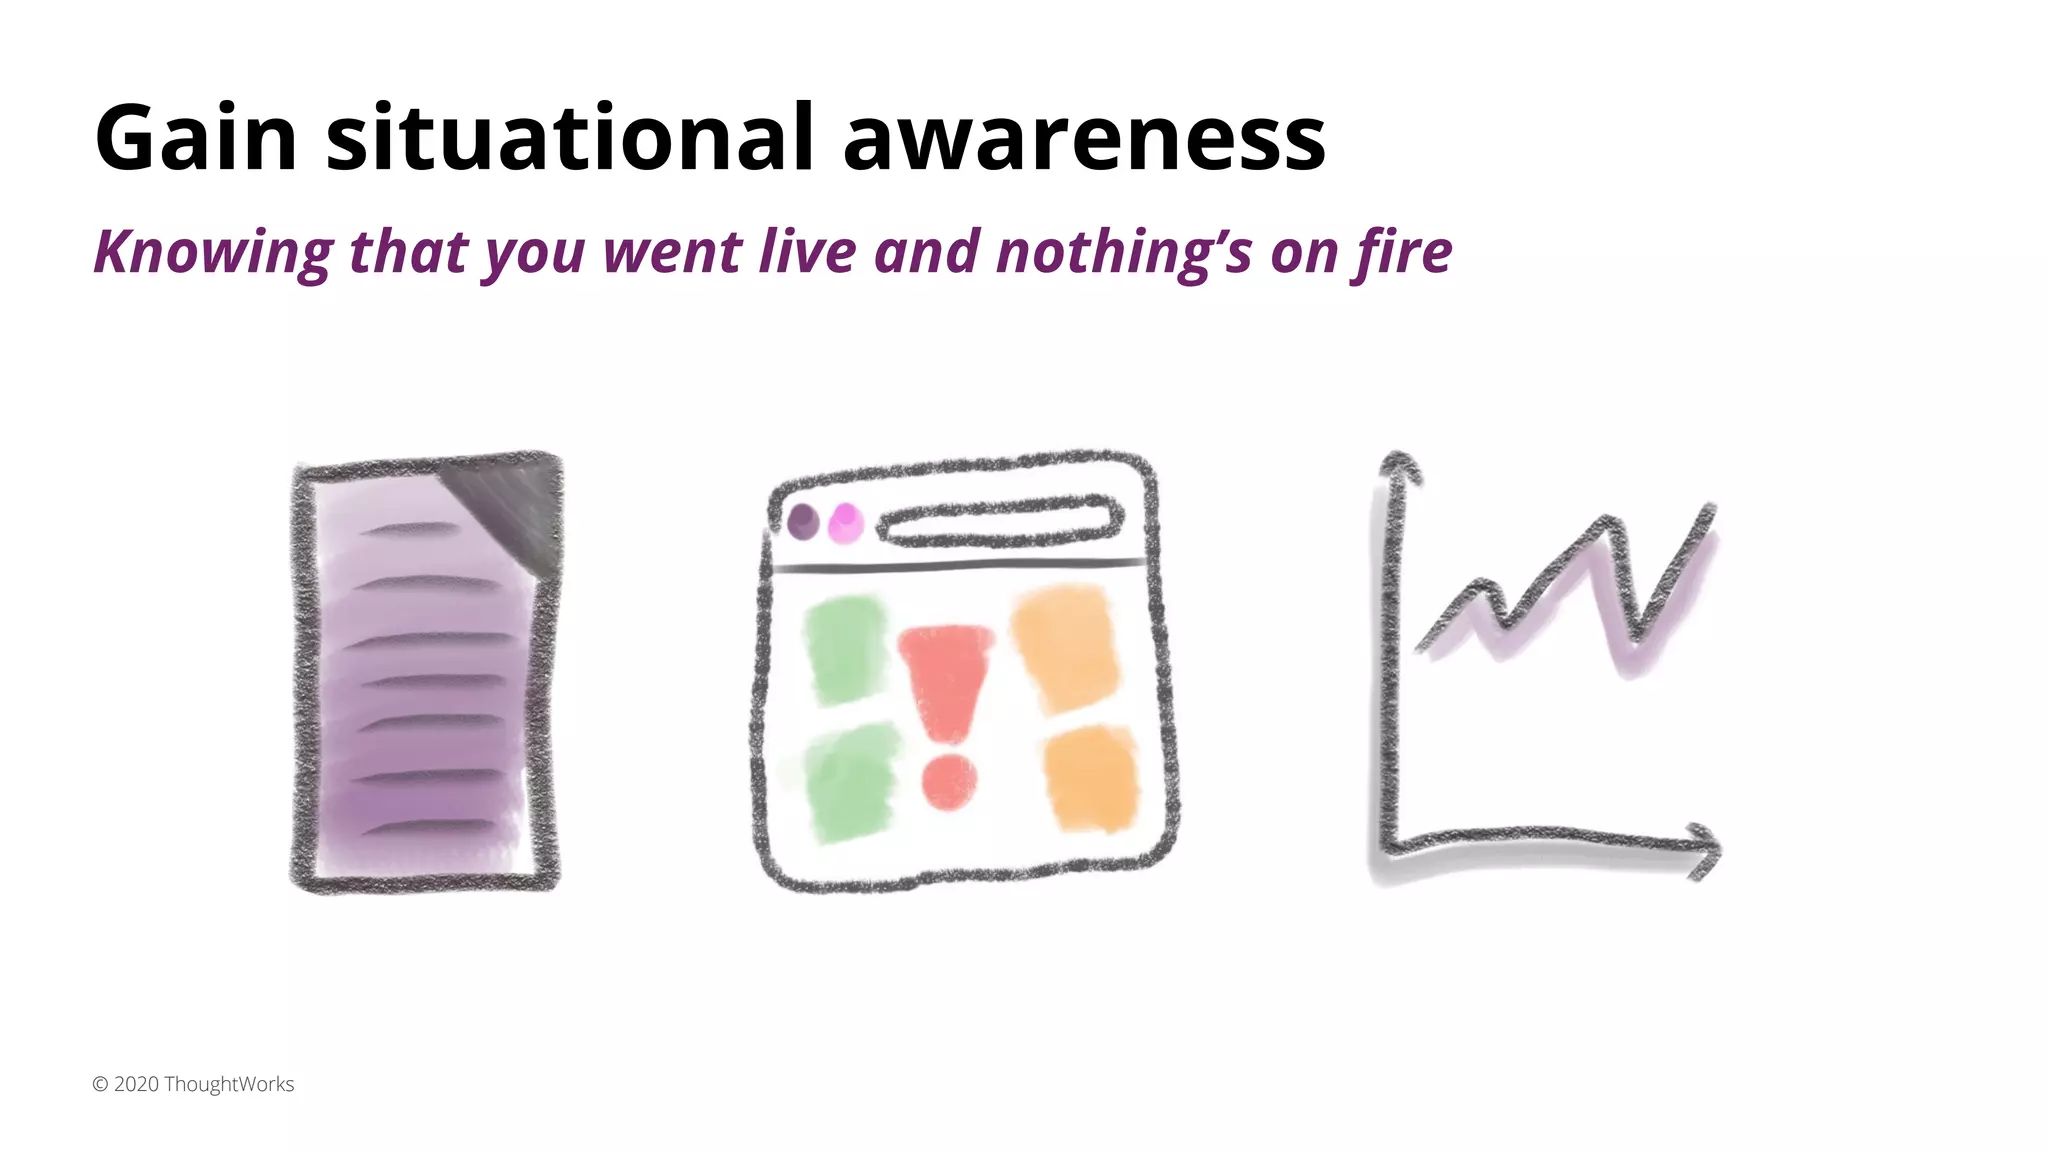
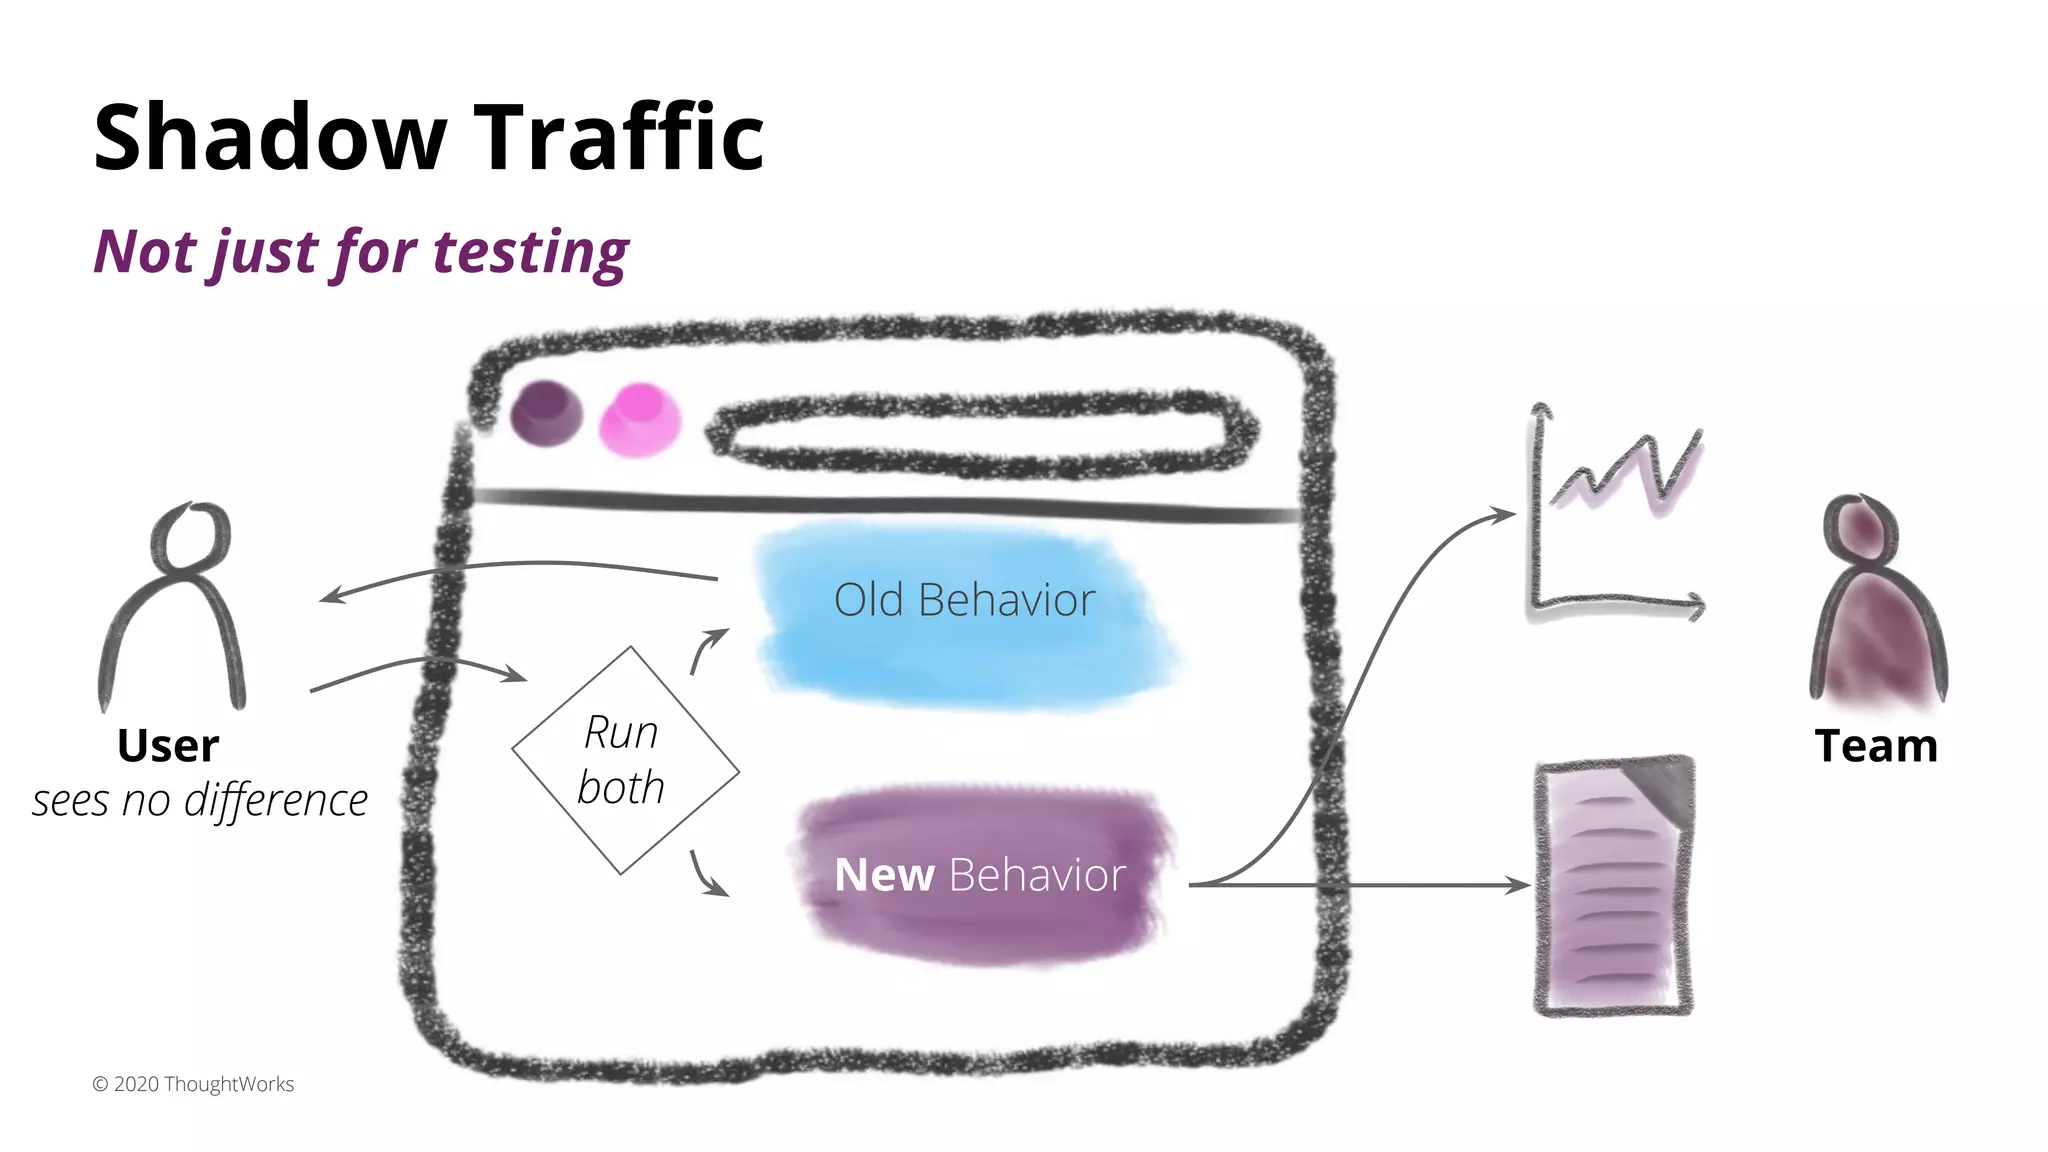
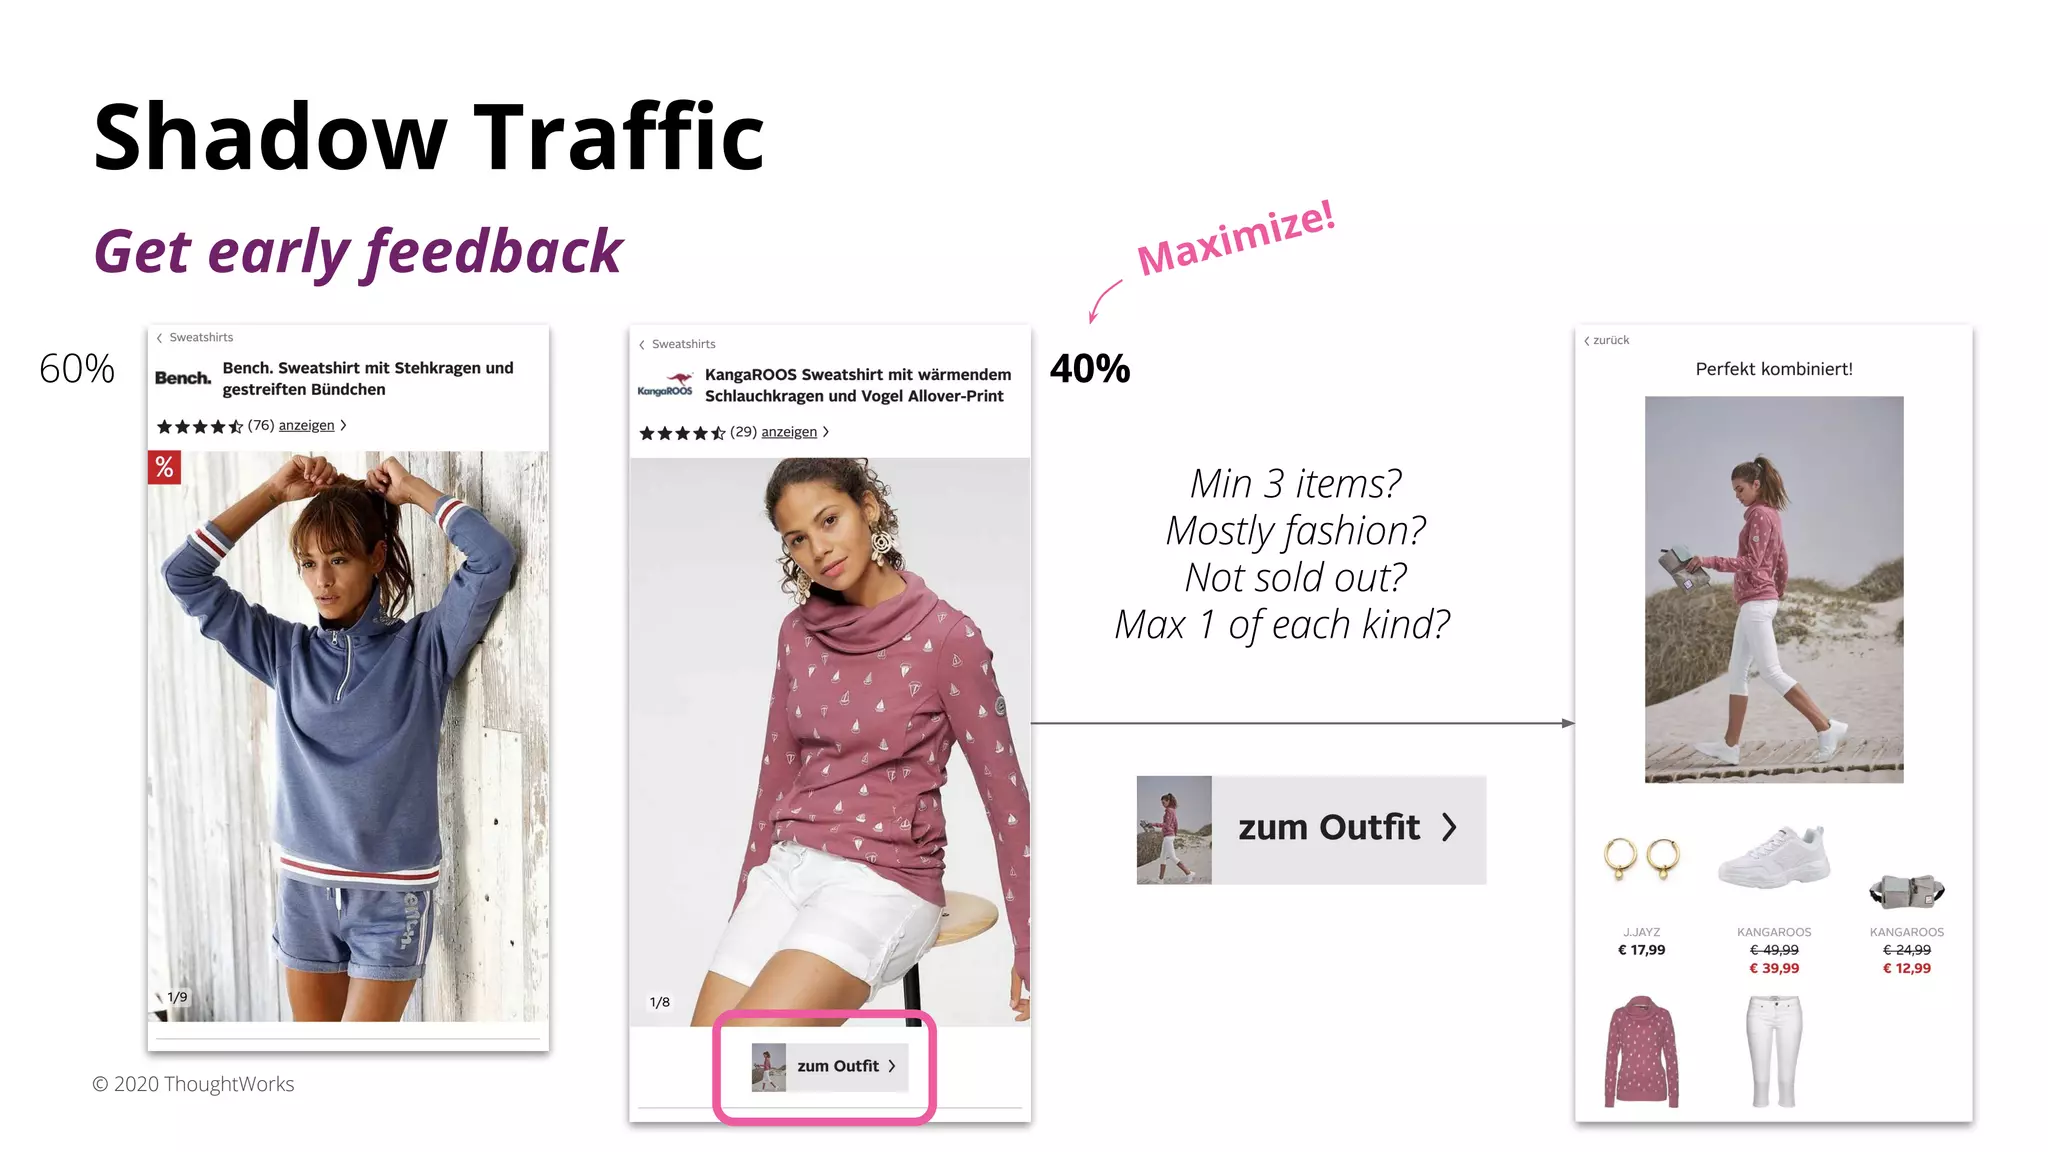
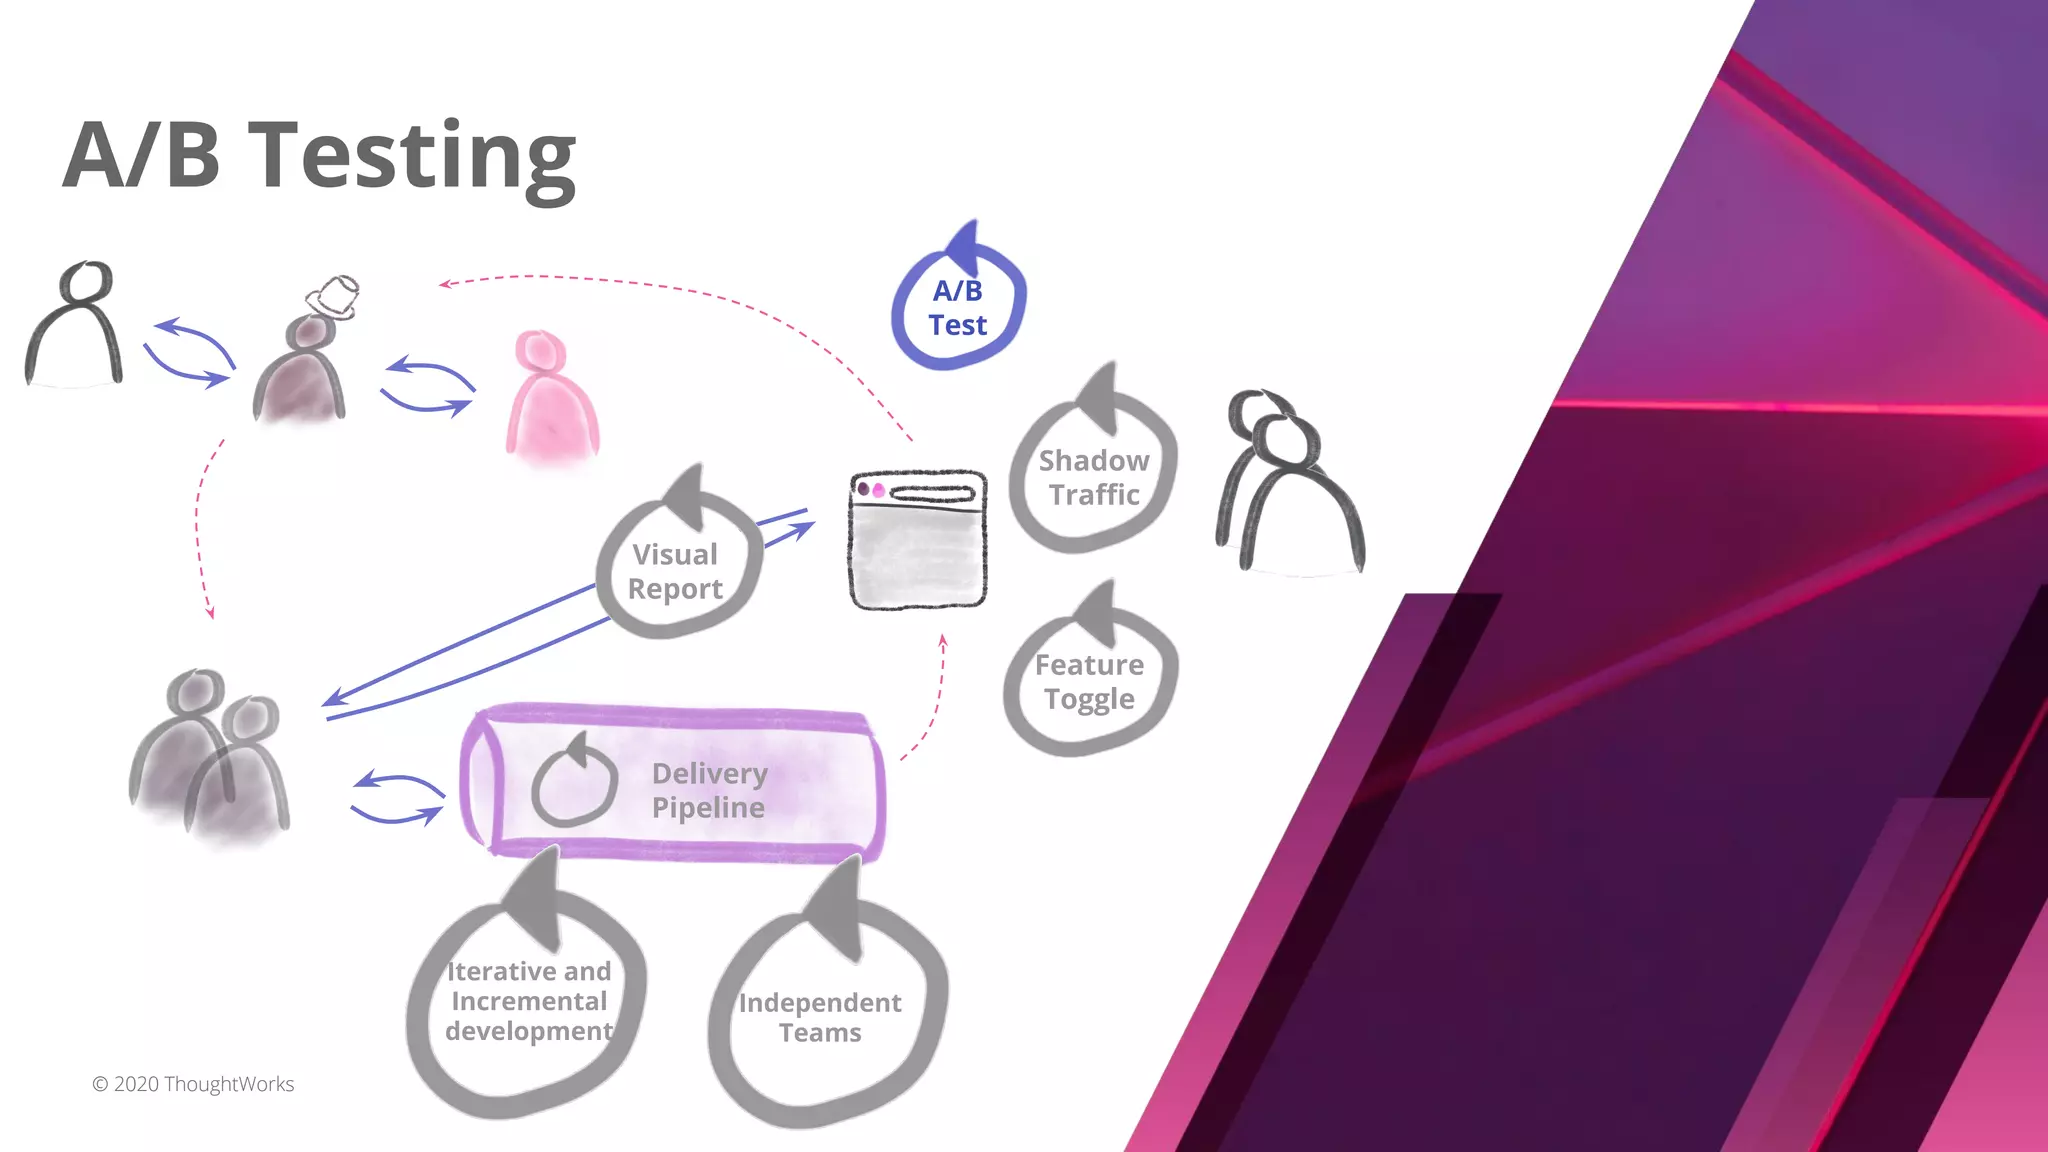
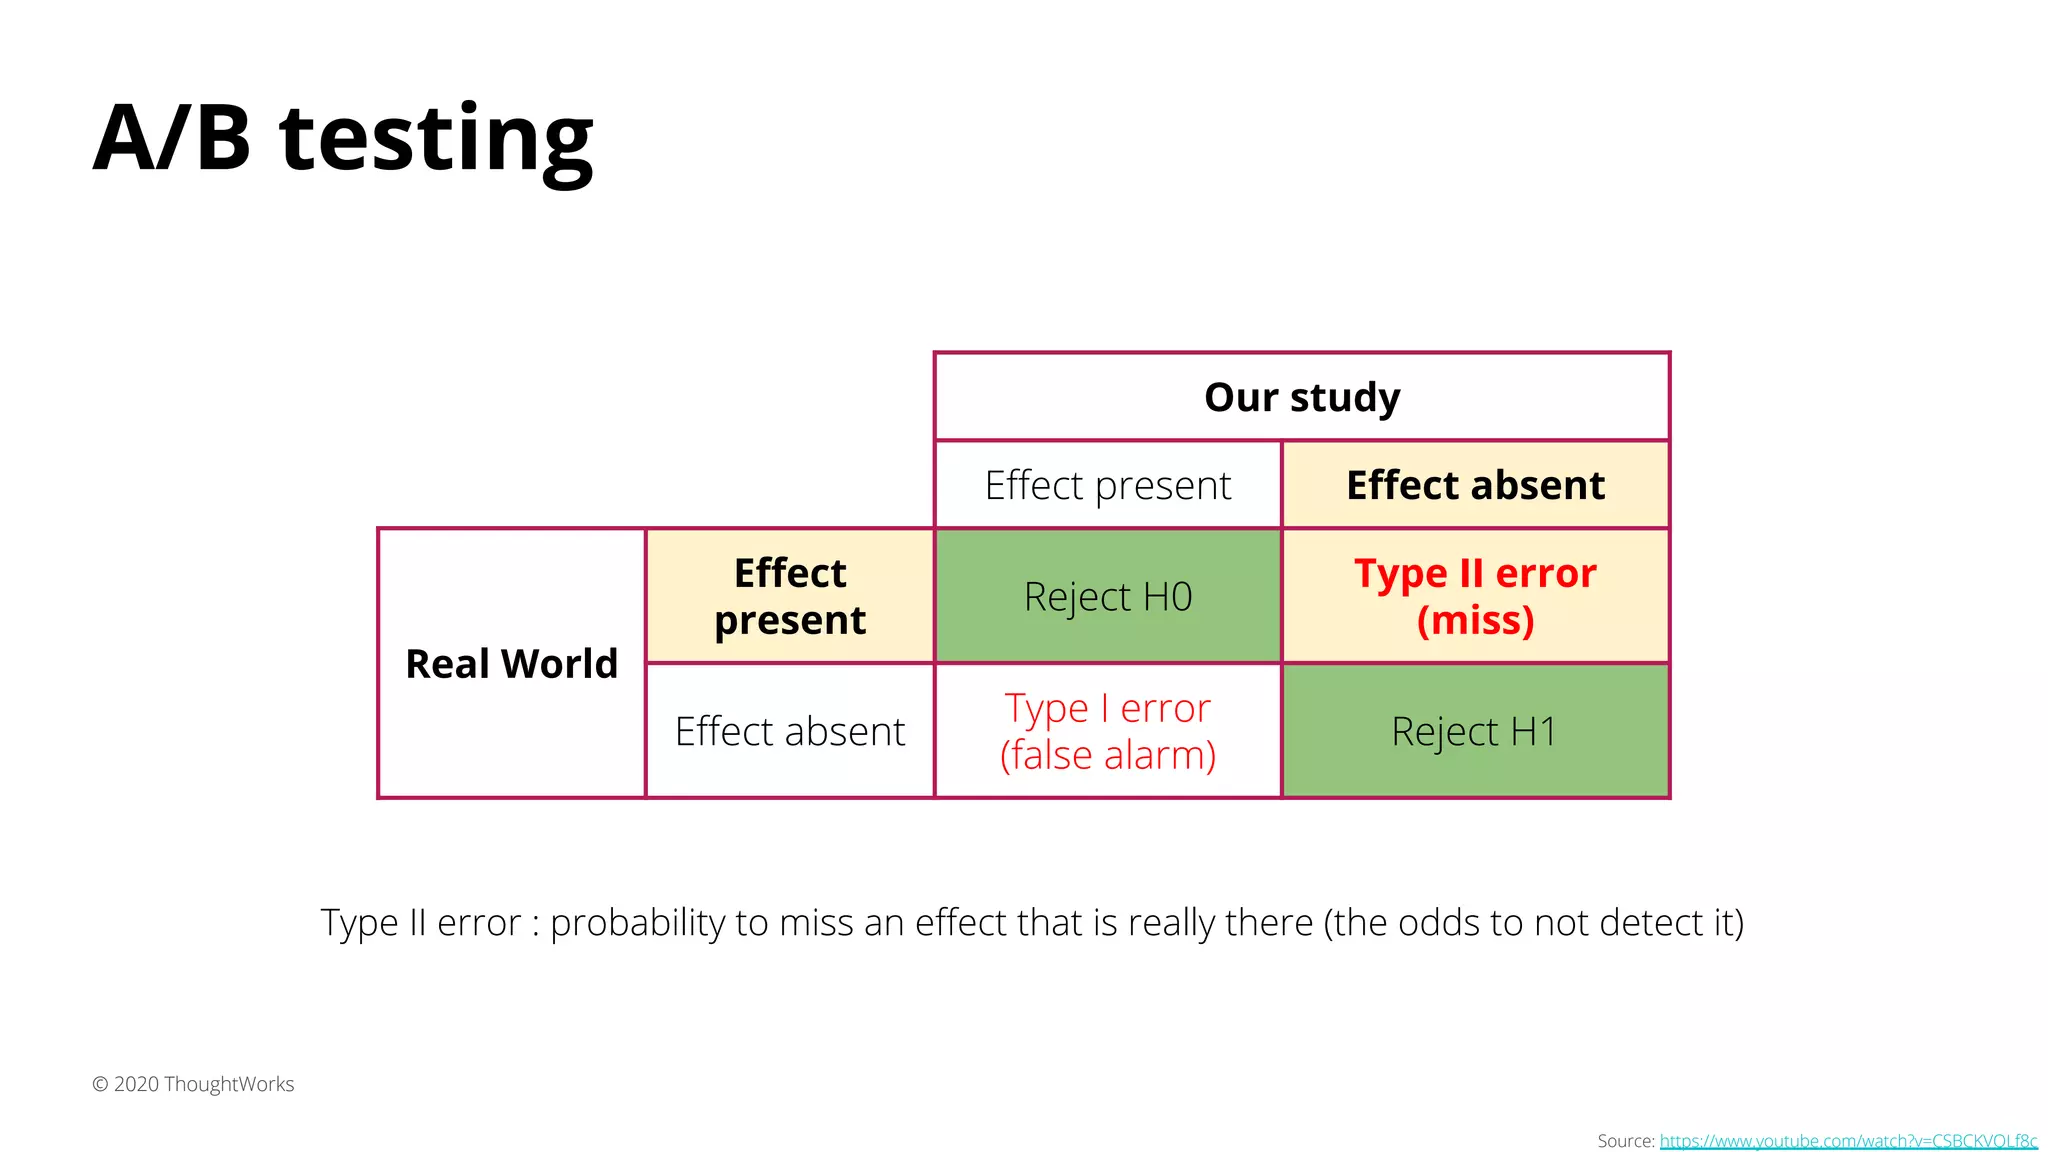
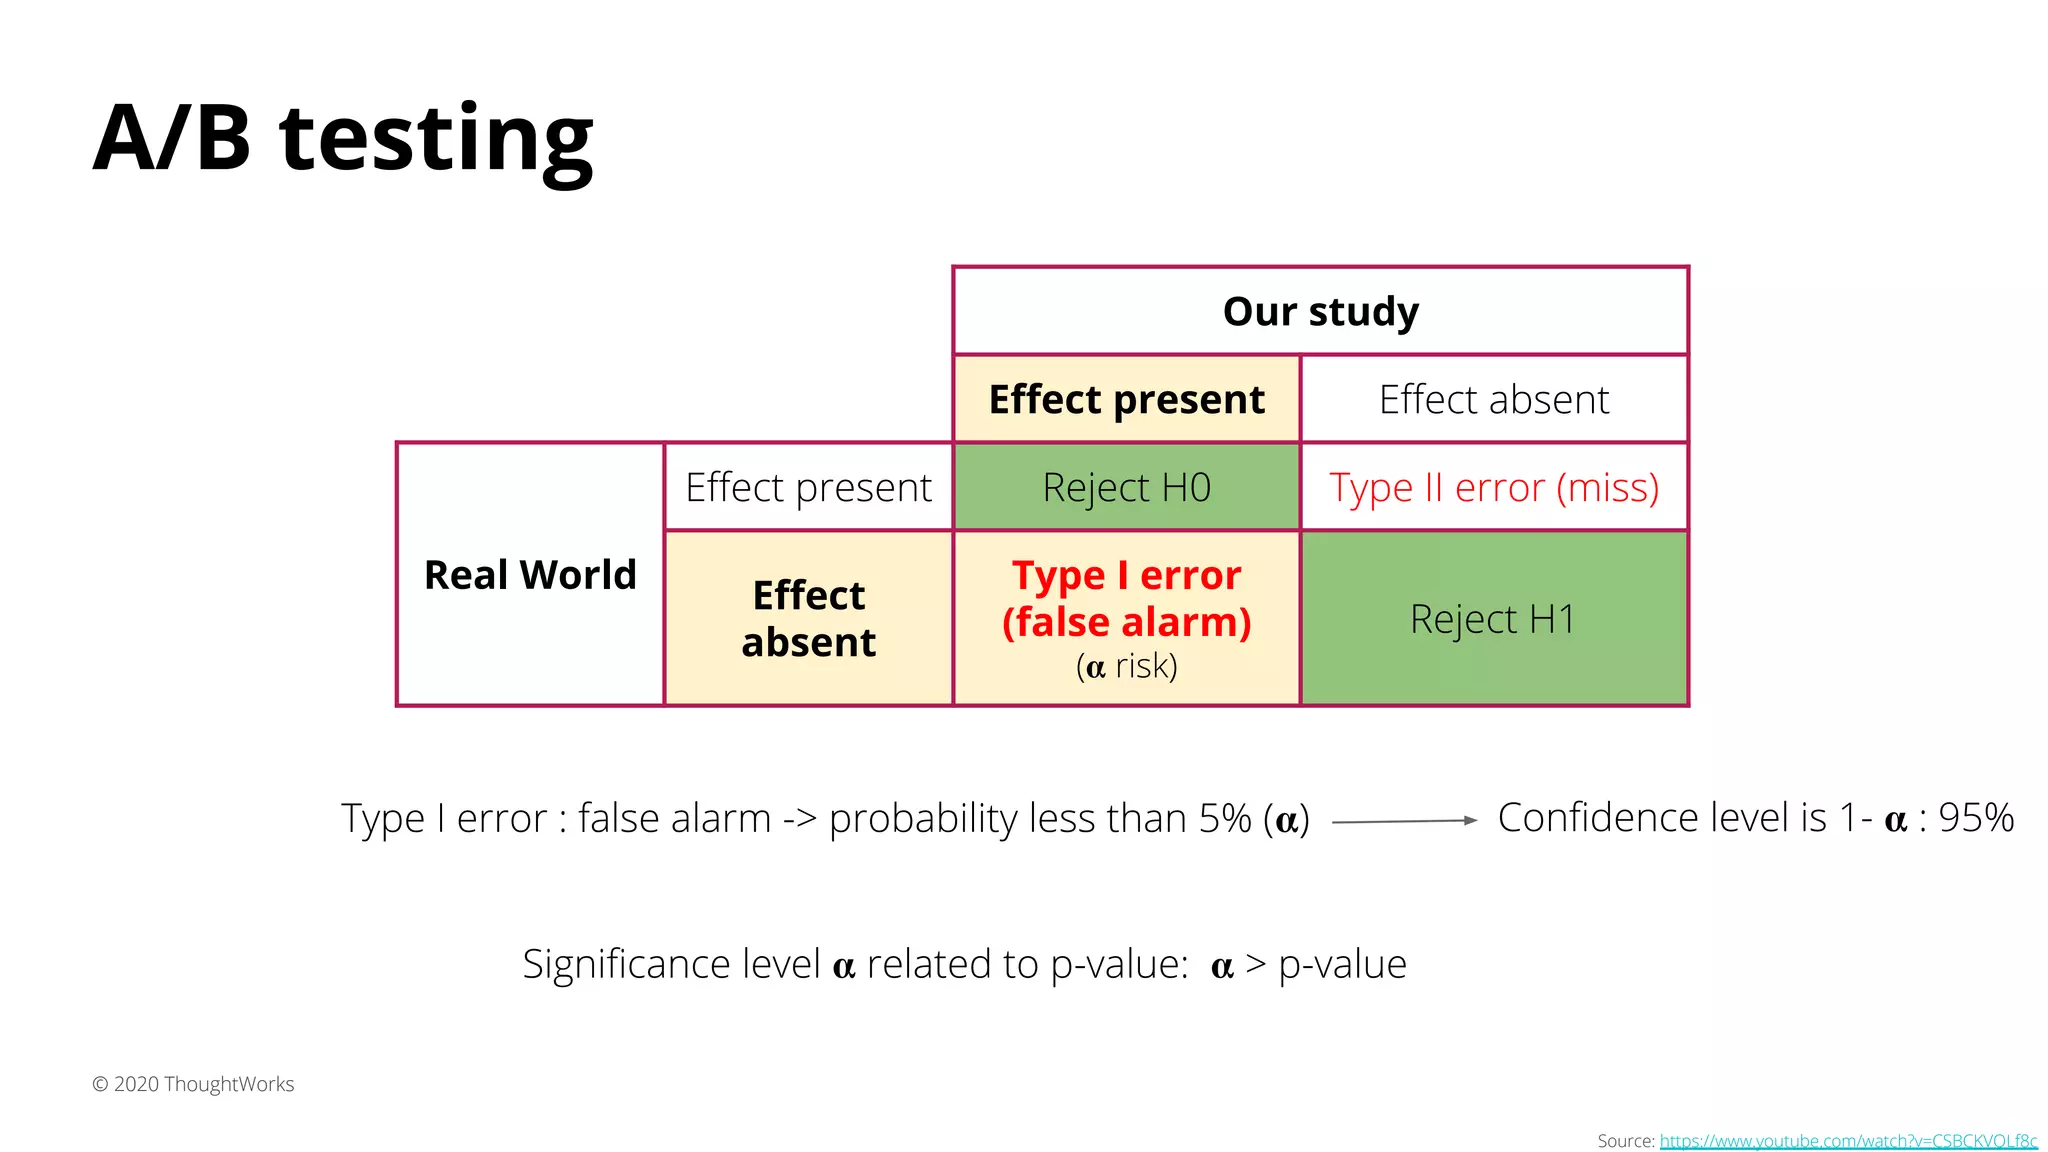
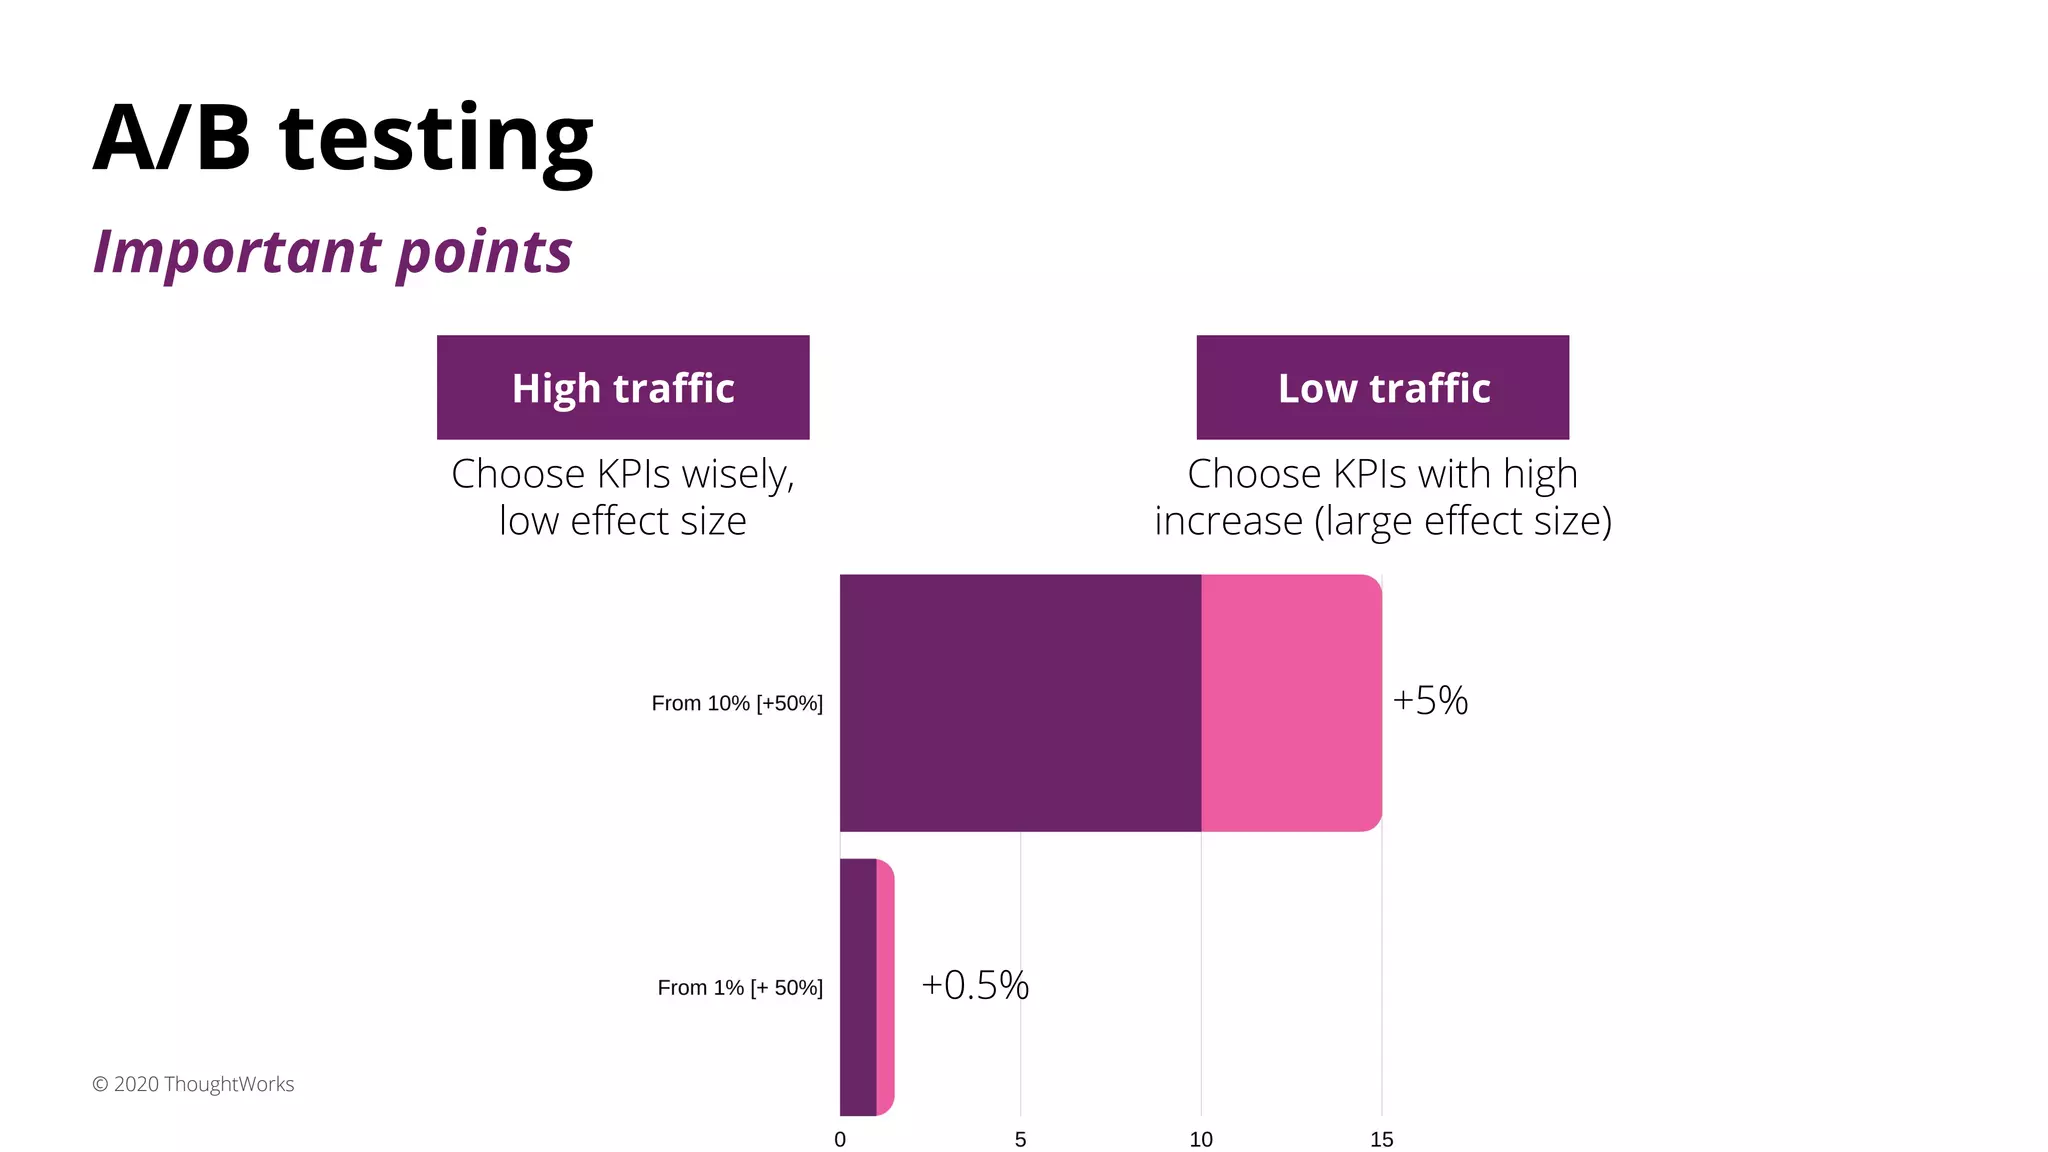
The document discusses techniques for establishing shorter feedback loops between developing features and measuring user behavior, including: 1) Shadow traffic which runs new and old features simultaneously to get early feedback without users noticing a difference. 2) Visual reports which assess the quality of a feature through a report (e.g. HTML page) of key metrics. 3) A/B testing which statistically compares user behavior between a control and test group after exposing each to a different variant of a feature. Sample size considerations and statistical significance are discussed.


