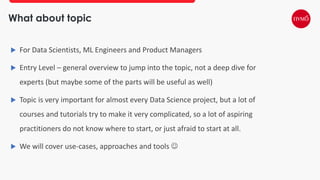
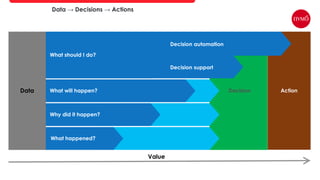
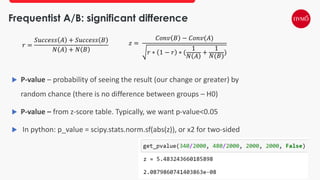
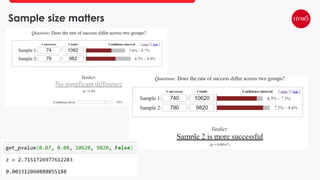
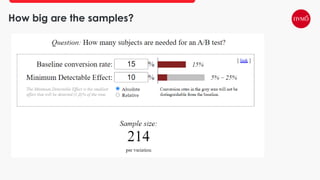
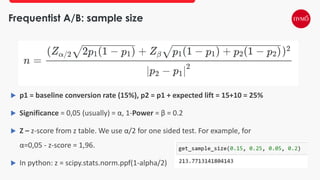
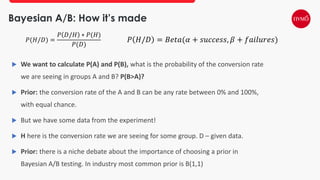
A/B testing overview: use-cases, approaches and tools
Andrii Belas
Head of Data Science
First Ukrainian International Bank
What about topic
 For Data Scientists, ML Engineers and Product Managers
 Entry Level – general overview to jump into the topic, not a deep dive for
experts (but maybe some of the parts will be useful as well)
 Topic is very important for almost every Data Science project, but a lot of
courses and tutorials try to make it very complicated, so a lot of aspiring
practitioners do not know where to start, or just afraid to start at all.
 We will cover use-cases, approaches and tools 
Andrii Belas, Head Of Data Science, FUIB
 PhD candidate (IASA KPI)
 2015-2016: Junior Data Scientist – SAS Institute Inc
 2016-2019: Data Scientist – SMART business
 2019: Data Science Lead – uData
 2019-2020: Senior Data Scientist – SoftServe
 2020-present: FUIB
 Creator of the Incrypto, Data Science for Business
 Public speaker, mentor
Data
Value
Data → Decisions → Actions
Use-case: VseCard Product offering
 We want to recommend our product VseCard – to some group of
customers.
 We already know, that nobody cares about accuracy of our model, if we
are designing project properly, we should care about business impact
 So, we decided, that conversion rate will be our main product metric. We
can call 2000 (for example) customers per month, so we want to maximize
our conversion rate.
Team Data Science Process
Source: Microsoft
Use-case: VseCard Product offering
 Problem: how to test our solution?
 We can not use the history, because if we didn’t recommend anything to
that client, we don’t know his possible reactions, so using backtest we can
confirm only positive cases
Solution – A/B testing
Statistical significance?
It’s time for some tools 
How long does it take?
Period
 Period: usually driven by business, for our example it will be 2 months (1
for calls, 1 for product opening). If not provided, for classical business
scenarios I recommend duration to be at least 2 weeks, or even better 1
month to capture possible weekday/payday factors, holidays and novelty
effects/change aversion.
How big are the samples?
Sample sizes
 Sample size: can be also made by business (like in our example), or you can
use some scientific tools as well
 Baseline conversion rate – typical conversion rate for current approach
 Expected lift – can be driven by business, when project potential outcome
was estimated (ROI), or we can use A/A test to help us a little bit (will be
covered later). It also often called minimum detectable change.
How big are the samples?
Can we stop the experiment earlier?(p-value hack)
Split between groups?
Split
 General idea: we want to get representative sample. So we want to get to
groups, that are similar to each other by all factors, except the our
experiment.
 Best practice: split randomly by user id no matter what.
Are they really the same?
My secret rule to find difference between datasets
 1. Create new column – group, label the data in both groups accordingly
 2. Train simple ML model (I like Random Forests), on dataset features, with
group as target
 3. Check out model performance
 4. Check out feature importances
Some summary
A/B test hypothesis summary
 If we replace X with Y for <specific> users on <time period>, then metrics
<a,b,c> will <increase/decrease> <and metrics p,q (invariants) will not
change>
Test the A/B test?
A/A test
 Often used for testing A/B testing framework (sampling/splitting schema,
analytics engine…).
 Idea: create two groups, like in A/B, but they both receive the same
experience
 You should not observe any statistical difference
 Can be also useful trick to find lift for high variance/sensitive metrics
How it’s made?
Solution 1: Frequentist A/B testing
 H0: A and B have the same behavior, no significant difference, H1: there is
the difference between groups
 Type 1 error: there is no difference (H0=True), but we said that there is
difference. Significance – P(err1) = 0,05 (usually) = α. Or sometimes P(not
err1) = confidence level = 0,95 is used
 Type 2 error: there is the difference, but we said there is no. So probability
to find the difference, where there is the one = Power = P(not err 2) = 0,8.
1-Power = β
Statistical difference
Frequentist A/B: significant difference
 P-value – probability of seeing the result (our change or greater) by
random chance (there is no difference between groups – H0)
 P-value – from z-score table. Typically, we want p-value<0.05
 In python: p_value = scipy.stats.norm.sf(abs(z)), or x2 for two-sided
𝑟 =
𝑆𝑢𝑐𝑐𝑒𝑠𝑠 𝐴 + 𝑆𝑢𝑐𝑐𝑒𝑠𝑠 𝐵
𝑁 𝐴 + 𝑁 𝐵
𝑧 =
𝐶𝑜𝑛𝑣 𝐵 − 𝐶𝑜𝑛𝑣(𝐴)
𝑟 ∗ 1 − 𝑟 ∗ (
1
𝑁 𝐴
+
1
𝑁(𝐵)
)
Sample size matters
How big are the samples?
Frequentist A/B: sample size
 p1 = baseline conversion rate (15%), p2 = p1 + expected lift = 15+10 = 25%
 Significance = 0,05 (usually) = α, 1-Power = β = 0.2
 Z – z-score from z table. We use α/2 for one sided test. For example, for
α=0,05 - z-score = 1,96.
 In python: z = scipy.stats.norm.ppf(1-alpha/2)
Solution 2: Bayesian A/B testing
P-values, statistical significance?
Solution 2: Bayesian A/B testing
 Same experiment
 Different approach -> different interpretation.
 Sometimes it’s easier to explain P(B>A) than some magical statistical
significance, no need of p-value peaking.
Statistical difference
Sample size matters
Sample size matters
Probability? How it’s made?
Bayesian A/B: How it’s made
 We want to calculate P(A) and P(B), what is the probability of the conversion rate
we are seeing in groups A and B? P(B>A)?
 Prior: the conversion rate of the A and B can be any rate between 0% and 100%,
with equal chance.
 But we have some data from the experiment!
 H here is the conversion rate we are seeing for some group. D – given data.
 Prior: there is a niche debate about the importance of choosing a prior in
Bayesian A/B testing. In industry most common prior is B(1,1)
𝑃(𝐻/𝐷) =
𝑃 𝐷/𝐻 ∗ 𝑃(𝐻)
𝑃(𝐷)
𝑃 𝐻/𝐷 = 𝐵𝑒𝑡𝑎(𝛼 + 𝑠𝑢𝑐𝑐𝑒𝑠𝑠, 𝛽 + 𝑓𝑎𝑖𝑙𝑢𝑟𝑒𝑠)
Bayesian A/B: How it’s made
 P(B>A)?
 Monte Carlo method
 Get A and B Beta distributions
 Sample from them many times
 Get the %, when B>A -> estimation of P(B) > P(A)
Probability to be Best
Sample size? How to make the final decision?
Sample size
 Different experiment stopping point – more about risk estimation,
sample size doesn’t have to be pre-defined
 Often lead to faster and more interpretable experiments
Bayesian A/B: Expected loss and gain
 We are choosing B over A, but it happens, that A was better
 What is our Expected loss (in units of conversion rate)?
𝐸 𝑙𝑜𝑠𝑠 = ෍ 𝑃 𝑙𝑜𝑠𝑠 ∗ 𝑋 𝑙𝑜𝑠𝑠 = ෍ 𝑃 𝐴 > 𝐵 ∗ 𝑚𝑎𝑥 𝐶𝑜𝑛𝑣 𝐴 − 𝐶𝑜𝑛𝑣 𝐵 , 0
𝐸 𝑔𝑎𝑖𝑛 = ෍ 𝑃 𝑔𝑎𝑖𝑛 ∗ 𝑋 𝑔𝑎𝑖𝑛 = ෍ 𝑃 𝐵 > 𝐴 ∗ 𝑚𝑎𝑥 𝐶𝑜𝑛𝑣 𝐵 − 𝐶𝑜𝑛𝑣 𝐴 , 0
 Expected loss < some threshold we don’t care
 Also look at the expected gain to compare
Sample size matters
Bayesian downsides
 Theoretical difficulties and debates
 Computational expensive
 Frequentist approach is huge in industry
What if?
 More groups?
 Different split ratio?
 ?
 ?
 Check links 
 Multi armed bandits (from Reinforcement Learning)
 https://youtu.be/HyQ2AZlavr0 - Andrii Belas: Turning machine learning models into stuff that
actually helps people and makes money
 https://docs.microsoft.com/en-us/azure/machine-learning/team-data-science-process/ - Team
Data Science Process
 https://www.datacamp.com/courses/customer-analytics-and-ab-testing-in-python - good intro
course
 https://www.evanmiller.org/ab-testing/ - online A/B testing tools
 https://ecommerce-in-ukraine.blogspot.com/2018/07/ab-ab.html - nice blogpost about sequential
ab testing
 https://www.udacity.com/course/ab-testing--ud257 - great advanced course
 https://www.amazon.com/Practical-Statistics-Data-Scientists-Essential/dp/149207294X - good book
about practical stats.
 https://marketing.dynamicyield.com/bayesian-calculator/ - Bayesian A/B online tool
Useful links
Q&A

Andrii Belas: A/B testing overview: use-cases, theory and tools

  • 1.
    A/B testing overview:use-cases, approaches and tools Andrii Belas Head of Data Science First Ukrainian International Bank
  • 2.
    What about topic For Data Scientists, ML Engineers and Product Managers  Entry Level – general overview to jump into the topic, not a deep dive for experts (but maybe some of the parts will be useful as well)  Topic is very important for almost every Data Science project, but a lot of courses and tutorials try to make it very complicated, so a lot of aspiring practitioners do not know where to start, or just afraid to start at all.  We will cover use-cases, approaches and tools 
  • 3.
    Andrii Belas, HeadOf Data Science, FUIB  PhD candidate (IASA KPI)  2015-2016: Junior Data Scientist – SAS Institute Inc  2016-2019: Data Scientist – SMART business  2019: Data Science Lead – uData  2019-2020: Senior Data Scientist – SoftServe  2020-present: FUIB  Creator of the Incrypto, Data Science for Business  Public speaker, mentor
  • 5.
  • 6.
    Use-case: VseCard Productoffering  We want to recommend our product VseCard – to some group of customers.  We already know, that nobody cares about accuracy of our model, if we are designing project properly, we should care about business impact  So, we decided, that conversion rate will be our main product metric. We can call 2000 (for example) customers per month, so we want to maximize our conversion rate.
  • 7.
    Team Data ScienceProcess Source: Microsoft
  • 8.
    Use-case: VseCard Productoffering  Problem: how to test our solution?  We can not use the history, because if we didn’t recommend anything to that client, we don’t know his possible reactions, so using backtest we can confirm only positive cases
  • 9.
  • 10.
  • 11.
    It’s time forsome tools 
  • 12.
    How long doesit take?
  • 13.
    Period  Period: usuallydriven by business, for our example it will be 2 months (1 for calls, 1 for product opening). If not provided, for classical business scenarios I recommend duration to be at least 2 weeks, or even better 1 month to capture possible weekday/payday factors, holidays and novelty effects/change aversion.
  • 14.
    How big arethe samples?
  • 15.
    Sample sizes  Samplesize: can be also made by business (like in our example), or you can use some scientific tools as well  Baseline conversion rate – typical conversion rate for current approach  Expected lift – can be driven by business, when project potential outcome was estimated (ROI), or we can use A/A test to help us a little bit (will be covered later). It also often called minimum detectable change.
  • 16.
    How big arethe samples?
  • 17.
    Can we stopthe experiment earlier?(p-value hack)
  • 18.
    Can we stopthe experiment earlier?(p-value hack)
  • 19.
  • 20.
    Split  General idea:we want to get representative sample. So we want to get to groups, that are similar to each other by all factors, except the our experiment.  Best practice: split randomly by user id no matter what.
  • 21.
    Are they reallythe same?
  • 22.
    My secret ruleto find difference between datasets  1. Create new column – group, label the data in both groups accordingly  2. Train simple ML model (I like Random Forests), on dataset features, with group as target  3. Check out model performance  4. Check out feature importances
  • 23.
  • 24.
    A/B test hypothesissummary  If we replace X with Y for <specific> users on <time period>, then metrics <a,b,c> will <increase/decrease> <and metrics p,q (invariants) will not change>
  • 25.
  • 26.
    A/A test  Oftenused for testing A/B testing framework (sampling/splitting schema, analytics engine…).  Idea: create two groups, like in A/B, but they both receive the same experience  You should not observe any statistical difference  Can be also useful trick to find lift for high variance/sensitive metrics
  • 27.
  • 28.
    Solution 1: FrequentistA/B testing  H0: A and B have the same behavior, no significant difference, H1: there is the difference between groups  Type 1 error: there is no difference (H0=True), but we said that there is difference. Significance – P(err1) = 0,05 (usually) = α. Or sometimes P(not err1) = confidence level = 0,95 is used  Type 2 error: there is the difference, but we said there is no. So probability to find the difference, where there is the one = Power = P(not err 2) = 0,8. 1-Power = β
  • 29.
  • 30.
    Frequentist A/B: significantdifference  P-value – probability of seeing the result (our change or greater) by random chance (there is no difference between groups – H0)  P-value – from z-score table. Typically, we want p-value<0.05  In python: p_value = scipy.stats.norm.sf(abs(z)), or x2 for two-sided 𝑟 = 𝑆𝑢𝑐𝑐𝑒𝑠𝑠 𝐴 + 𝑆𝑢𝑐𝑐𝑒𝑠𝑠 𝐵 𝑁 𝐴 + 𝑁 𝐵 𝑧 = 𝐶𝑜𝑛𝑣 𝐵 − 𝐶𝑜𝑛𝑣(𝐴) 𝑟 ∗ 1 − 𝑟 ∗ ( 1 𝑁 𝐴 + 1 𝑁(𝐵) )
  • 31.
  • 32.
    How big arethe samples?
  • 33.
    Frequentist A/B: samplesize  p1 = baseline conversion rate (15%), p2 = p1 + expected lift = 15+10 = 25%  Significance = 0,05 (usually) = α, 1-Power = β = 0.2  Z – z-score from z table. We use α/2 for one sided test. For example, for α=0,05 - z-score = 1,96.  In python: z = scipy.stats.norm.ppf(1-alpha/2)
  • 34.
  • 35.
  • 36.
    Solution 2: BayesianA/B testing  Same experiment  Different approach -> different interpretation.  Sometimes it’s easier to explain P(B>A) than some magical statistical significance, no need of p-value peaking.
  • 37.
  • 38.
  • 39.
  • 40.
  • 41.
  • 42.
    Bayesian A/B: Howit’s made  We want to calculate P(A) and P(B), what is the probability of the conversion rate we are seeing in groups A and B? P(B>A)?  Prior: the conversion rate of the A and B can be any rate between 0% and 100%, with equal chance.  But we have some data from the experiment!  H here is the conversion rate we are seeing for some group. D – given data.  Prior: there is a niche debate about the importance of choosing a prior in Bayesian A/B testing. In industry most common prior is B(1,1) 𝑃(𝐻/𝐷) = 𝑃 𝐷/𝐻 ∗ 𝑃(𝐻) 𝑃(𝐷) 𝑃 𝐻/𝐷 = 𝐵𝑒𝑡𝑎(𝛼 + 𝑠𝑢𝑐𝑐𝑒𝑠𝑠, 𝛽 + 𝑓𝑎𝑖𝑙𝑢𝑟𝑒𝑠)
  • 43.
    Bayesian A/B: Howit’s made
  • 44.
    Bayesian A/B: Howit’s made  P(B>A)?  Monte Carlo method  Get A and B Beta distributions  Sample from them many times  Get the %, when B>A -> estimation of P(B) > P(A)
  • 45.
  • 46.
    Sample size? Howto make the final decision?
  • 47.
    Sample size  Differentexperiment stopping point – more about risk estimation, sample size doesn’t have to be pre-defined  Often lead to faster and more interpretable experiments
  • 48.
    Bayesian A/B: Expectedloss and gain  We are choosing B over A, but it happens, that A was better  What is our Expected loss (in units of conversion rate)? 𝐸 𝑙𝑜𝑠𝑠 = ෍ 𝑃 𝑙𝑜𝑠𝑠 ∗ 𝑋 𝑙𝑜𝑠𝑠 = ෍ 𝑃 𝐴 > 𝐵 ∗ 𝑚𝑎𝑥 𝐶𝑜𝑛𝑣 𝐴 − 𝐶𝑜𝑛𝑣 𝐵 , 0 𝐸 𝑔𝑎𝑖𝑛 = ෍ 𝑃 𝑔𝑎𝑖𝑛 ∗ 𝑋 𝑔𝑎𝑖𝑛 = ෍ 𝑃 𝐵 > 𝐴 ∗ 𝑚𝑎𝑥 𝐶𝑜𝑛𝑣 𝐵 − 𝐶𝑜𝑛𝑣 𝐴 , 0  Expected loss < some threshold we don’t care  Also look at the expected gain to compare
  • 49.
  • 50.
    Bayesian downsides  Theoreticaldifficulties and debates  Computational expensive  Frequentist approach is huge in industry
  • 51.
    What if?  Moregroups?  Different split ratio?  ?  ?  Check links   Multi armed bandits (from Reinforcement Learning)
  • 52.
     https://youtu.be/HyQ2AZlavr0 -Andrii Belas: Turning machine learning models into stuff that actually helps people and makes money  https://docs.microsoft.com/en-us/azure/machine-learning/team-data-science-process/ - Team Data Science Process  https://www.datacamp.com/courses/customer-analytics-and-ab-testing-in-python - good intro course  https://www.evanmiller.org/ab-testing/ - online A/B testing tools  https://ecommerce-in-ukraine.blogspot.com/2018/07/ab-ab.html - nice blogpost about sequential ab testing  https://www.udacity.com/course/ab-testing--ud257 - great advanced course  https://www.amazon.com/Practical-Statistics-Data-Scientists-Essential/dp/149207294X - good book about practical stats.  https://marketing.dynamicyield.com/bayesian-calculator/ - Bayesian A/B online tool Useful links
  • 53.