Downloaded 36 times


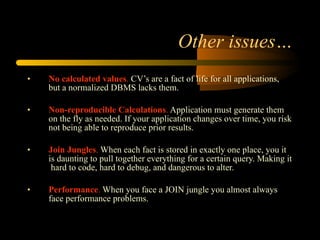
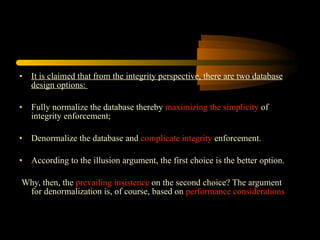
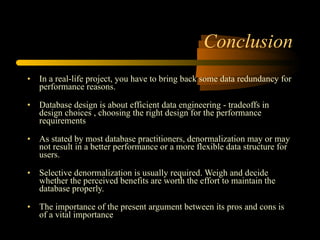
![References [1] G. Lawrence Sanders & Seung kyoon Shin , Denormalization Effects on Performance of RDBMS, Proceedings of the 34th Hawaii International Conference on System Sciences, 2001. [2] Denormalization strategies for data retrieval from data warehouses, Seung Kyoon Shina,*, G. Lawrence Sandersb,1a [3] Marsha Hanus, To Normalize or Denormalize, That is the Question, Candle Corporation [4] Denormalization Guidelines by Craig S. Mullins Published: PLATINUM technology, inc. June 1, 1997 [5] Douglas B. Bock and John F. Schrage, Department of Computer Management and Information Systems, Southern Illinois University Edwardsville, published in the 1996 Proceedings of the Decision Sciences Institute, Orlando, Florida, November, 1996 [6] The Dangerous Illusion: Denormalization, Performance and Integrity, Part 1 and Part 2, - Fabian Pascal , DM Review Magazine, July 2002 [7] Service-Oriented Data Denormalization for Scalable Web Applications, Zhou Wei (Tsinghua University Beijing, China), Jiang Dejun (Tsinghua University), Guillaume Pierre (Vrije Universiteit Amsterdam), Chi-Hung Chi (Tsinghua Univers), Maarten van Steen(Vrije Universiteit Amsterdam);April 21-25, 2008. Beijing, China [8] Understanding Normalisation, by Micheal J Hernandez, 2001-2003. [9] Hierarchical Denormalizing: A Possibility to Optimize the Data Warehouse Design By Morteza Zaker, Somnuk Phon-Amnuaisuk, Su-Cheng Haw [10] How Valuable is Planned Data Redundancy in Maintaining the Integrity of an Information System through its Database by Eghosa Ugboma , Florida Memorial University [11 ] Introduction to Databases, Database Design and SQL, Zornitsa Zaharieva, CERN [12] THE DATA ADMINISTRATION NEWSLETTER – TDAN.com](https://image.slidesharecdn.com/denormalisationproscons-12859945995172-phpapp02/85/When-amp-Why-s-of-Denormalization-50-320.jpg)

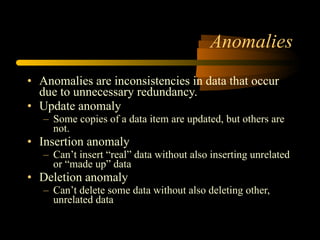
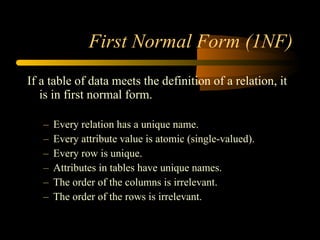
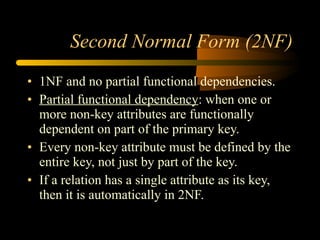
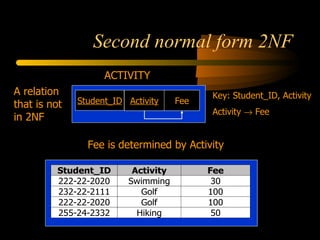
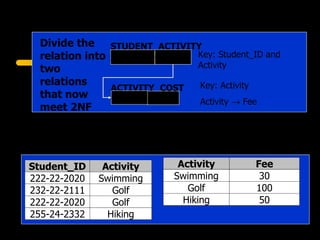
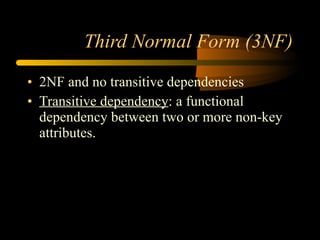
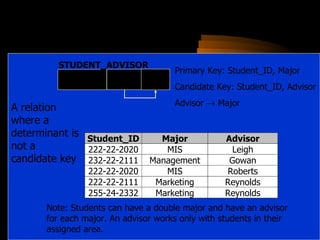
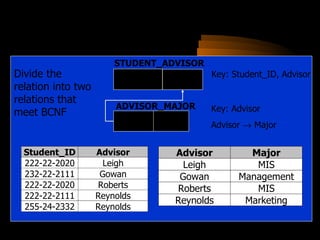
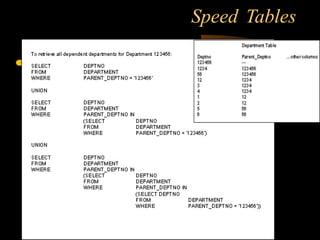
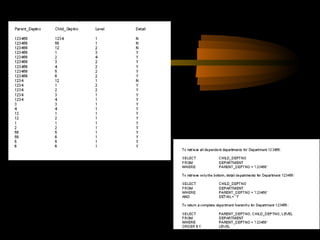

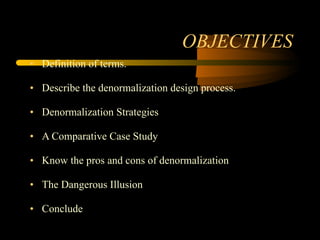
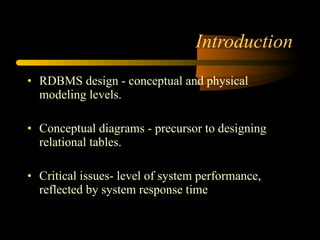
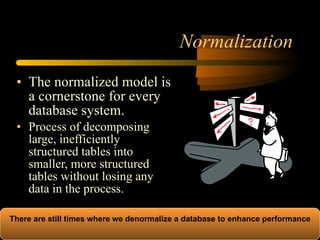
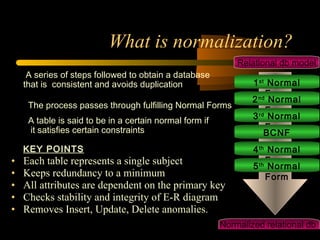
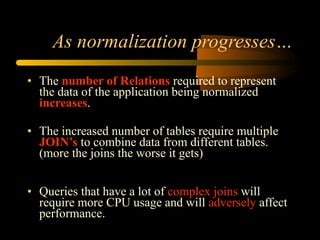
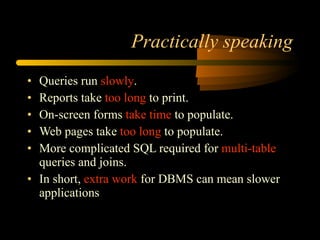
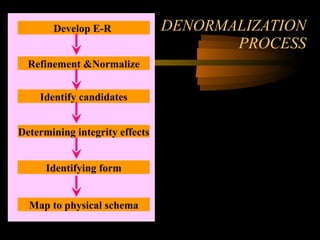
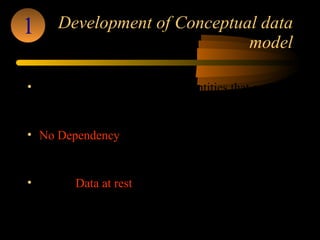
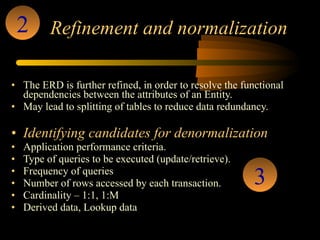
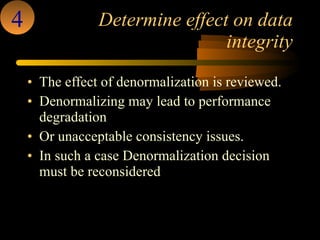
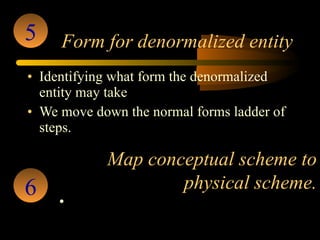
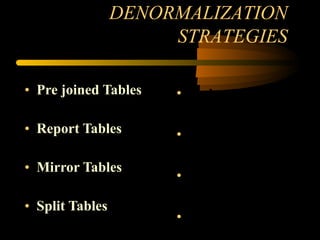
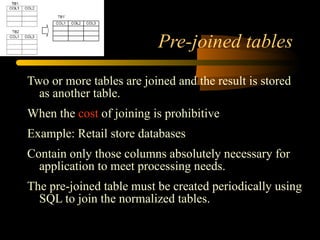
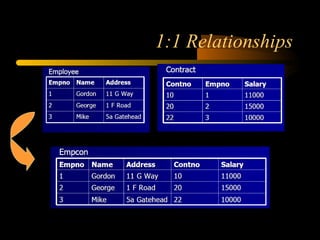
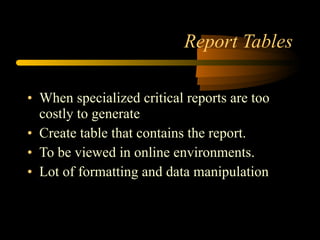
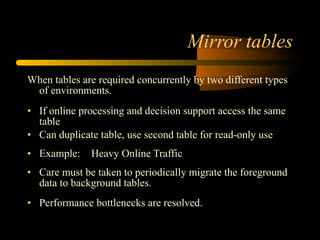
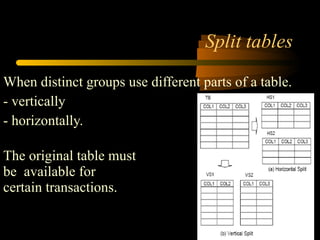
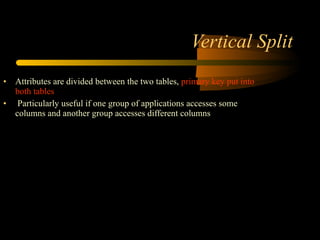
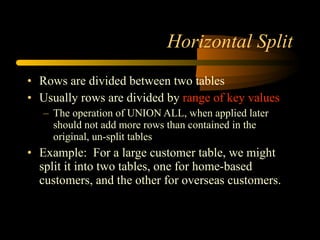
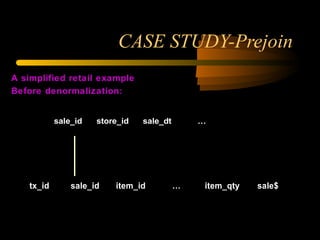
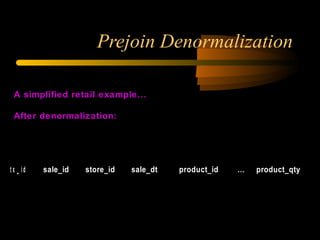
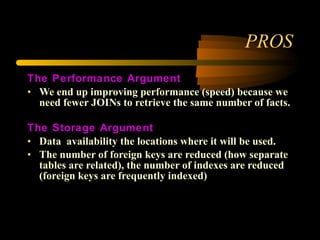
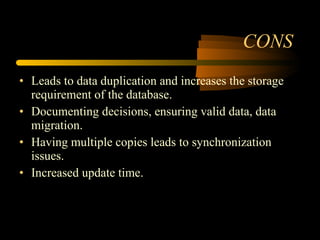
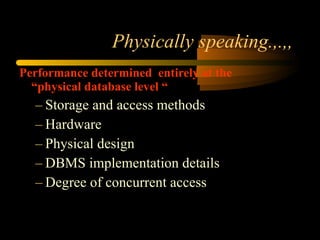
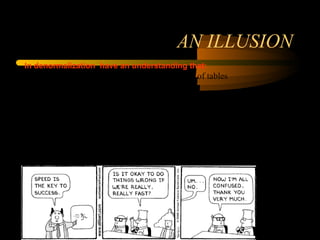
The document discusses denormalization in database design. It begins with an introduction to normalization and outlines the normal forms from 1NF to BCNF. It then describes the denormalization process and different denormalization strategies like pre-joined tables, report tables, mirror tables, and split tables. The document discusses the pros and cons of denormalization and emphasizes the need to weigh performance needs against data integrity. It concludes by stating that selective denormalization is often required to achieve efficient performance.


![Normalisation [Slides].pdf introduction language](https://cdn.slidesharecdn.com/ss_thumbnails/normalisationslides-241027214218-f965ea10-thumbnail.jpg?width=640&height=640&fit=bounds)