Download as PDF, PPTX


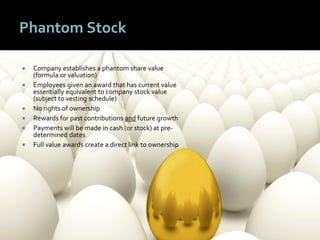


The document discusses phantom stock as a key strategy for businesses to enhance employee engagement and drive growth by creating an ownership mentality among team members. It identifies challenges CEOs face in talent acquisition and highlights the need for long-term value-sharing plans to attract and retain top talent effectively. The emphasis is on adapting compensation structures, like phantom stock options, to reflect employee contributions to company success without diluting ownership.


