Download as PDF, PPTX


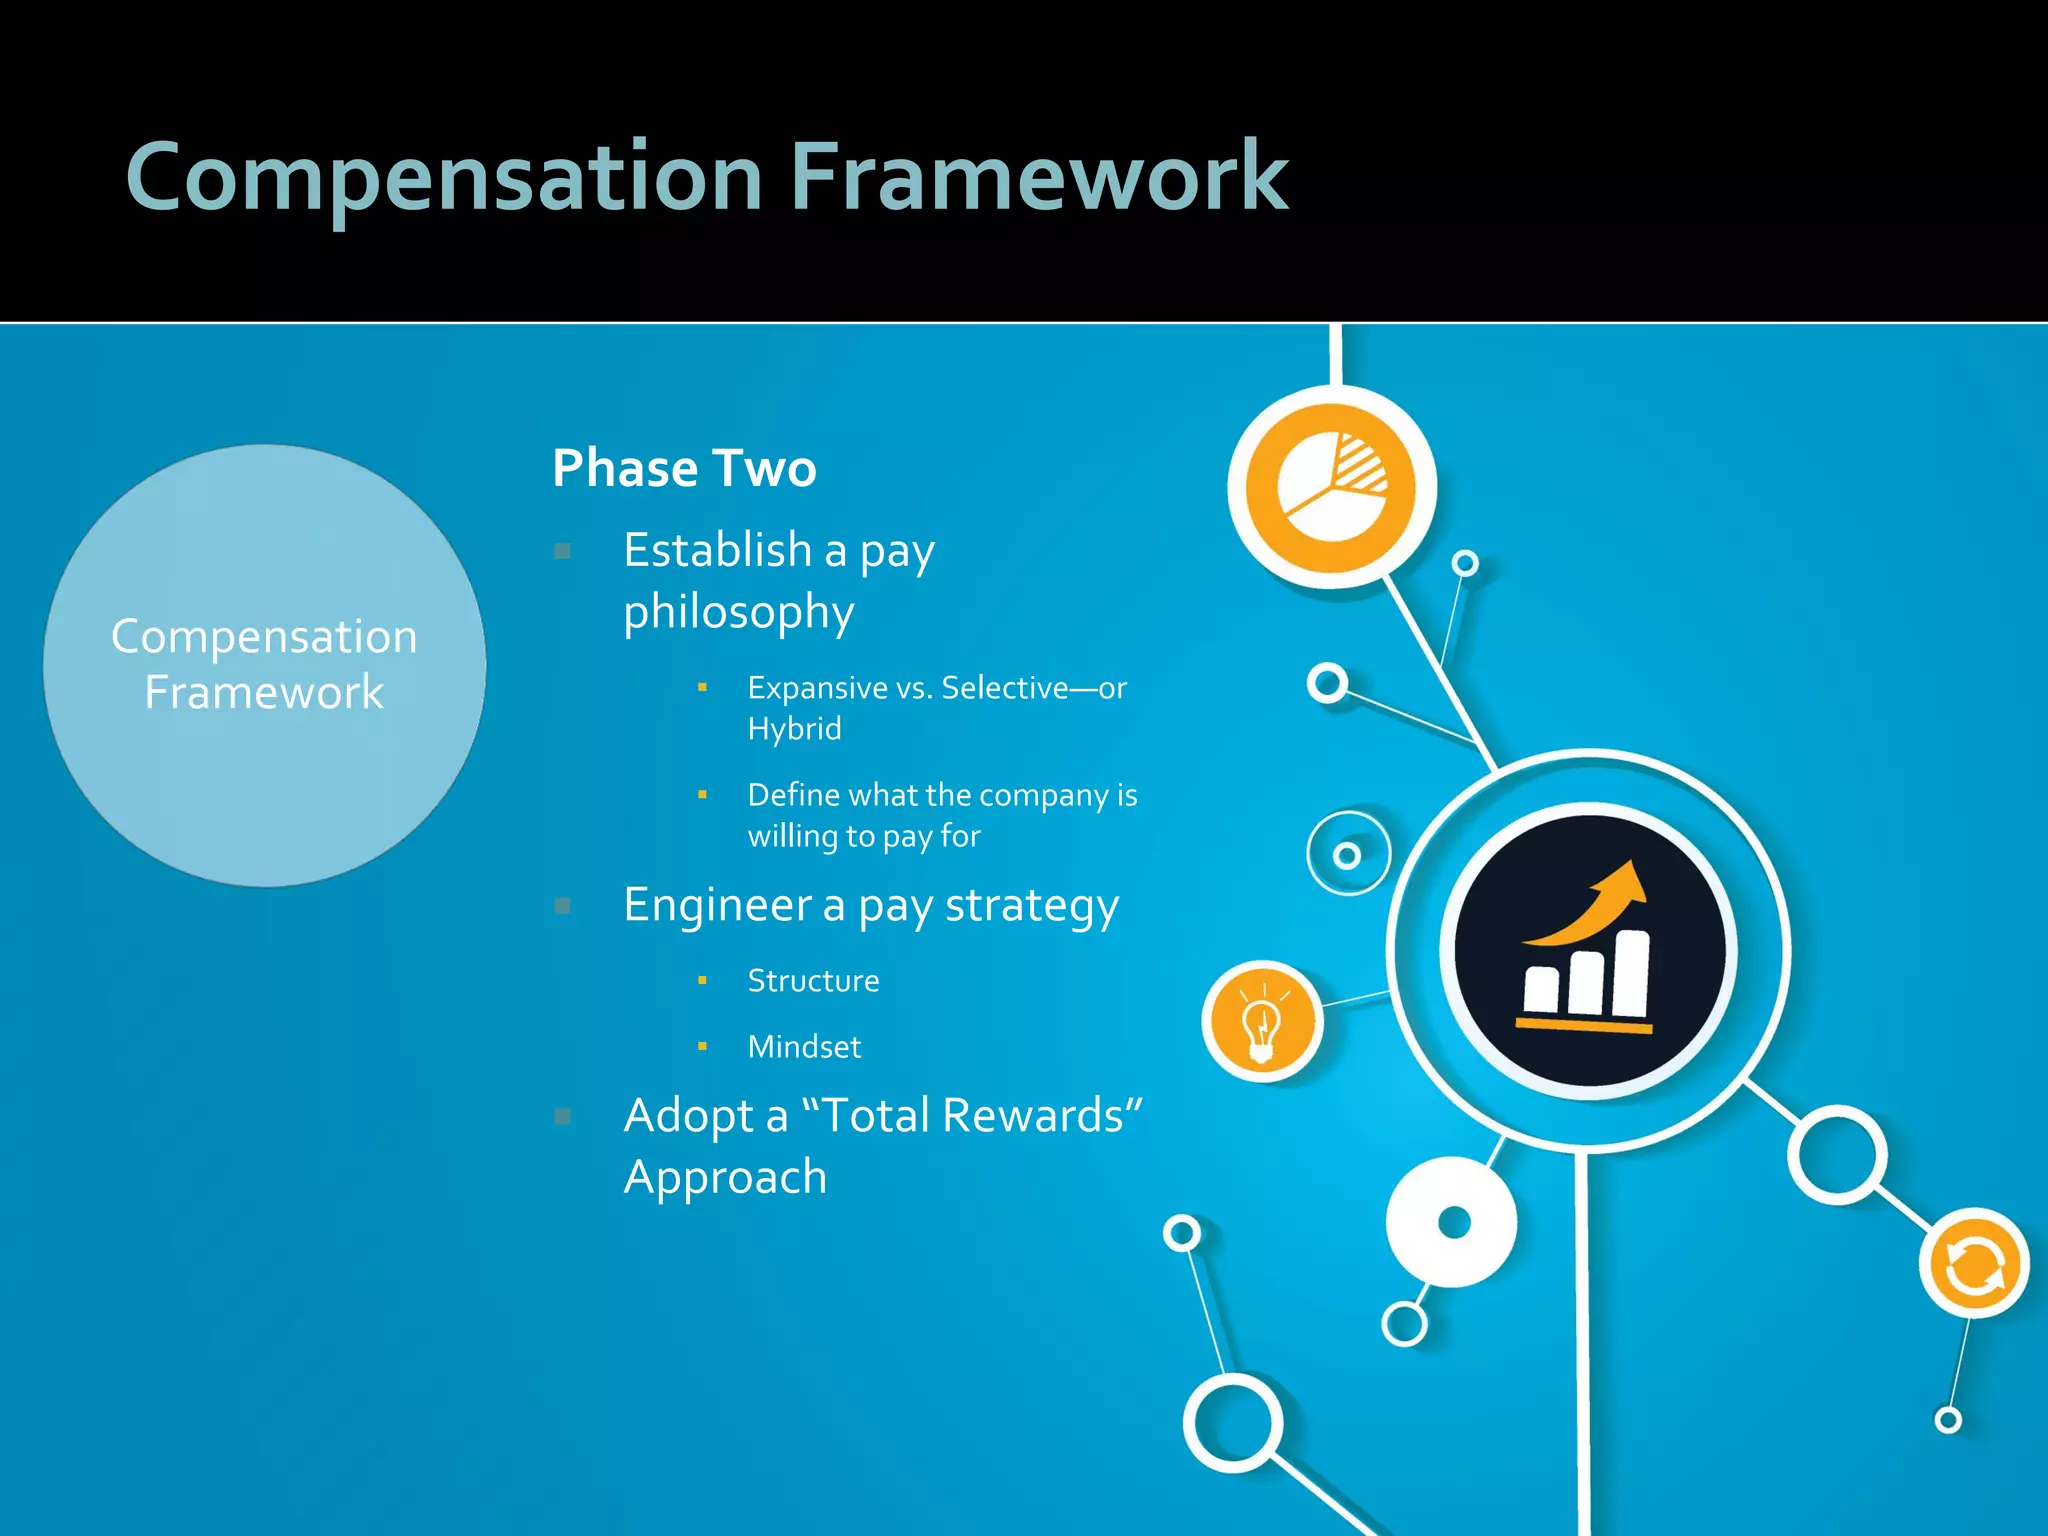
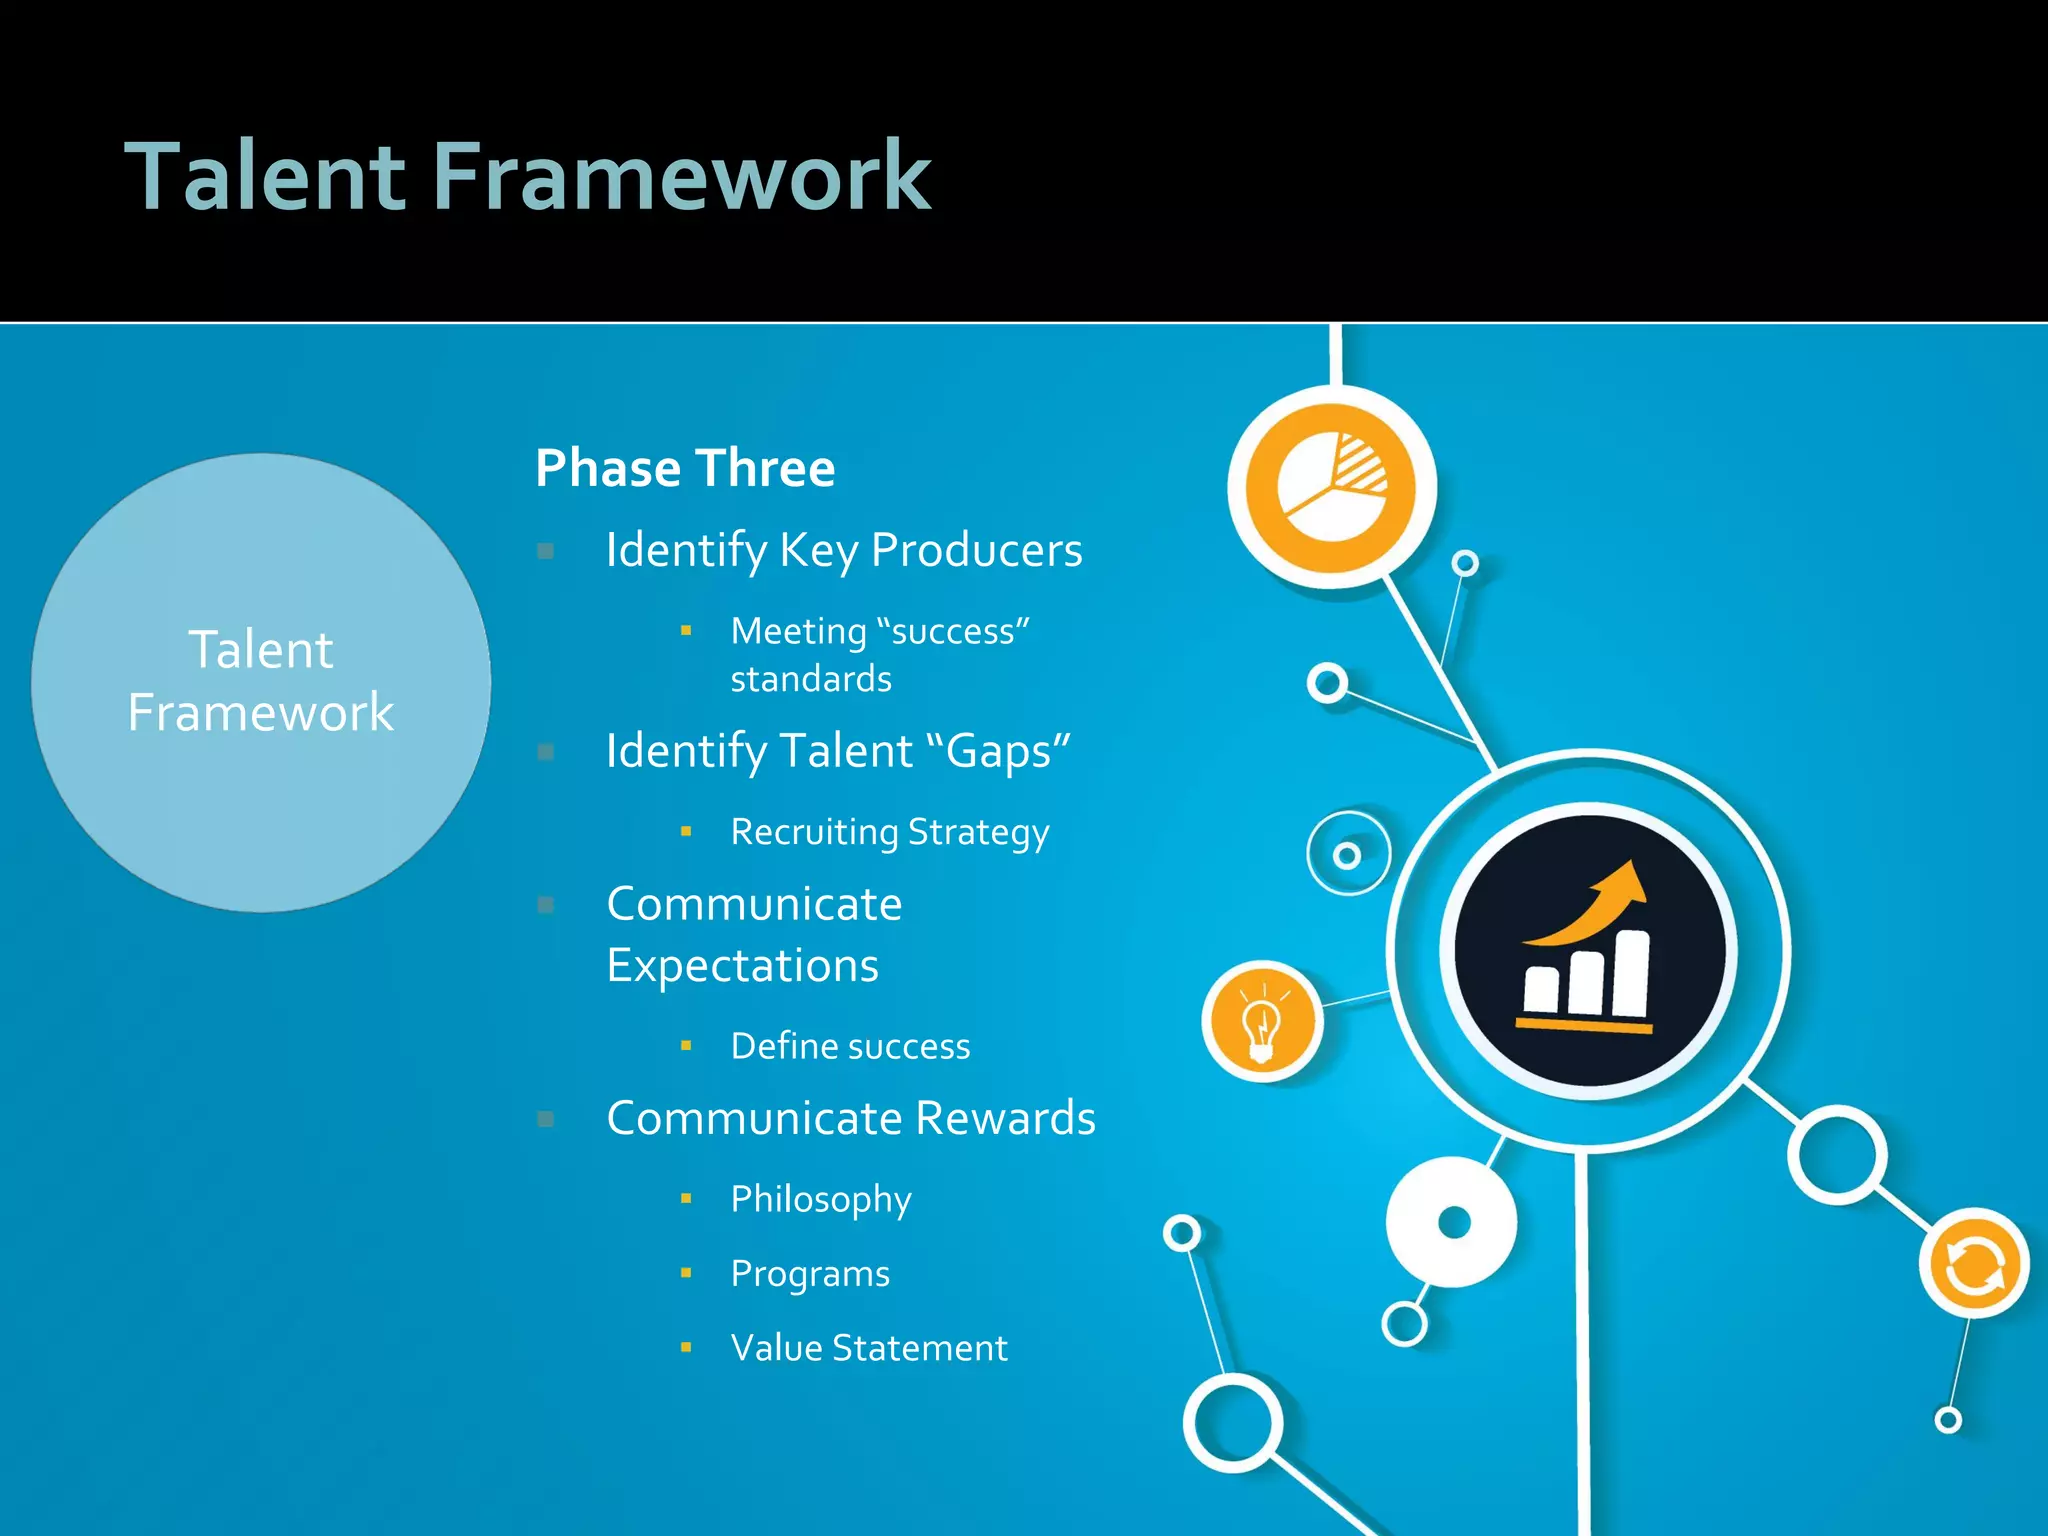


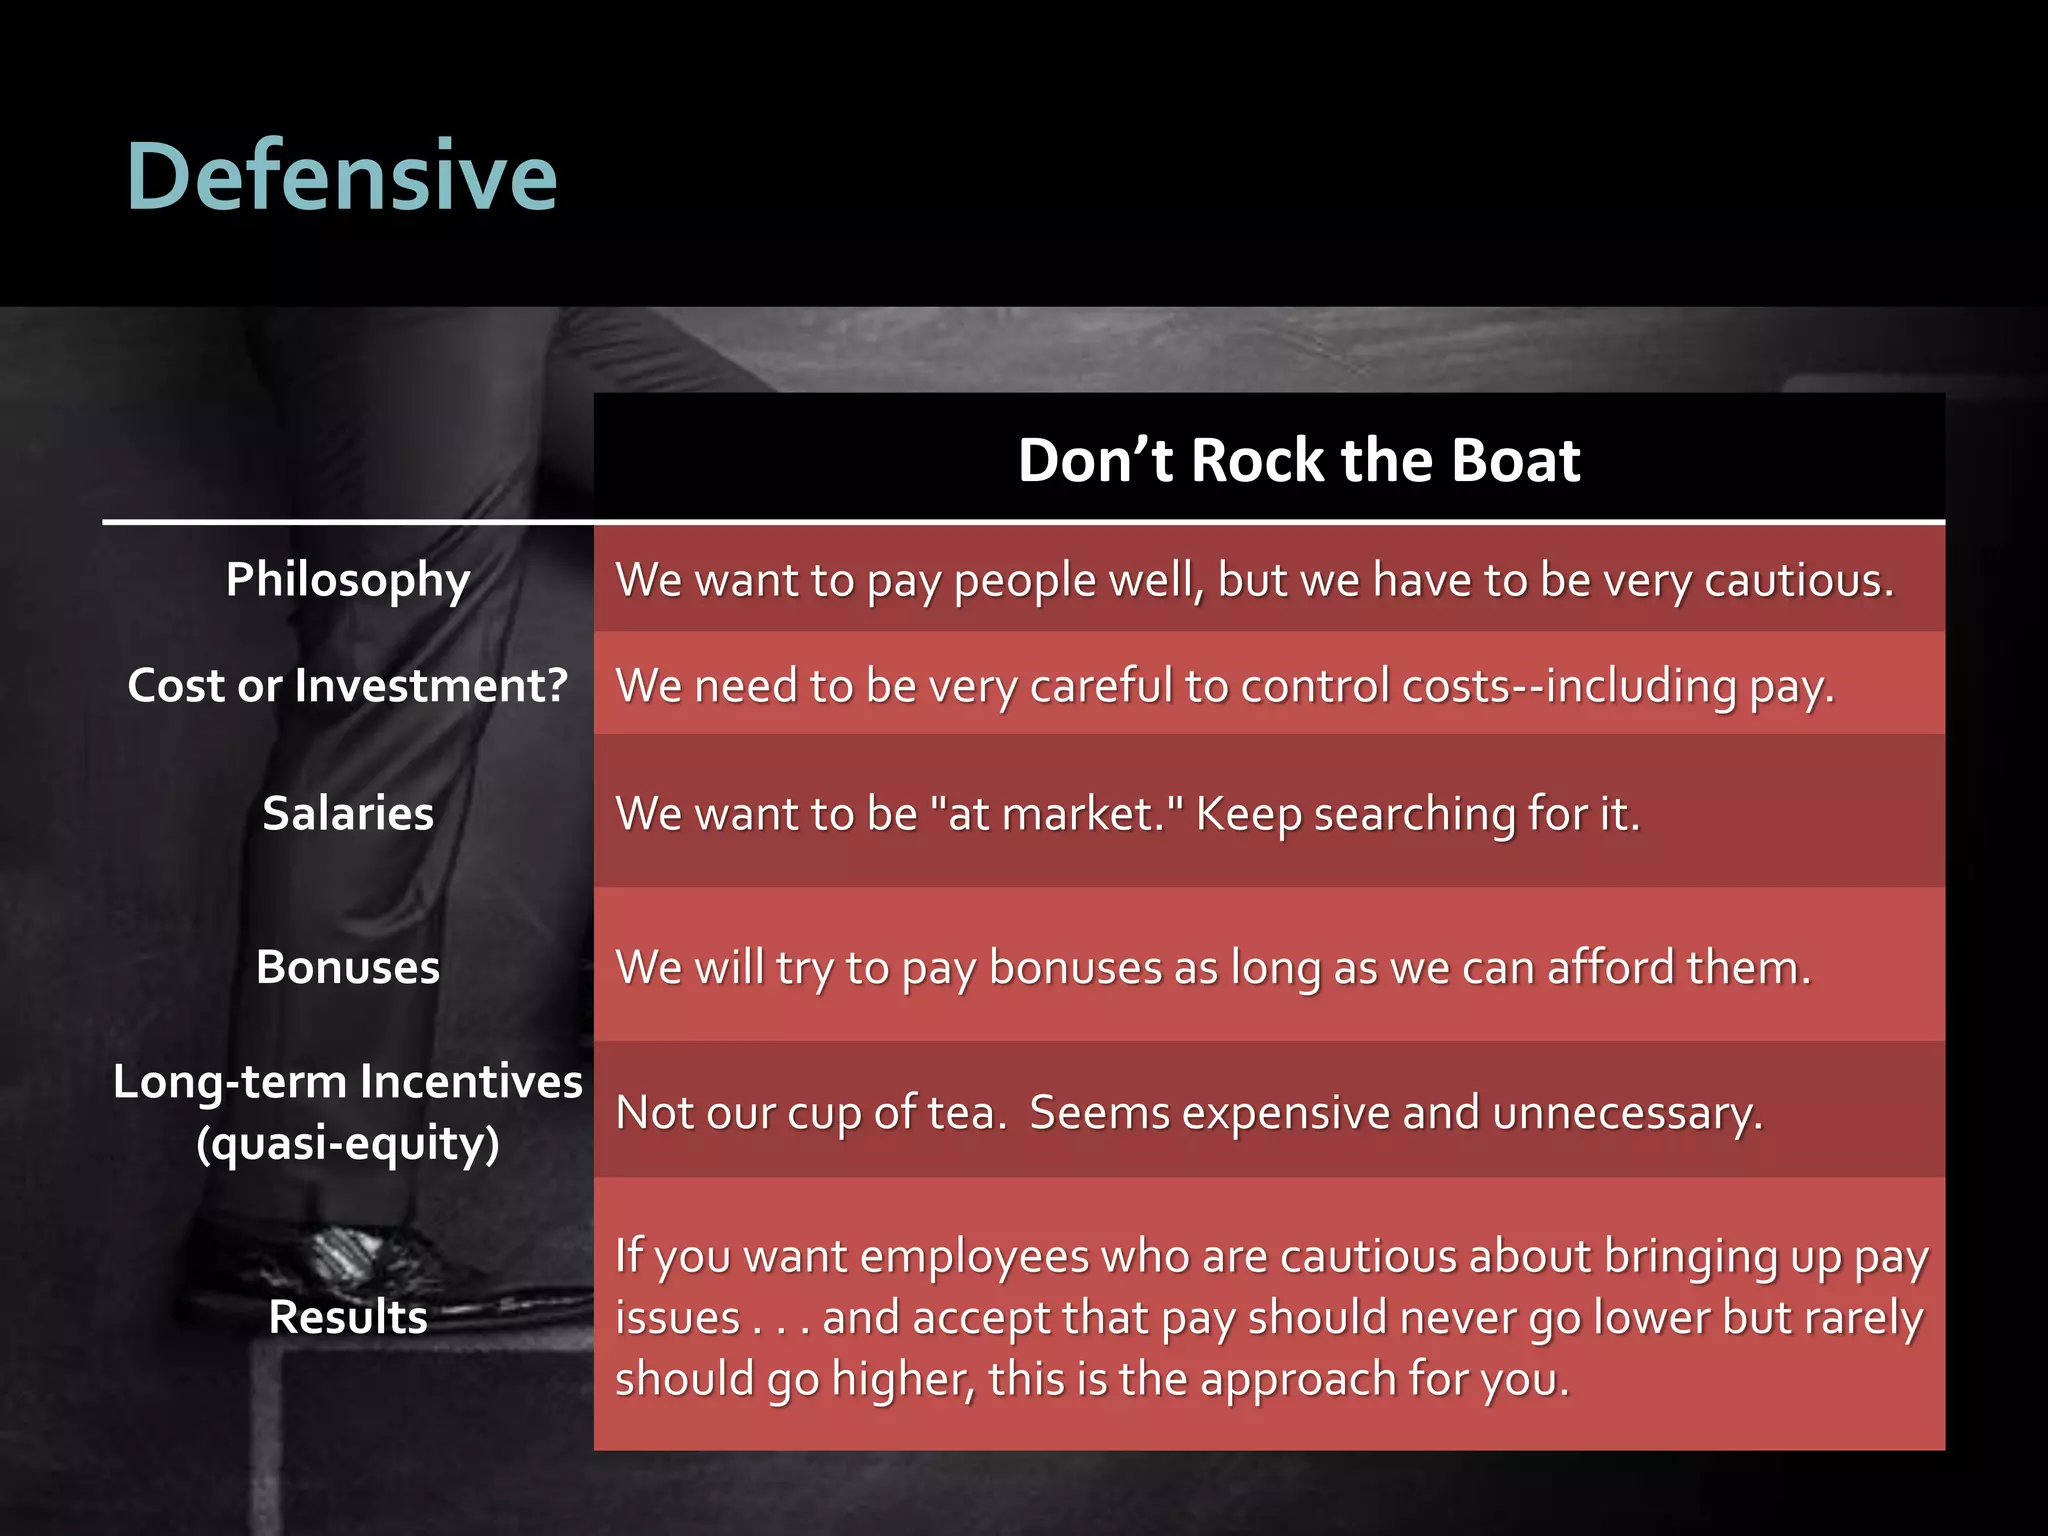

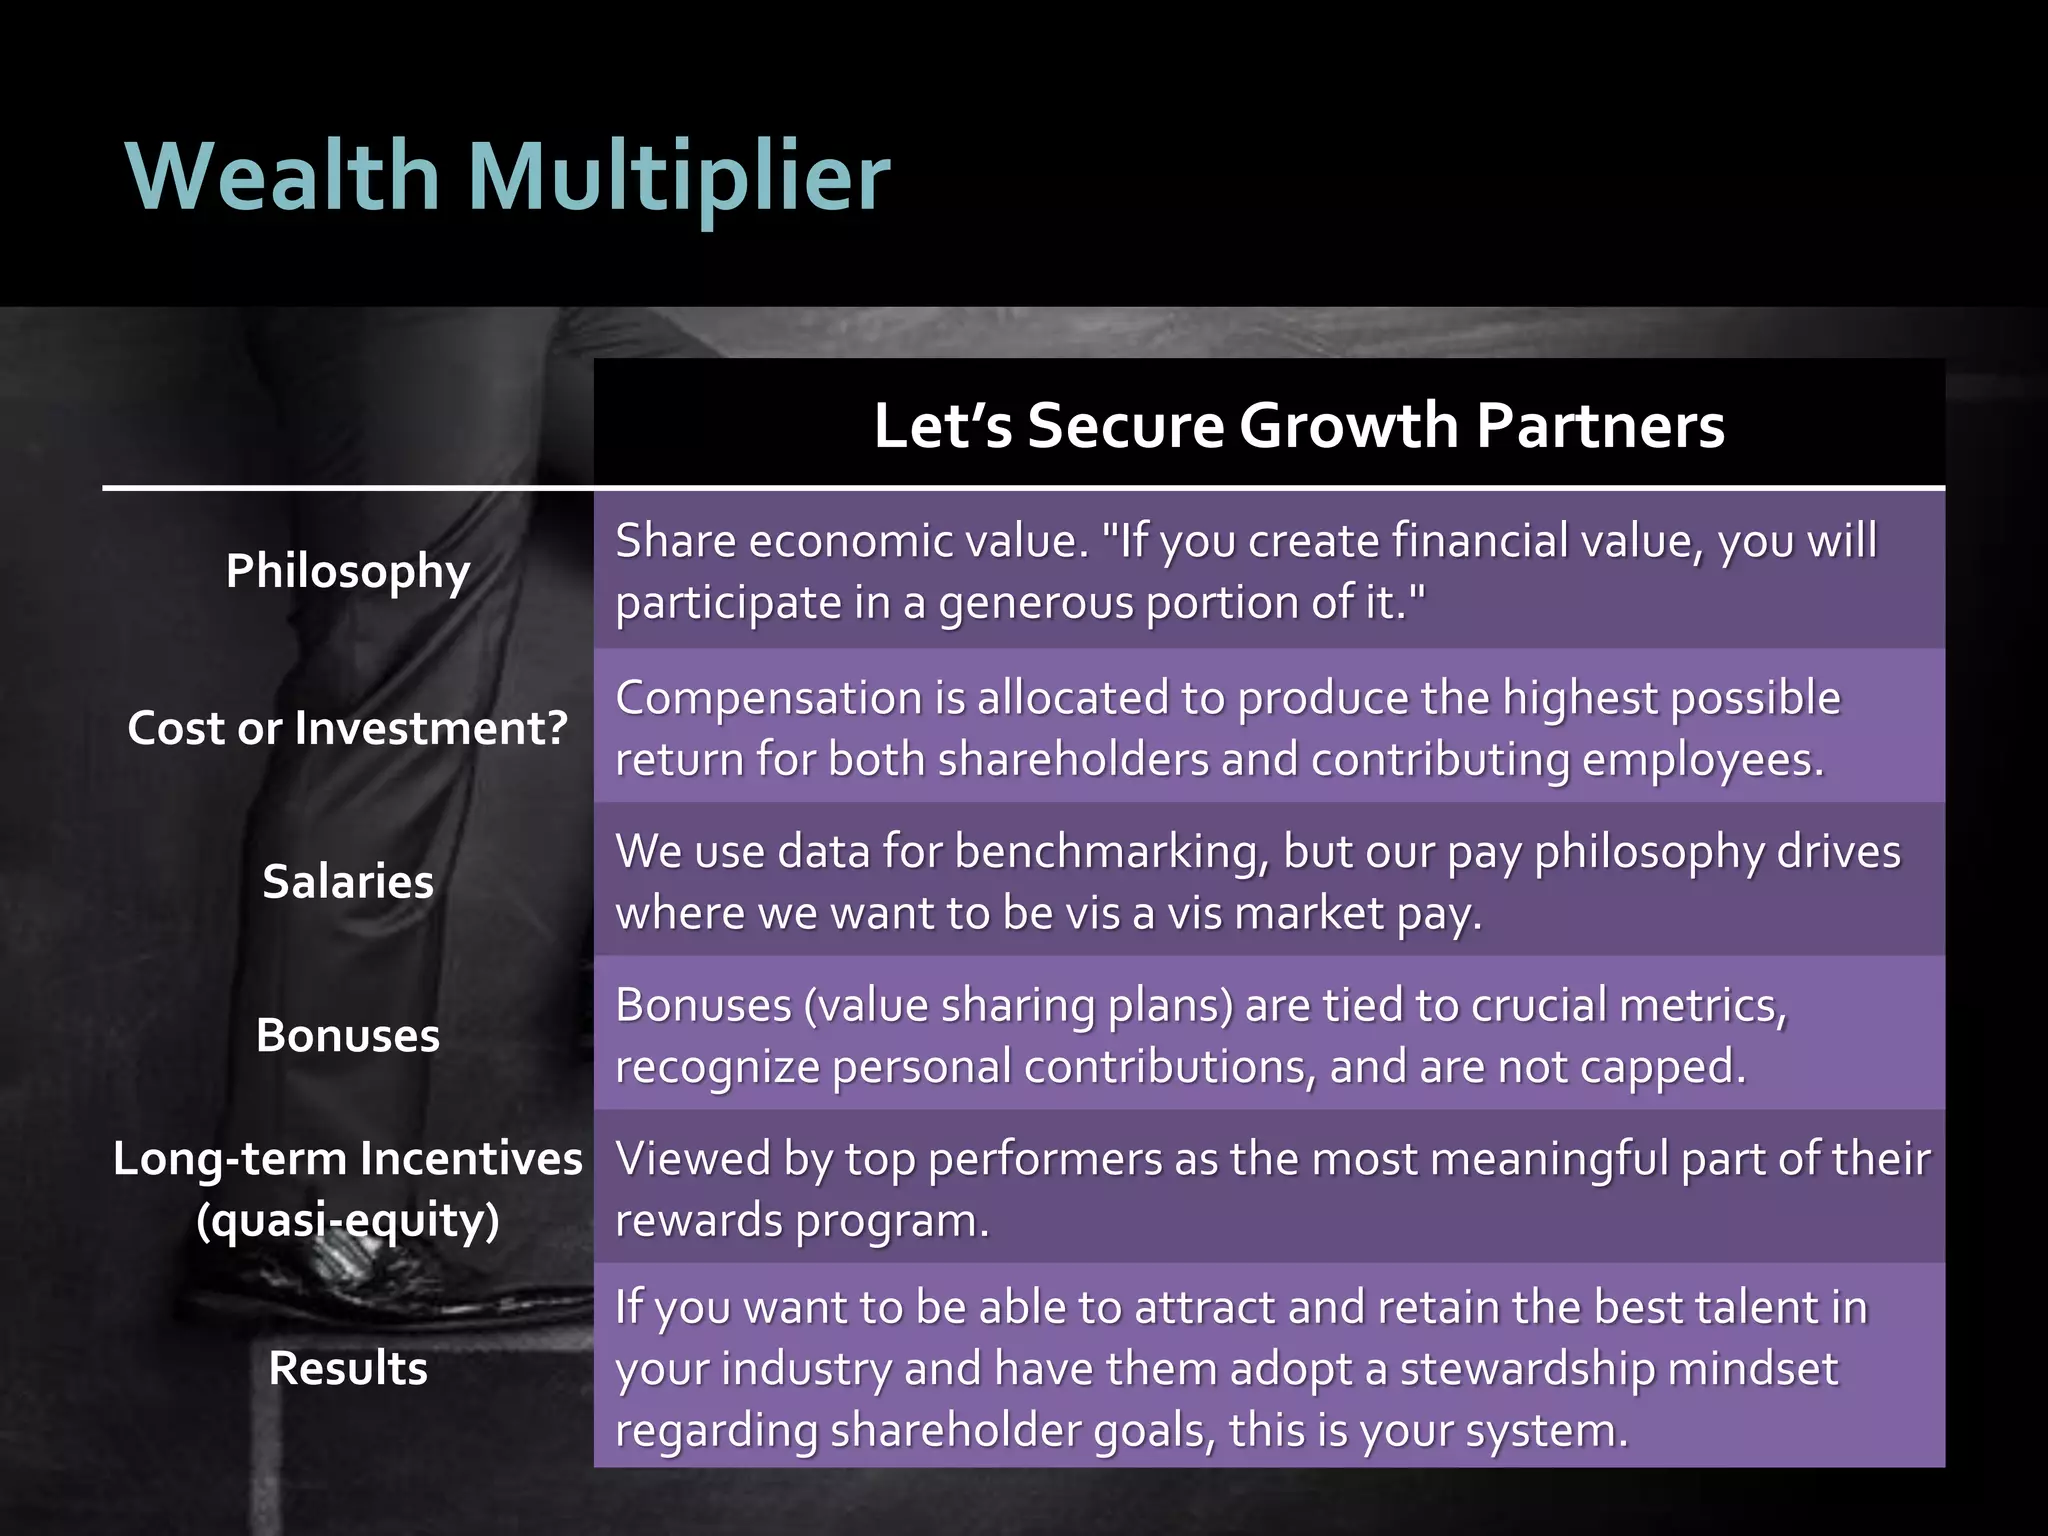


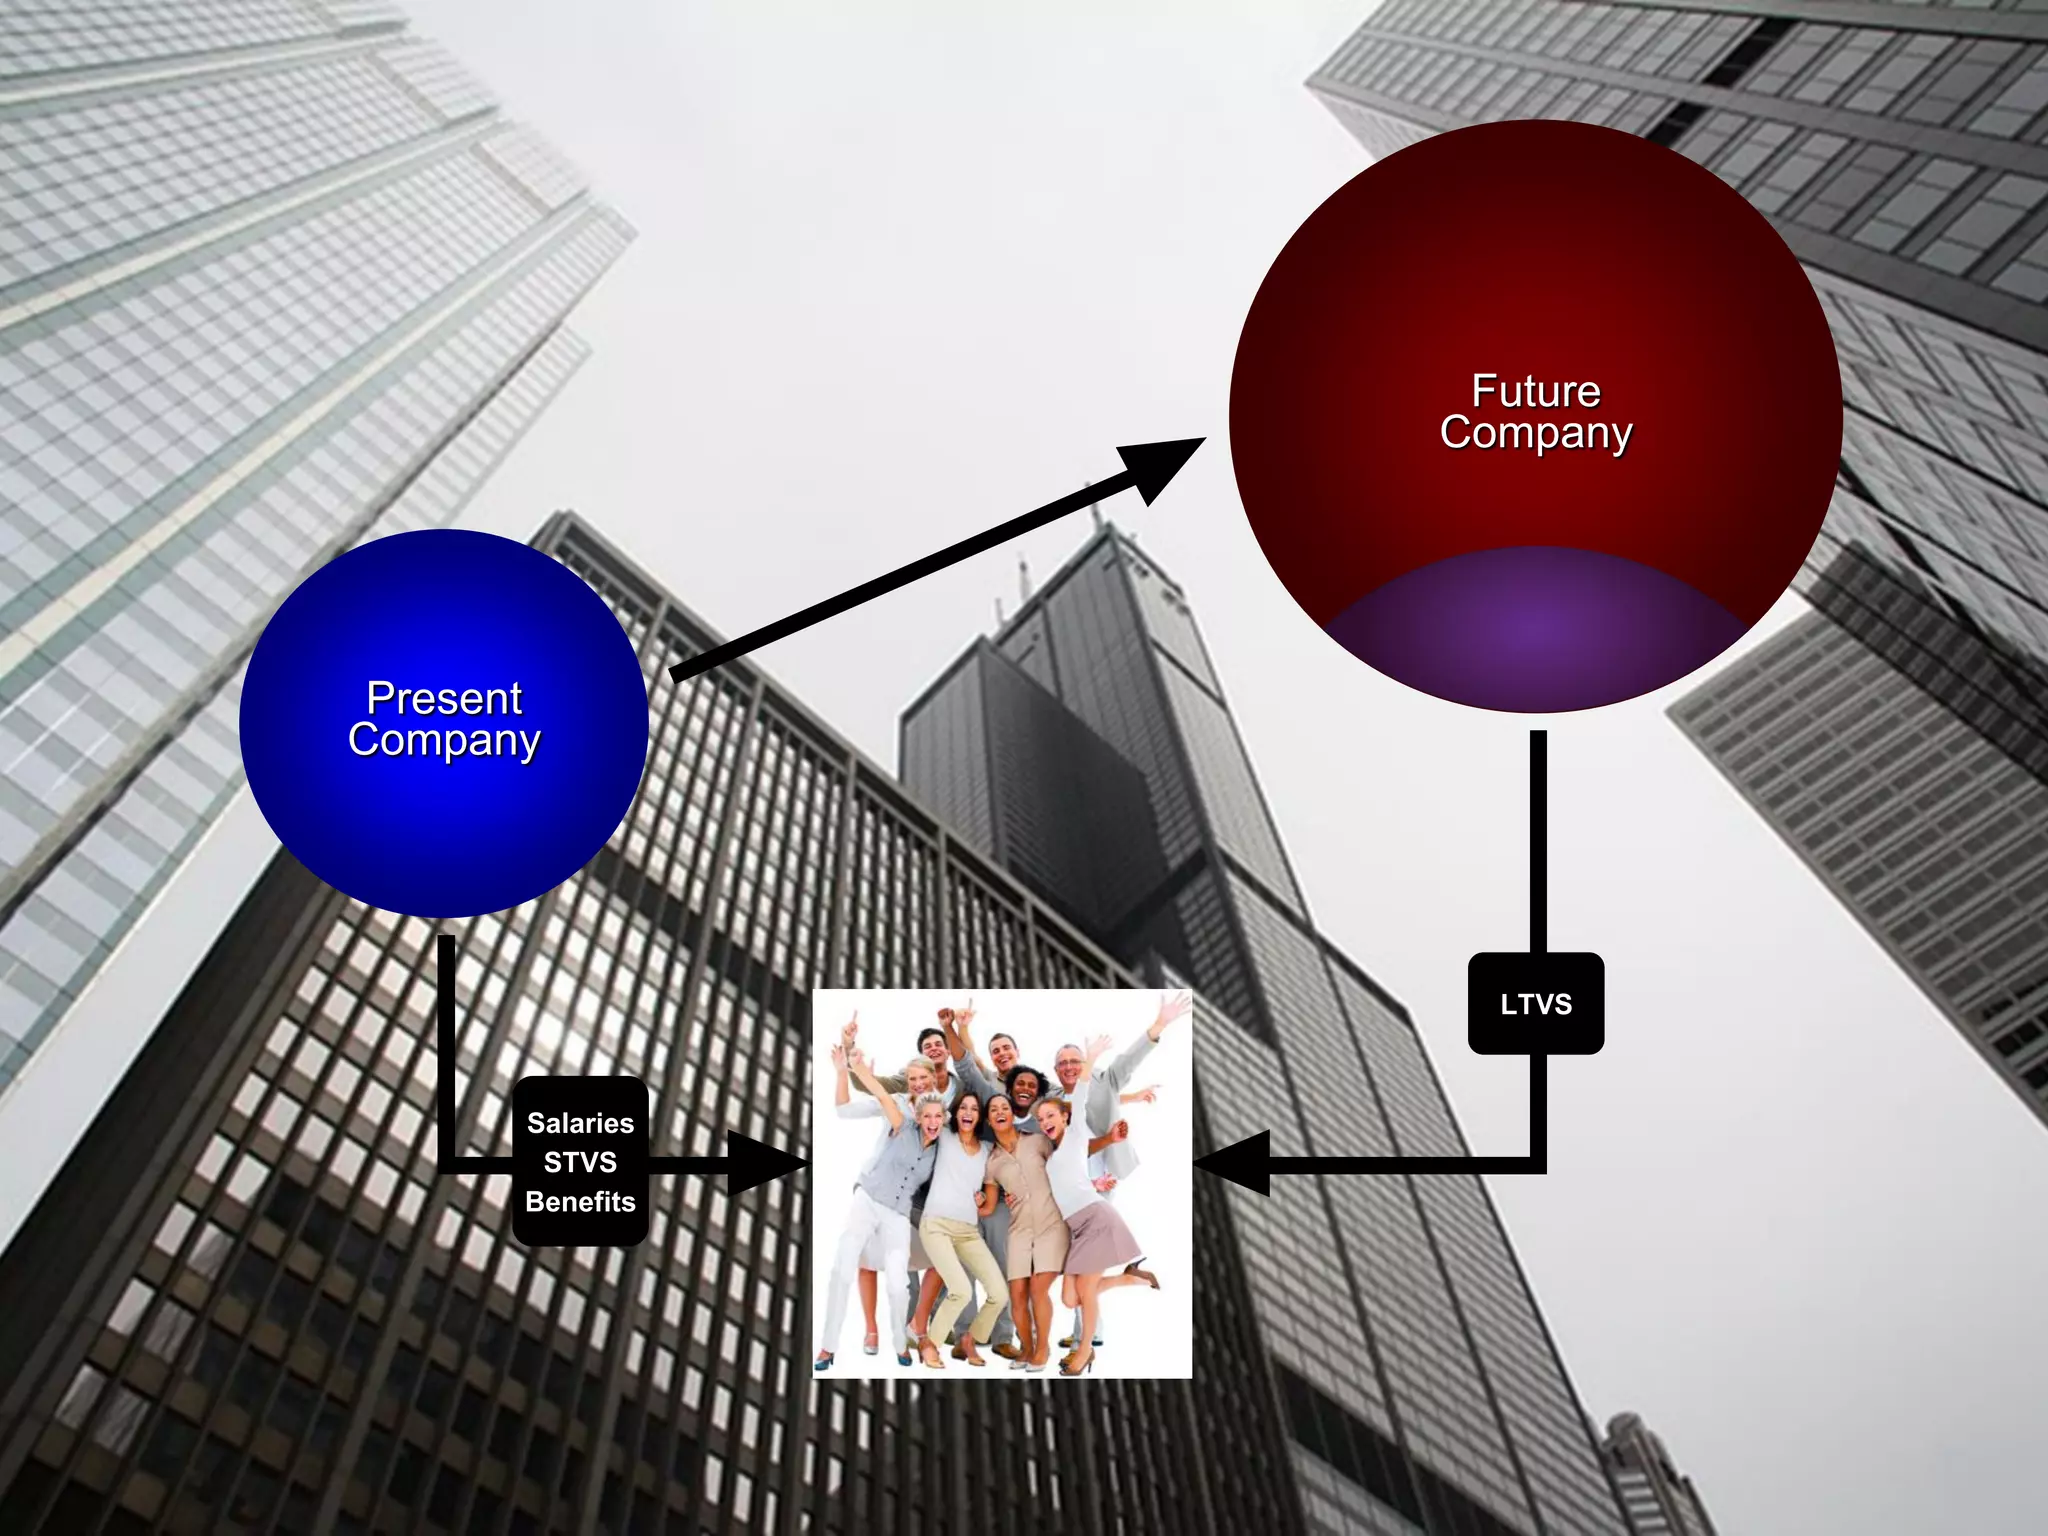


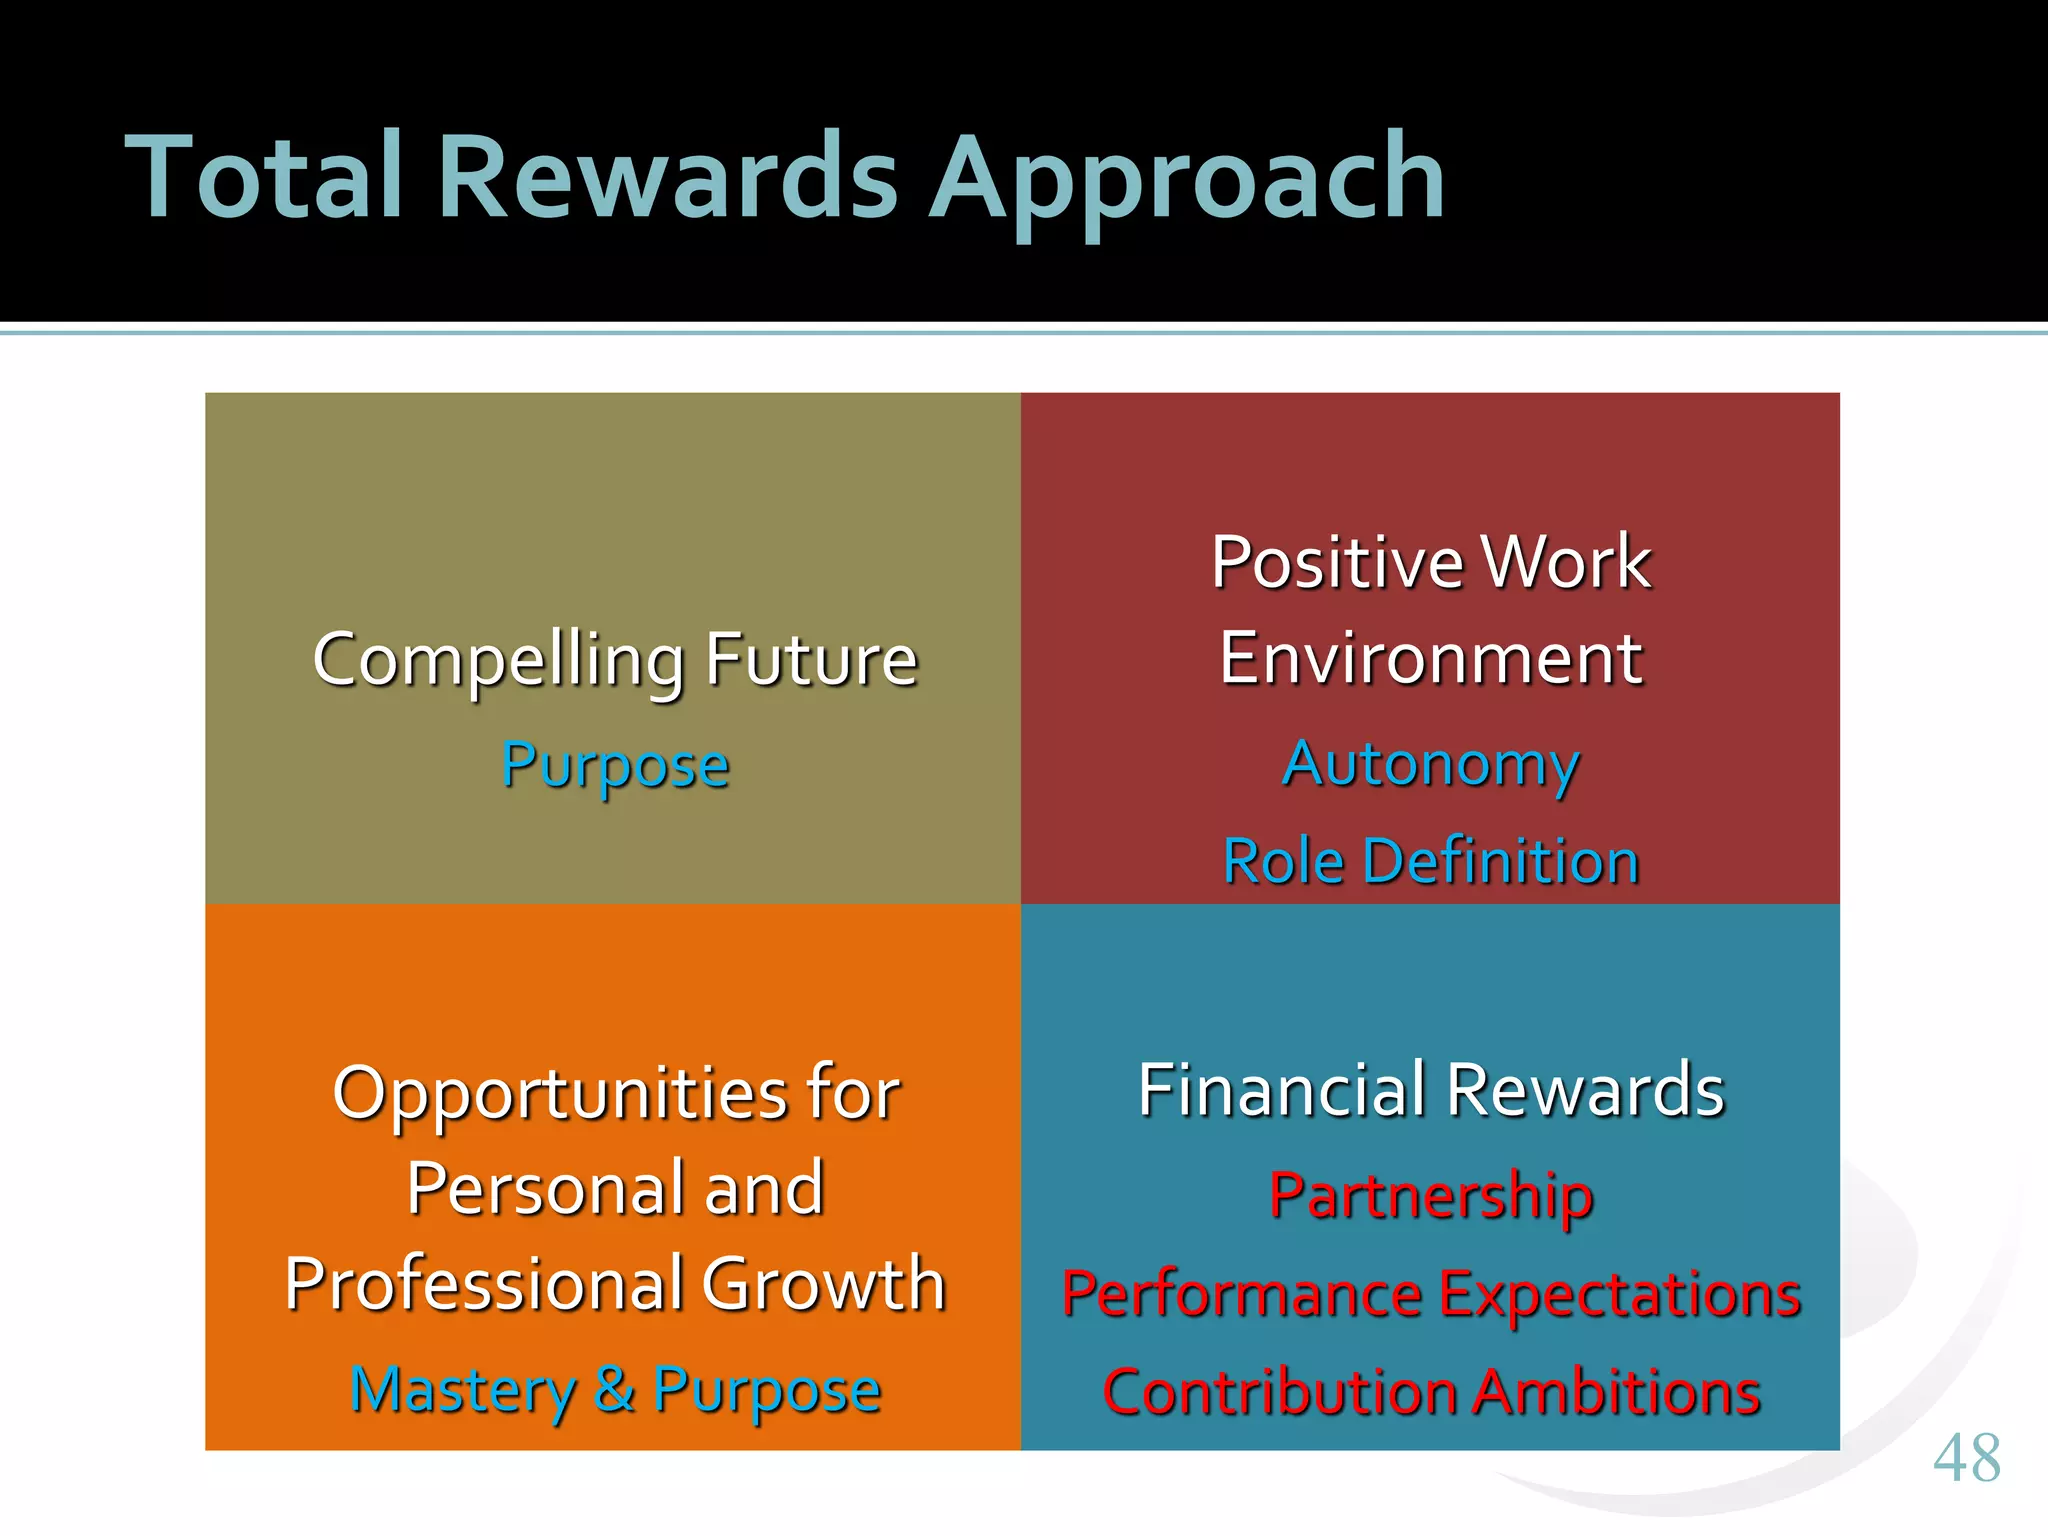


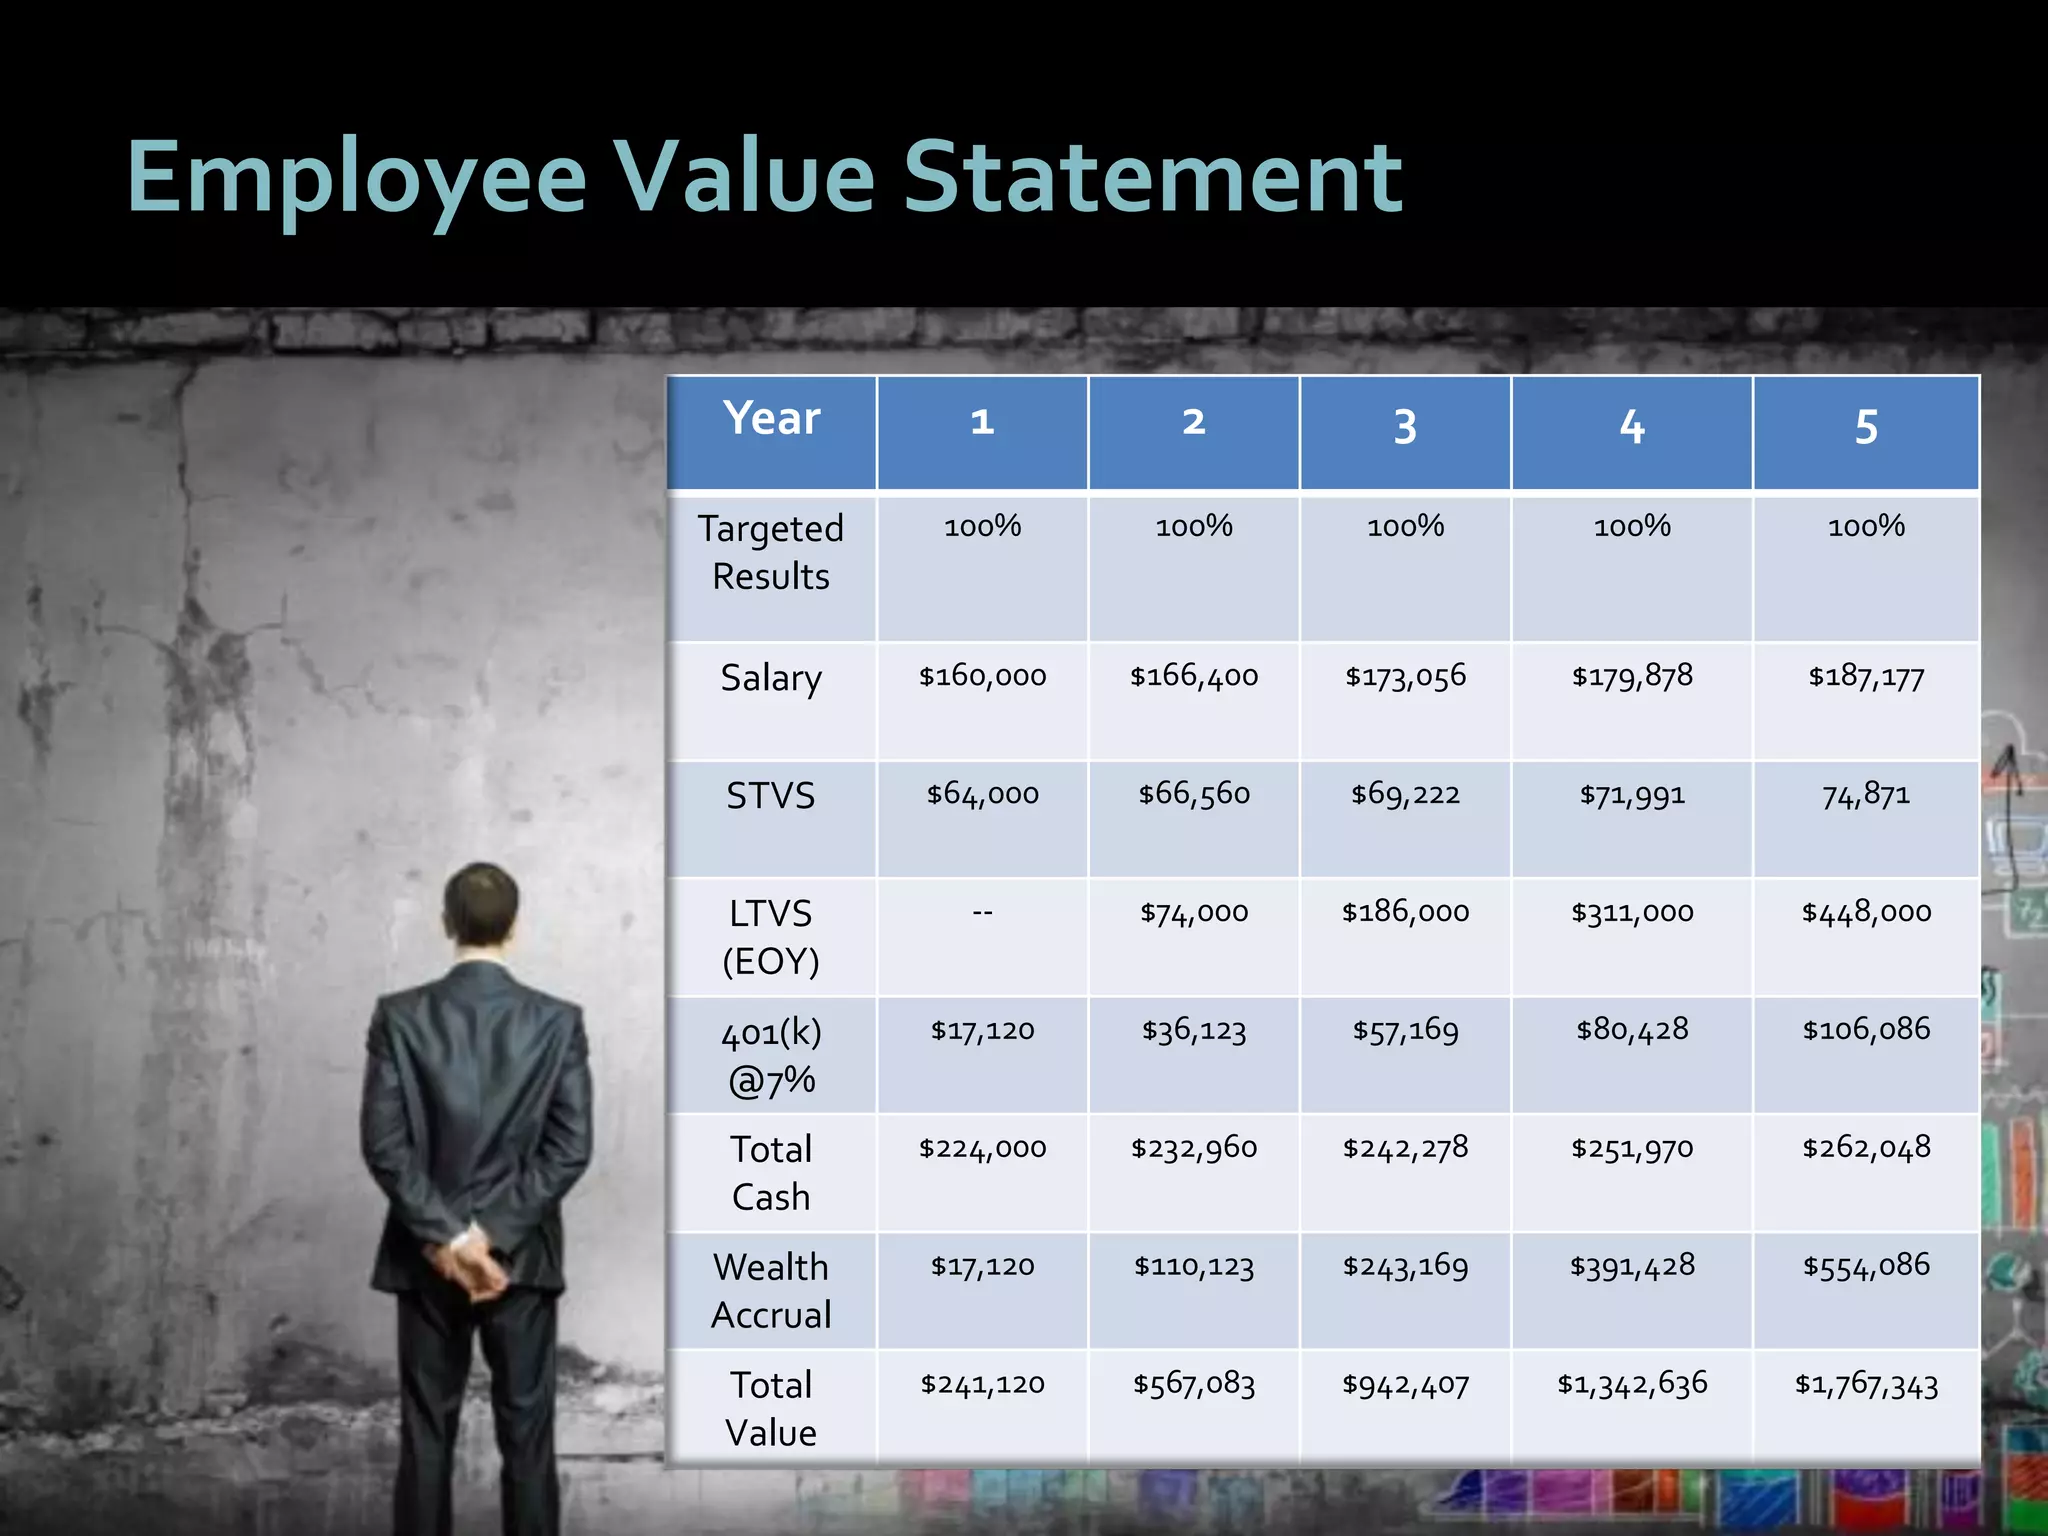
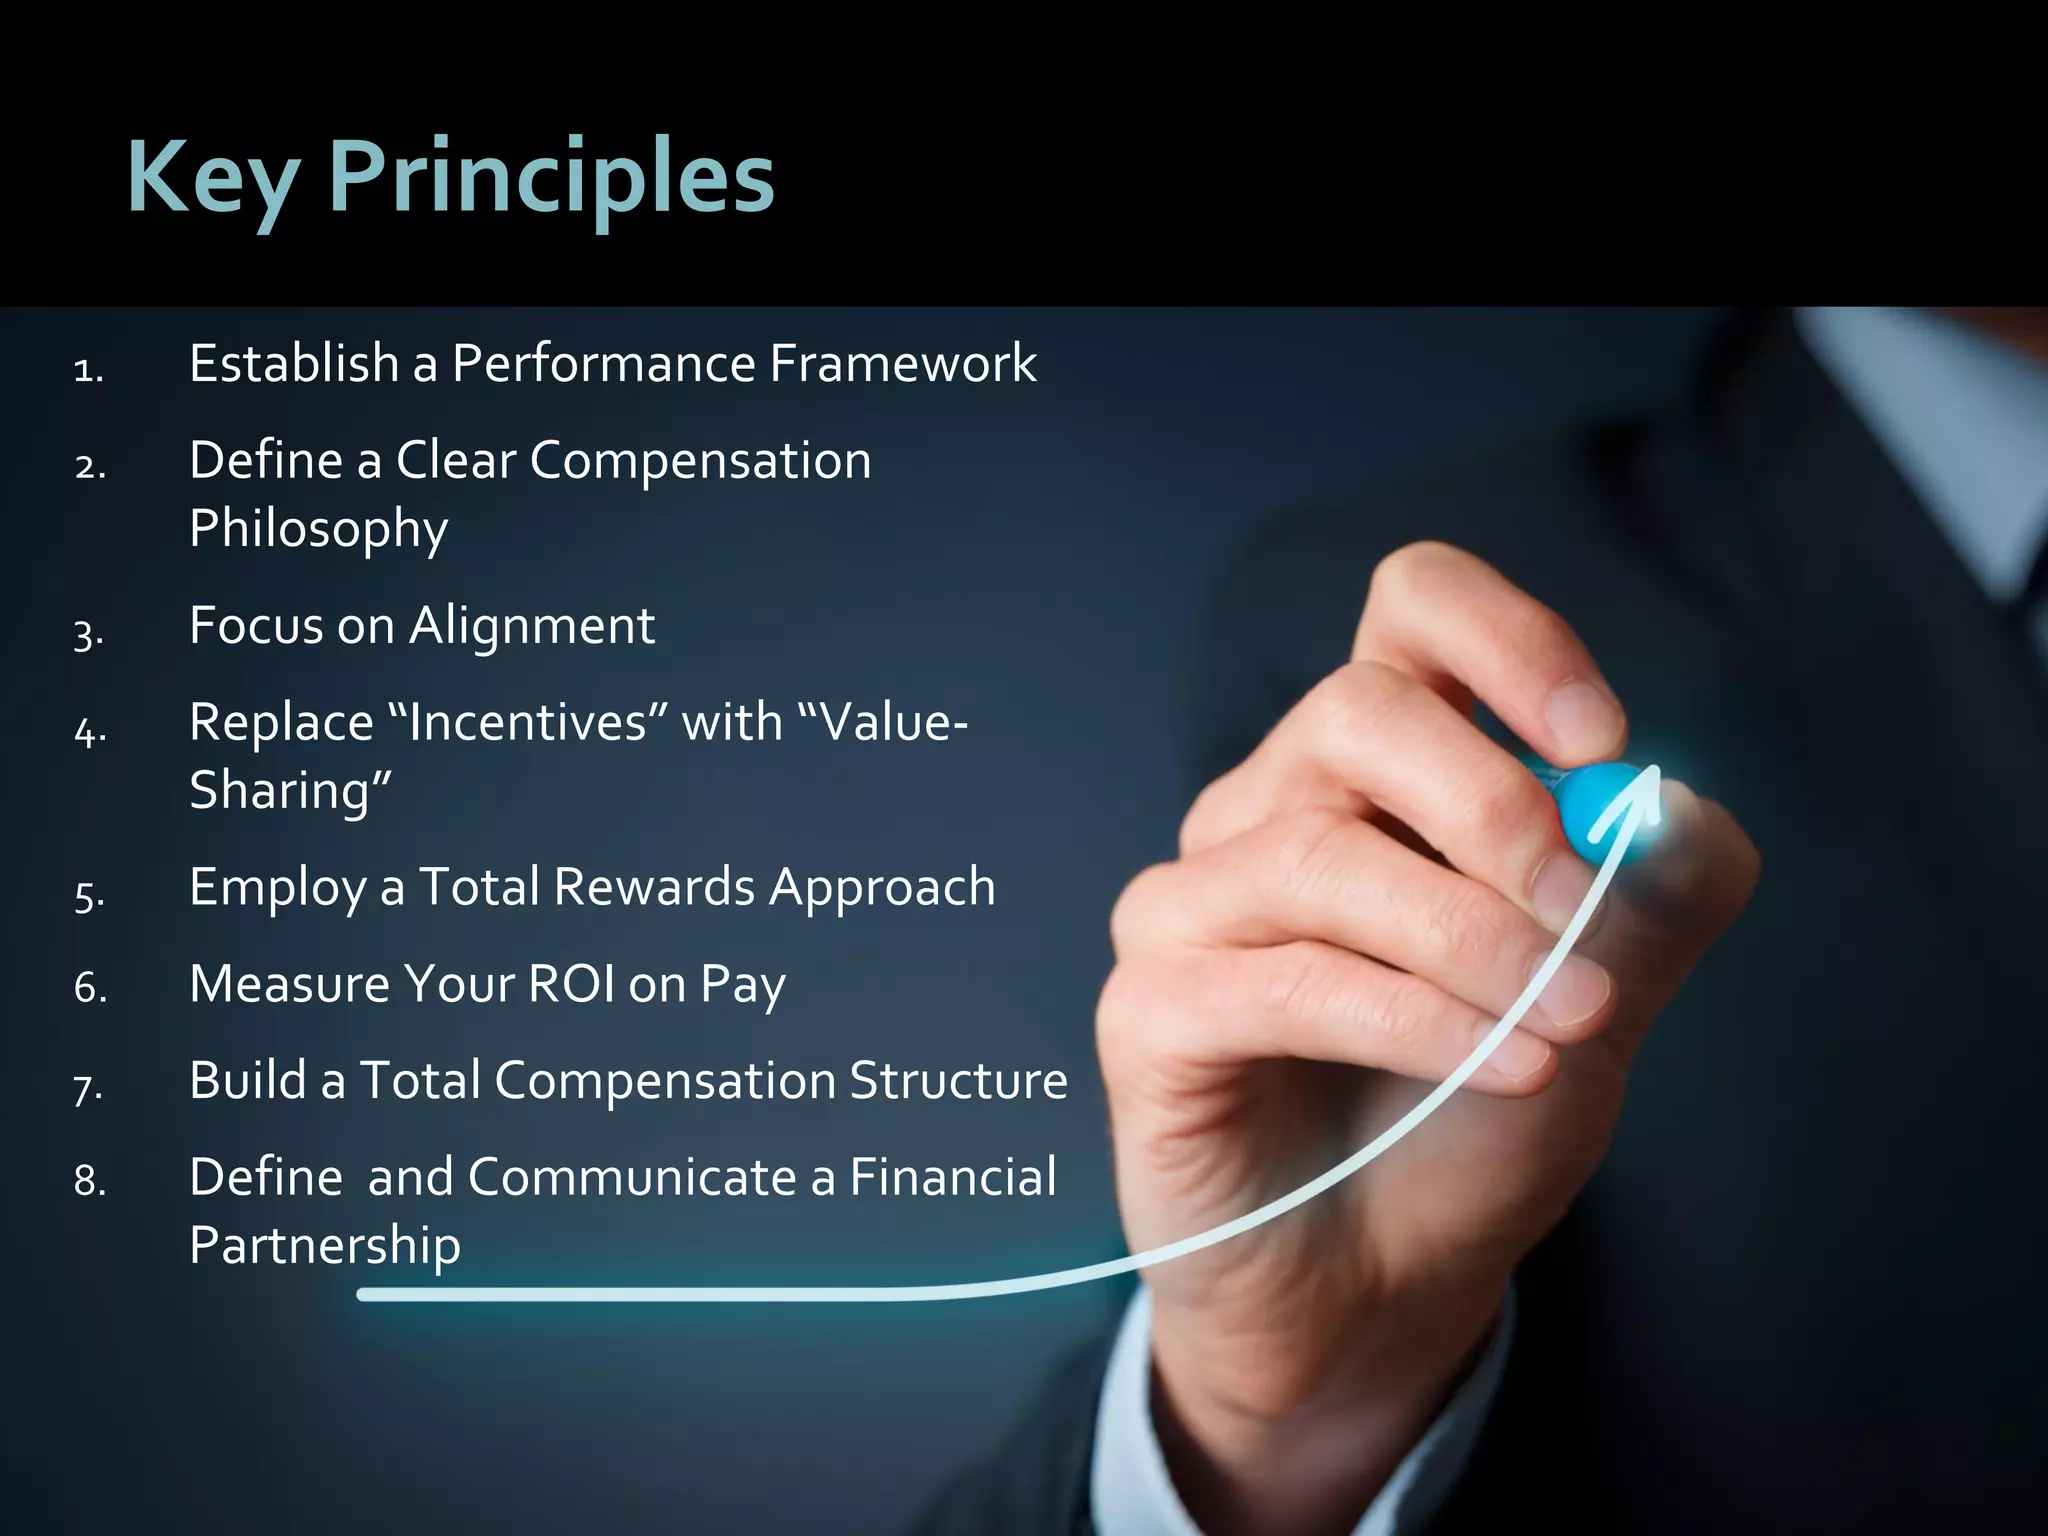


The document outlines a vision for transforming compensation strategies to enhance employee engagement and drive business growth by sharing value with employees. Key principles include establishing a performance framework, developing a clear pay philosophy, and employing a total rewards approach, all focused on aligning compensation with business goals. The aim is to create a performance culture that attracts top talent and promotes long-term value sharing as a means to foster trust and accelerate results.


