Download to read offline


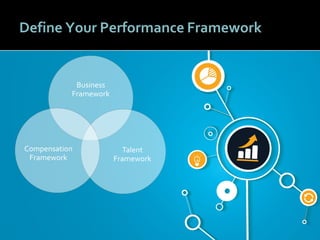
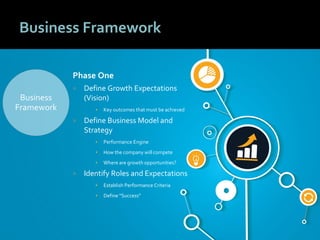
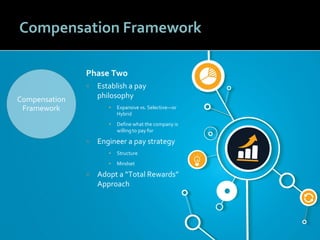
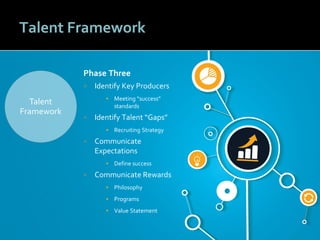


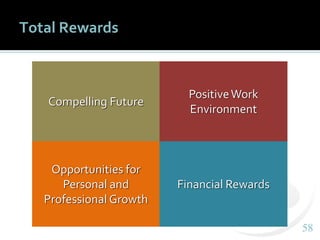


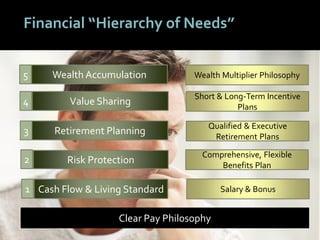
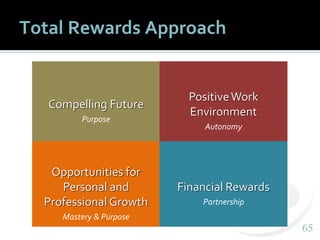

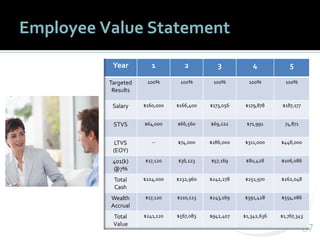
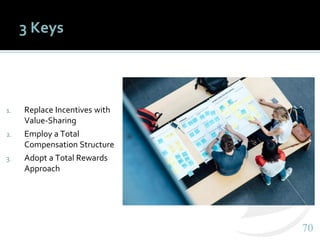


This document discusses linking employee performance, performance management, and rewards. It outlines 3 keys to achieving this link: 1) replacing incentives with value-sharing to promote partnership over pay-for-performance, 2) employing a total compensation structure for flexibility and alignment, and 3) adopting a total rewards approach beyond just pay. It emphasizes establishing clear performance and compensation frameworks, embracing agile performance management, and communicating expectations and rewards as part of an irresistible organization that engages employees as partners in value creation.


