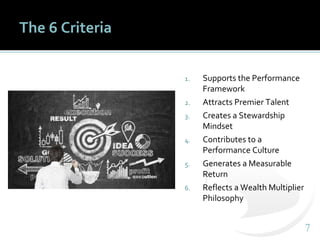
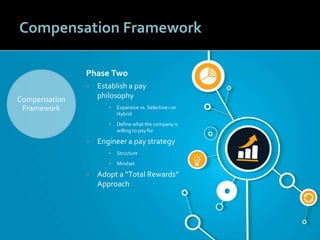
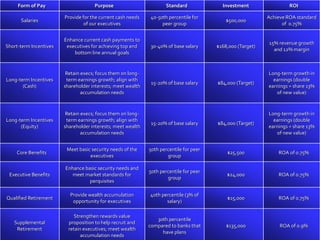
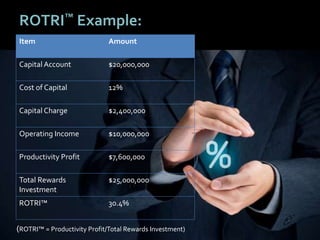
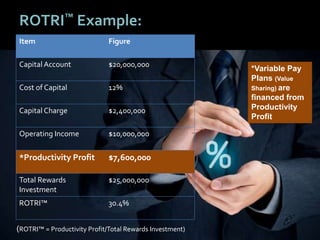
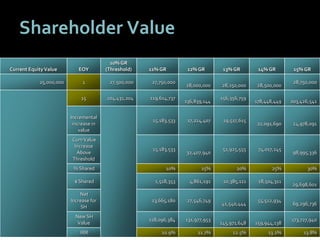
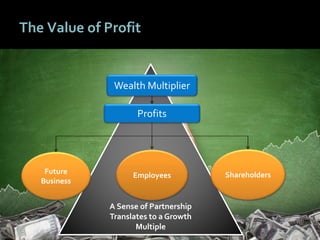
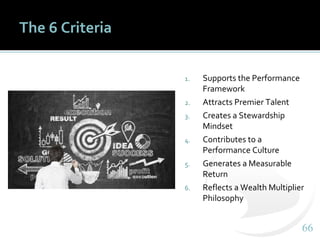
Pay Strategies that Increase
Shareholder Value
Vision: HelpYou Become a
Wealth Multiplier Organization
Transform the way you use
compensation to share value with
employees.
If you do that…
• Quality of talent will improve.
• Employee engagement will expand.
• Performance will be magnified.
• Business growth will be accelerated.
• Shareholder value will increase.
44
Shareholder Pain Points
 Growth goals not being reached.
 Static profits.
 Costs are up.
 Lack of performance.
 Inadequate stewardship and
accountability.
 Fear of disruption.
 Little to no increase in
shareholder value.
55
Shareholder Considerations
 Do I have the right people?
 What is our pay strategy
producing?
 Is a performance culture
attainable?
 How do I get greater
employee buy-in and
commitment?
 Where is innovation and
leveraged growth going to
come from?
 Do I liquidate (sell) or do I
forge on?
66
Pay Implications
 Pay must produce a return.
 Pay must reinforce
accountability.
 Pay must facilitate a
performance culture.
 Pay must reward
innovation.
 Pay must attract premier
and retain premier talent.
 Pay must improve
shareholder value.
77
The 6 Criteria
1. Supports the Performance
Framework
2. Attracts Premier Talent
3. Creates a Stewardship
Mindset
4. Contributes to a
Performance Culture
5. Generates a Measurable
Return
6. Reflects a Wealth Multiplier
Philosophy
88
1. Supports the Performance Framework
99
What is a Performance Framework?
Business
Framework
Talent
Framework
Compensation
Framework
1010
Business Framework
Phase One
 Define Growth Expectations
(Vision)
▪ Key outcomes that must be achieved
 Define Business Model and
Strategy
▪ Performance Engine
▪ How the company will compete
▪ Where are growth opportunities?
 Identify Roles and Expectations
▪ Establish Performance Criteria
▪ Define “Success”
Business
Framework
1111
Compensation Framework
Phase Two
 Establish a pay
philosophy
▪ Expansive vs. Selective—or
Hybrid
▪ Define what the company is
willing to pay for
 Engineer a pay strategy
▪ Structure
▪ Mindset
 Adopt a “Total Rewards”
Approach
Compensation
Framework
1212
Talent Framework
Phase Three
 Identify Key Producers
▪ Meeting “success”
standards
 Identify Talent “Gaps”
▪ Recruiting Strategy
 Communicate
Expectations
▪ Define success
 Communicate Rewards
▪ Philosophy
▪ Programs
▪ Value Statement
Talent
Framework
1313
2. Attracts Premier Talent
1414
The Issue
One of the biggest headaches for CEOs is making sure that
the organization has the right people to cope with what lies
ahead. There’s the basic question of planning for the skills
that are needed now and in the future: Which roles will be
automated? What new roles will be needed to manage and
run emerging technology? What skills should the company
be looking for, and training their people for? Where will we
find the people we need?
PwC’s 18th Annual Global CEO Survey
1515
But more importantly, CEOs need to be sure that the
business is fit to react quickly to whatever the future may
throw at it – and that means filling it with adaptable,
creative people, working in a culture where energy fizzes
and ideas spark into life. If they can’t be found, they must be
created.
PwC’s 18th Annual Global CEO Survey (continued)
1616
Key Talent Trend
By 2020, the worldwide shortage of highly
skilled, college-educated workers could
reach 38 to 40 million, or 13% of demand.
(Source: McKinsey Global Institute)
1717
Where Business is Headed
Innovation
Transformation
1818
The Emergence of Catalysts
The New Corporate Garage
“…Apple’s inventiveness is no anomaly; it indicates a dramatic shift in the world of innovation.
The revolution spurred by venture capitalists decades ago has created the conditions in
which scale enables big companies to stop shackling innovation and start unleashing it.”
1919
Catalysts Change Growth Trajectory
“…entrepreneurial individuals, or ‘catalysts,’
within big companies are using those companies’
resources, scale, and growing agility to develop
solutions to global challenges in ways that few
others…” (Harvard Business Review, September 2012)
Jony Ive
2020
Catalysts
 Into their late 30s or early 40s
 Have gained meaningful
experience and possess
unique abilities.
 Able to affect significant
(positive) change in an
organization
 Companies are competing
for their talents.
 They have leverage and are
in a position to negotiate.
Brian Chesney, Airbnb
2121
What it Means
• Companies will need
catalysts
• Catalysts must focus on
areas of strategic impact
• Scarcity of high impact
talent
• Shrinking talent pool
creates competition
• Competition demands a
unique value proposition
2222
What Catalysts Want
 There is a philosophy that
guides pay decisions and I
relate to it.
 There is a mechanism for
sharing value with those who
help produce it.
 I have some control over how
much I can earn if I produce.
 I feel a sense of partnership
with ownership.
2323
Future Trends for Defining a Financial
Partnership
 Performance Agreements
 Opt-In Plans
 Internal Venture Capital
 Long-Term Value Sharing Plans
2424
Performance Agreements
Prominent Media Company
 High performers excluded from profit
sharing-type incentive plan
 Annual negotiated “deal”
 “Deal sheet”
 Quarterly self-evaluation
2525
Performance Agreement
Outcomes
 High performance threshold
 Small or even $0 payouts can occur
 High-risk, high-upside
 Mentoring environment
 Ownership mindset
 High retention
2626
Opt-In Plans
Most Ideal in Start-Up Environment
 Opt for:
 “Higher” salary plus modest incentives
 “Low” or no salary and high upside through short and long-term value
sharing
 Tied to a revenue or profit-sharing formula
 Volatility: payments lowered &/or deferred
 Opt-In periods may differ
2727
Opt-In Plans
Outcomes
 Employees feel in control
 Owners limit exposure
 Highly flexible
 “Shared” entrepreneurial experience
 Promotes an ownership mindset
 “Self-identifies” key performers
2828
Internal Venture Capital
Highly Entrepreneurial
Approach
 Larger organizations
 Establish venture capital
account
 Define access criteria
 Fund innovative ideas
 Performance criteria set
 Value sharing plan tied to
performance criteria
 Accompanied by performance
agreements or “opt-in” comp
plans
2929
Internal Venture Capital
Outcomes
 Accelerate innovation
 Attract catalysts
 Share risk
 Identify potential future leaders
and owners
3030
Value Sharing Instead of “Incentives”
Incentives imply a
“carrot and stick”
approach while value-
sharing is about
reinforcing outcomes
and forging a financial
partnership.
3131
Long-Term Value Sharing Plans
Broad Application
 Any size organization
 Can be tied to any of
previous approaches
 Creates “wealth
multiplier” mindset
 Links employees to
company vision and
business plan
3232
Select the Right Plan Type
Stock Option
Performance Shares
Restricted Stock
Phantom Stock
Option
Performance
Phantom Stock
Phantom Stock Profit Pool
Performance Unit
Strategic Deferred
Compensation
3333
Grant Equity or
Not Equity?
Full Value or
Appreciation Only?
Yes
Appreciation
Stock Option
Full Value
Performance Based?
Yes
Performance Shares
No
Restricted Stock
No
Reward for Value
Increase or Financial
Performance?
Value Increase
Full Value or
Appreciation?
Appreciation
Phantom Stock
Option
Full Value
Performance Based?
Yes
Performance
Phantom Stock
No
Phantom Stock
Financial
Performance
Appreciation-
Performance Based or
Employee Directed?
Performance
Based
Reward for Profit/Cash
Flow or Other Metrics?
Profits
Allocation or
Objectives Based?
Allocation
Profit Pool
ObjectivesOther Metrics
Performance Unit
Employee Directed
Strategic Deferred
Compensation
3434
3. Creates a Stewardship Mindset
3535
The Stewardship Evolution
BeDoBelieveKnow
3636
The Stewardship Evolution
BeDoBelieveKnow
Stewards
Own
Outcomes
Partnership
Role &
Expectations
3737
Focus on Pay Plan Alignment
Pay should turn employees into growth partners.
3838
Line of Sight
Vision
Where?
Model &
Strategy
How ?
Roles and
Expectations
My Contribution?
Rewards
What’s in it for
me?
3939
Eight Components of Pay
Benefits
 Core benefits
 Executive benefits
 Qualified retirement plans
 Supplemental retirement plans
Compensation
 Salary
 Performance incentives
 Sales incentives
 Growth incentives
Incentives should be in the form of value sharing.
4040
Salary
Performance
Incentives
Sales
Incentives
Growth
Incentives
Core Health
& Welfare
Plans
Executive
Benefit
Plans
Qualified
Retirement
Plans
Nonqualified
Retirement
Plans
Salaries
Competitive with market standards?
Tied to strong performance management process (merit)?
Managed within a flexible but effective structure?
Performance Incentives
Tied to productivity gains?
Clear, achievable and meaningful?
Self-financing?
Sales Incentives
Challenging yet achievable?
Reinforcing the right behaviors?
Differentiating your offering?
Growth Incentives
Linked to a compelling future?
Supporting an ownership mentality?
Securing premier talent?
Core Benefits
Responsive to today’s employee marketplace?
Allocating resources where most needed?
Evaluated to eliminate unnecessary expense?
Executive Benefits
Flexible enough to address varying circumstances?
Communicating a unique relationship?
Reducing employee tax expense?
Qualified Retirement Plans
Giving employees an opportunity to optimize retirement values?
Operated with comprehensive fiduciary accountability?
Avoiding conflicts and minimizing expenses?
Nonqualified Retirement Plans
Optimizing tax-deferral opportunities?
Aligning long-term interests of employees with shareholders?
Structured to receive best possible P&L impact?
An Aligned
Compensation
Strategy
4141
Form of Pay Purpose Standard Investment ROI
Salaries
Provide for the current cash needs
of our executives
40-50th percentile for
peer group
$500,000
Achieve ROA standard
of 0.75%
Short-term Incentives
Enhance current cash payments to
executives for achieving top and
bottom line annual goals
30-40% of base salary $168,000 (Target)
15% revenue growth
and 12% margin
Long-term Incentives
(Cash)
Retain execs; focus them on long-
term earnings growth; align with
shareholder interests; meet wealth
accumulation needs
15-20% of base salary $84,000 (Target)
Long-term growth in
earnings (double
earnings = share 13%
of new value)
Long-term Incentives
(Equity)
Retain execs; focus them on long-
term earnings growth; align with
shareholder interests; meet wealth
accumulation needs
15-20% of base salary $84,000 (Target)
Long-term growth in
earnings (double
earnings = share 13%
of new value)
Core Benefits
Meet basic security needs of the
executives
50th percentile for peer
group
$25,500 ROA of 0.75%
Executive Benefits
Enhance basic security needs and
meet market standards for
perquisites
50th percentile for peer
group
$24,000 ROA of 0.75%
Qualified Retirement
Provide wealth accumulation
opportunity for executives
40th percentile (3% of
salary)
$15,000 ROA of 0.75%
Supplemental
Retirement
Strengthen rewards value
proposition to help recruit and
retain executives; meet wealth
accumulation needs
30th percentile
compared to banks that
have plans
$135,000 ROA of 0.9%
4242
The Ultimate Purpose of Pay
Create a Unified FinancialVision for Growing the Business
4343
Total Rewards Approach
Compelling Future
Positive Work
Environment
Opportunities for
Personal and
Professional Growth
Financial Rewards
4444
Total Rewards Approach
Compelling Future
Purpose
Positive Work
Environment
Autonomy
Opportunities for
Personal and
Professional Growth
Mastery & Purpose
Financial Rewards
Partnership
4545
4. Contributes to a Performance Culture
4646
What is a Performance Culture?
 Focus
 Execution
 Sustained Success
Patterns
 Consistent “Wins”
 Confidence
4747
Rewards to Results
4848
What Results?
Value Creation
4949
Performance instead of What?
Entitlement
5050
Signs of an Entitlement Mentality
 Value creation not
understood
 Expectations of salary
increases
 Requests for equity
participation
 Bonus payments without
performance
 Tenured mentality
5151
What kind of Pay?
Accountable Pay
5252
5. Generate a Measurable Return
5353
How Do You Measure ROI on Pay?
Calculate Your
Productivity Profit
5454
ROTRI™ Example:
Item Amount
Capital Account $20,000,000
Cost of Capital 12%
Capital Charge $2,400,000
Operating Income $10,000,000
Productivity Profit $7,600,000
Total Rewards
Investment
$25,000,000
ROTRI™ 30.4%
(ROTRI™ = Productivity Profit/Total Rewards Investment)
5555
ROTRI™ Example:
Item Figure
Capital Account $20,000,000
Cost of Capital 12%
Capital Charge $2,400,000
Operating Income $10,000,000
*Productivity Profit $7,600,000
Total Rewards
Investment
$25,000,000
ROTRI™ 30.4%
(ROTRI™ = Productivity Profit/Total Rewards Investment)
*Variable Pay
Plans (Value
Sharing) are
financed from
Productivity
Profit
5656
Shareholder Value
Current EquityValue EOY
10% GR
(Threshold) 11% GR 12% GR 13% GR 14% GR 15% GR
25,000,000 1 27,500,000 27,750,000
28,000,000 28,250,000 28,500,000
28,750,000
15 104,431,204 119,614,737
136,839,144
156,356,759
178,448,449 203,426,541
Incremental
increase in
value
15,183,533 17,224,407 19,517,615
22,091,690 24,978,091
CumValue
Increase
Above
Threshold
15,183,533
32,407,940
51,925,555 74,017,245
98,995,336
% Shared 10% 15% 20% 25% 30%
$ Shared 1,518,353 4,861,191 10,385,111 18,504,311
29,698,601
Net
Increase for
SH
13,665,180 27,546,749
41,540,444
55,512,934
69,296,736
New SH
Value
118,096,384 131,977,953
145,971,648 159,944,138
173,727,940
IRR 10.9% 11.7% 12.5% 13.2% 13.8%
5757
6. Reflects a Wealth Multiplier Philosophy
5858
Wealth Multipliers vs. Wealth Creators
Wealth Creators
 Profitability focus
 Recruit to skills and
experience
 Pay is an expense to
be managed
 Salaries and total pay
should be “at market”
 “Pay-for-
performance”
Wealth Multipliers
 Accelerate value
creation
 Recruit premier talent
that fits performance
framework
 Pay is an investment
that should produce a
growing return
 Market pay for bench
marking but pay
philosophy drive
comp strategy
 Sharing value with
value creators
5959
The Value of Profit
Wealth Multiplier
Profits
Future
Business
Employees Shareholders
6060
A Sense of Partnership
Translates to a Growth
Multiple
The Value of Profit
Wealth Multiplier
Profits
ShareholdersFuture
Business
Employees
6161
Case Study
6262
Keith Williams  Assumed leadership of
UL in 2005
 Company carrying
considerable debt
 Losing market share
 Low employee morale
 UL had become
bureaucratic and “siloed”
6363
Core Changes Shift from “Incentives” to
“Value Sharing”
 Took away local measurements
driving management incentive
plans—all paid on same metrics
 “We live together and we die
together”
 Aligned everyone behind
company success
 “I call it ‘pay the company first.’ ”
6464
Pay the Company First
“Basically, up to the
company’s operating
profit target, all of the
profits go to the
company; and only after
that target is met, do we
start funding the
incentive pool.”
Example: If UL’s target is
$80 million--
 100% of first $80 in
profit goes to company
 The next $20 million
goes to the incentive
pool
 From there on, 50/50
between company &
incentive pool
6565
Pay the Company First
Once value creation is defined,
compensation can follow a formula
for sharing value in a way that
aligns key producers with
shareholder priorities.
6666
The 6 Criteria
1. Supports the Performance
Framework
2. Attracts Premier Talent
3. Creates a Stewardship
Mindset
4. Contributes to a
Performance Culture
5. Generates a Measurable
Return
6. Reflects a Wealth Multiplier
Philosophy
6767
Who Benefits?
Shareholders
 Magnet for premier talent
 Perpetuate growth
 Increased business value
 Legacy of opportunity
 Accelerated wealth
accumulation
Stakeholders
 Associated with a winner
 Positive work environment
 Personal and professional
development
 Financial rewards

Pay Strategies that Increase Shareholder Value

  • 1.
    Pay Strategies thatIncrease Shareholder Value
  • 2.
    Vision: HelpYou Becomea Wealth Multiplier Organization Transform the way you use compensation to share value with employees.
  • 3.
    If you dothat… • Quality of talent will improve. • Employee engagement will expand. • Performance will be magnified. • Business growth will be accelerated. • Shareholder value will increase.
  • 4.
    44 Shareholder Pain Points Growth goals not being reached.  Static profits.  Costs are up.  Lack of performance.  Inadequate stewardship and accountability.  Fear of disruption.  Little to no increase in shareholder value.
  • 5.
    55 Shareholder Considerations  DoI have the right people?  What is our pay strategy producing?  Is a performance culture attainable?  How do I get greater employee buy-in and commitment?  Where is innovation and leveraged growth going to come from?  Do I liquidate (sell) or do I forge on?
  • 6.
    66 Pay Implications  Paymust produce a return.  Pay must reinforce accountability.  Pay must facilitate a performance culture.  Pay must reward innovation.  Pay must attract premier and retain premier talent.  Pay must improve shareholder value.
  • 7.
    77 The 6 Criteria 1.Supports the Performance Framework 2. Attracts Premier Talent 3. Creates a Stewardship Mindset 4. Contributes to a Performance Culture 5. Generates a Measurable Return 6. Reflects a Wealth Multiplier Philosophy
  • 8.
    88 1. Supports thePerformance Framework
  • 9.
    99 What is aPerformance Framework? Business Framework Talent Framework Compensation Framework
  • 10.
    1010 Business Framework Phase One Define Growth Expectations (Vision) ▪ Key outcomes that must be achieved  Define Business Model and Strategy ▪ Performance Engine ▪ How the company will compete ▪ Where are growth opportunities?  Identify Roles and Expectations ▪ Establish Performance Criteria ▪ Define “Success” Business Framework
  • 11.
    1111 Compensation Framework Phase Two Establish a pay philosophy ▪ Expansive vs. Selective—or Hybrid ▪ Define what the company is willing to pay for  Engineer a pay strategy ▪ Structure ▪ Mindset  Adopt a “Total Rewards” Approach Compensation Framework
  • 12.
    1212 Talent Framework Phase Three Identify Key Producers ▪ Meeting “success” standards  Identify Talent “Gaps” ▪ Recruiting Strategy  Communicate Expectations ▪ Define success  Communicate Rewards ▪ Philosophy ▪ Programs ▪ Value Statement Talent Framework
  • 13.
  • 14.
    1414 The Issue One ofthe biggest headaches for CEOs is making sure that the organization has the right people to cope with what lies ahead. There’s the basic question of planning for the skills that are needed now and in the future: Which roles will be automated? What new roles will be needed to manage and run emerging technology? What skills should the company be looking for, and training their people for? Where will we find the people we need? PwC’s 18th Annual Global CEO Survey
  • 15.
    1515 But more importantly,CEOs need to be sure that the business is fit to react quickly to whatever the future may throw at it – and that means filling it with adaptable, creative people, working in a culture where energy fizzes and ideas spark into life. If they can’t be found, they must be created. PwC’s 18th Annual Global CEO Survey (continued)
  • 16.
    1616 Key Talent Trend By2020, the worldwide shortage of highly skilled, college-educated workers could reach 38 to 40 million, or 13% of demand. (Source: McKinsey Global Institute)
  • 17.
    1717 Where Business isHeaded Innovation Transformation
  • 18.
    1818 The Emergence ofCatalysts The New Corporate Garage “…Apple’s inventiveness is no anomaly; it indicates a dramatic shift in the world of innovation. The revolution spurred by venture capitalists decades ago has created the conditions in which scale enables big companies to stop shackling innovation and start unleashing it.”
  • 19.
    1919 Catalysts Change GrowthTrajectory “…entrepreneurial individuals, or ‘catalysts,’ within big companies are using those companies’ resources, scale, and growing agility to develop solutions to global challenges in ways that few others…” (Harvard Business Review, September 2012) Jony Ive
  • 20.
    2020 Catalysts  Into theirlate 30s or early 40s  Have gained meaningful experience and possess unique abilities.  Able to affect significant (positive) change in an organization  Companies are competing for their talents.  They have leverage and are in a position to negotiate. Brian Chesney, Airbnb
  • 21.
    2121 What it Means •Companies will need catalysts • Catalysts must focus on areas of strategic impact • Scarcity of high impact talent • Shrinking talent pool creates competition • Competition demands a unique value proposition
  • 22.
    2222 What Catalysts Want There is a philosophy that guides pay decisions and I relate to it.  There is a mechanism for sharing value with those who help produce it.  I have some control over how much I can earn if I produce.  I feel a sense of partnership with ownership.
  • 23.
    2323 Future Trends forDefining a Financial Partnership  Performance Agreements  Opt-In Plans  Internal Venture Capital  Long-Term Value Sharing Plans
  • 24.
    2424 Performance Agreements Prominent MediaCompany  High performers excluded from profit sharing-type incentive plan  Annual negotiated “deal”  “Deal sheet”  Quarterly self-evaluation
  • 25.
    2525 Performance Agreement Outcomes  Highperformance threshold  Small or even $0 payouts can occur  High-risk, high-upside  Mentoring environment  Ownership mindset  High retention
  • 26.
    2626 Opt-In Plans Most Idealin Start-Up Environment  Opt for:  “Higher” salary plus modest incentives  “Low” or no salary and high upside through short and long-term value sharing  Tied to a revenue or profit-sharing formula  Volatility: payments lowered &/or deferred  Opt-In periods may differ
  • 27.
    2727 Opt-In Plans Outcomes  Employeesfeel in control  Owners limit exposure  Highly flexible  “Shared” entrepreneurial experience  Promotes an ownership mindset  “Self-identifies” key performers
  • 28.
    2828 Internal Venture Capital HighlyEntrepreneurial Approach  Larger organizations  Establish venture capital account  Define access criteria  Fund innovative ideas  Performance criteria set  Value sharing plan tied to performance criteria  Accompanied by performance agreements or “opt-in” comp plans
  • 29.
    2929 Internal Venture Capital Outcomes Accelerate innovation  Attract catalysts  Share risk  Identify potential future leaders and owners
  • 30.
    3030 Value Sharing Insteadof “Incentives” Incentives imply a “carrot and stick” approach while value- sharing is about reinforcing outcomes and forging a financial partnership.
  • 31.
    3131 Long-Term Value SharingPlans Broad Application  Any size organization  Can be tied to any of previous approaches  Creates “wealth multiplier” mindset  Links employees to company vision and business plan
  • 32.
    3232 Select the RightPlan Type Stock Option Performance Shares Restricted Stock Phantom Stock Option Performance Phantom Stock Phantom Stock Profit Pool Performance Unit Strategic Deferred Compensation
  • 33.
    3333 Grant Equity or NotEquity? Full Value or Appreciation Only? Yes Appreciation Stock Option Full Value Performance Based? Yes Performance Shares No Restricted Stock No Reward for Value Increase or Financial Performance? Value Increase Full Value or Appreciation? Appreciation Phantom Stock Option Full Value Performance Based? Yes Performance Phantom Stock No Phantom Stock Financial Performance Appreciation- Performance Based or Employee Directed? Performance Based Reward for Profit/Cash Flow or Other Metrics? Profits Allocation or Objectives Based? Allocation Profit Pool ObjectivesOther Metrics Performance Unit Employee Directed Strategic Deferred Compensation
  • 34.
    3434 3. Creates aStewardship Mindset
  • 35.
  • 36.
  • 37.
    3737 Focus on PayPlan Alignment Pay should turn employees into growth partners.
  • 38.
    3838 Line of Sight Vision Where? Model& Strategy How ? Roles and Expectations My Contribution? Rewards What’s in it for me?
  • 39.
    3939 Eight Components ofPay Benefits  Core benefits  Executive benefits  Qualified retirement plans  Supplemental retirement plans Compensation  Salary  Performance incentives  Sales incentives  Growth incentives Incentives should be in the form of value sharing.
  • 40.
    4040 Salary Performance Incentives Sales Incentives Growth Incentives Core Health & Welfare Plans Executive Benefit Plans Qualified Retirement Plans Nonqualified Retirement Plans Salaries Competitivewith market standards? Tied to strong performance management process (merit)? Managed within a flexible but effective structure? Performance Incentives Tied to productivity gains? Clear, achievable and meaningful? Self-financing? Sales Incentives Challenging yet achievable? Reinforcing the right behaviors? Differentiating your offering? Growth Incentives Linked to a compelling future? Supporting an ownership mentality? Securing premier talent? Core Benefits Responsive to today’s employee marketplace? Allocating resources where most needed? Evaluated to eliminate unnecessary expense? Executive Benefits Flexible enough to address varying circumstances? Communicating a unique relationship? Reducing employee tax expense? Qualified Retirement Plans Giving employees an opportunity to optimize retirement values? Operated with comprehensive fiduciary accountability? Avoiding conflicts and minimizing expenses? Nonqualified Retirement Plans Optimizing tax-deferral opportunities? Aligning long-term interests of employees with shareholders? Structured to receive best possible P&L impact? An Aligned Compensation Strategy
  • 41.
    4141 Form of PayPurpose Standard Investment ROI Salaries Provide for the current cash needs of our executives 40-50th percentile for peer group $500,000 Achieve ROA standard of 0.75% Short-term Incentives Enhance current cash payments to executives for achieving top and bottom line annual goals 30-40% of base salary $168,000 (Target) 15% revenue growth and 12% margin Long-term Incentives (Cash) Retain execs; focus them on long- term earnings growth; align with shareholder interests; meet wealth accumulation needs 15-20% of base salary $84,000 (Target) Long-term growth in earnings (double earnings = share 13% of new value) Long-term Incentives (Equity) Retain execs; focus them on long- term earnings growth; align with shareholder interests; meet wealth accumulation needs 15-20% of base salary $84,000 (Target) Long-term growth in earnings (double earnings = share 13% of new value) Core Benefits Meet basic security needs of the executives 50th percentile for peer group $25,500 ROA of 0.75% Executive Benefits Enhance basic security needs and meet market standards for perquisites 50th percentile for peer group $24,000 ROA of 0.75% Qualified Retirement Provide wealth accumulation opportunity for executives 40th percentile (3% of salary) $15,000 ROA of 0.75% Supplemental Retirement Strengthen rewards value proposition to help recruit and retain executives; meet wealth accumulation needs 30th percentile compared to banks that have plans $135,000 ROA of 0.9%
  • 42.
    4242 The Ultimate Purposeof Pay Create a Unified FinancialVision for Growing the Business
  • 43.
    4343 Total Rewards Approach CompellingFuture Positive Work Environment Opportunities for Personal and Professional Growth Financial Rewards
  • 44.
    4444 Total Rewards Approach CompellingFuture Purpose Positive Work Environment Autonomy Opportunities for Personal and Professional Growth Mastery & Purpose Financial Rewards Partnership
  • 45.
    4545 4. Contributes toa Performance Culture
  • 46.
    4646 What is aPerformance Culture?  Focus  Execution  Sustained Success Patterns  Consistent “Wins”  Confidence
  • 47.
  • 48.
  • 49.
    4949 Performance instead ofWhat? Entitlement
  • 50.
    5050 Signs of anEntitlement Mentality  Value creation not understood  Expectations of salary increases  Requests for equity participation  Bonus payments without performance  Tenured mentality
  • 51.
    5151 What kind ofPay? Accountable Pay
  • 52.
    5252 5. Generate aMeasurable Return
  • 53.
    5353 How Do YouMeasure ROI on Pay? Calculate Your Productivity Profit
  • 54.
    5454 ROTRI™ Example: Item Amount CapitalAccount $20,000,000 Cost of Capital 12% Capital Charge $2,400,000 Operating Income $10,000,000 Productivity Profit $7,600,000 Total Rewards Investment $25,000,000 ROTRI™ 30.4% (ROTRI™ = Productivity Profit/Total Rewards Investment)
  • 55.
    5555 ROTRI™ Example: Item Figure CapitalAccount $20,000,000 Cost of Capital 12% Capital Charge $2,400,000 Operating Income $10,000,000 *Productivity Profit $7,600,000 Total Rewards Investment $25,000,000 ROTRI™ 30.4% (ROTRI™ = Productivity Profit/Total Rewards Investment) *Variable Pay Plans (Value Sharing) are financed from Productivity Profit
  • 56.
    5656 Shareholder Value Current EquityValueEOY 10% GR (Threshold) 11% GR 12% GR 13% GR 14% GR 15% GR 25,000,000 1 27,500,000 27,750,000 28,000,000 28,250,000 28,500,000 28,750,000 15 104,431,204 119,614,737 136,839,144 156,356,759 178,448,449 203,426,541 Incremental increase in value 15,183,533 17,224,407 19,517,615 22,091,690 24,978,091 CumValue Increase Above Threshold 15,183,533 32,407,940 51,925,555 74,017,245 98,995,336 % Shared 10% 15% 20% 25% 30% $ Shared 1,518,353 4,861,191 10,385,111 18,504,311 29,698,601 Net Increase for SH 13,665,180 27,546,749 41,540,444 55,512,934 69,296,736 New SH Value 118,096,384 131,977,953 145,971,648 159,944,138 173,727,940 IRR 10.9% 11.7% 12.5% 13.2% 13.8%
  • 57.
    5757 6. Reflects aWealth Multiplier Philosophy
  • 58.
    5858 Wealth Multipliers vs.Wealth Creators Wealth Creators  Profitability focus  Recruit to skills and experience  Pay is an expense to be managed  Salaries and total pay should be “at market”  “Pay-for- performance” Wealth Multipliers  Accelerate value creation  Recruit premier talent that fits performance framework  Pay is an investment that should produce a growing return  Market pay for bench marking but pay philosophy drive comp strategy  Sharing value with value creators
  • 59.
    5959 The Value ofProfit Wealth Multiplier Profits Future Business Employees Shareholders
  • 60.
    6060 A Sense ofPartnership Translates to a Growth Multiple The Value of Profit Wealth Multiplier Profits ShareholdersFuture Business Employees
  • 61.
  • 62.
    6262 Keith Williams Assumed leadership of UL in 2005  Company carrying considerable debt  Losing market share  Low employee morale  UL had become bureaucratic and “siloed”
  • 63.
    6363 Core Changes Shiftfrom “Incentives” to “Value Sharing”  Took away local measurements driving management incentive plans—all paid on same metrics  “We live together and we die together”  Aligned everyone behind company success  “I call it ‘pay the company first.’ ”
  • 64.
    6464 Pay the CompanyFirst “Basically, up to the company’s operating profit target, all of the profits go to the company; and only after that target is met, do we start funding the incentive pool.” Example: If UL’s target is $80 million--  100% of first $80 in profit goes to company  The next $20 million goes to the incentive pool  From there on, 50/50 between company & incentive pool
  • 65.
    6565 Pay the CompanyFirst Once value creation is defined, compensation can follow a formula for sharing value in a way that aligns key producers with shareholder priorities.
  • 66.
    6666 The 6 Criteria 1.Supports the Performance Framework 2. Attracts Premier Talent 3. Creates a Stewardship Mindset 4. Contributes to a Performance Culture 5. Generates a Measurable Return 6. Reflects a Wealth Multiplier Philosophy
  • 67.
    6767 Who Benefits? Shareholders  Magnetfor premier talent  Perpetuate growth  Increased business value  Legacy of opportunity  Accelerated wealth accumulation Stakeholders  Associated with a winner  Positive work environment  Personal and professional development  Financial rewards