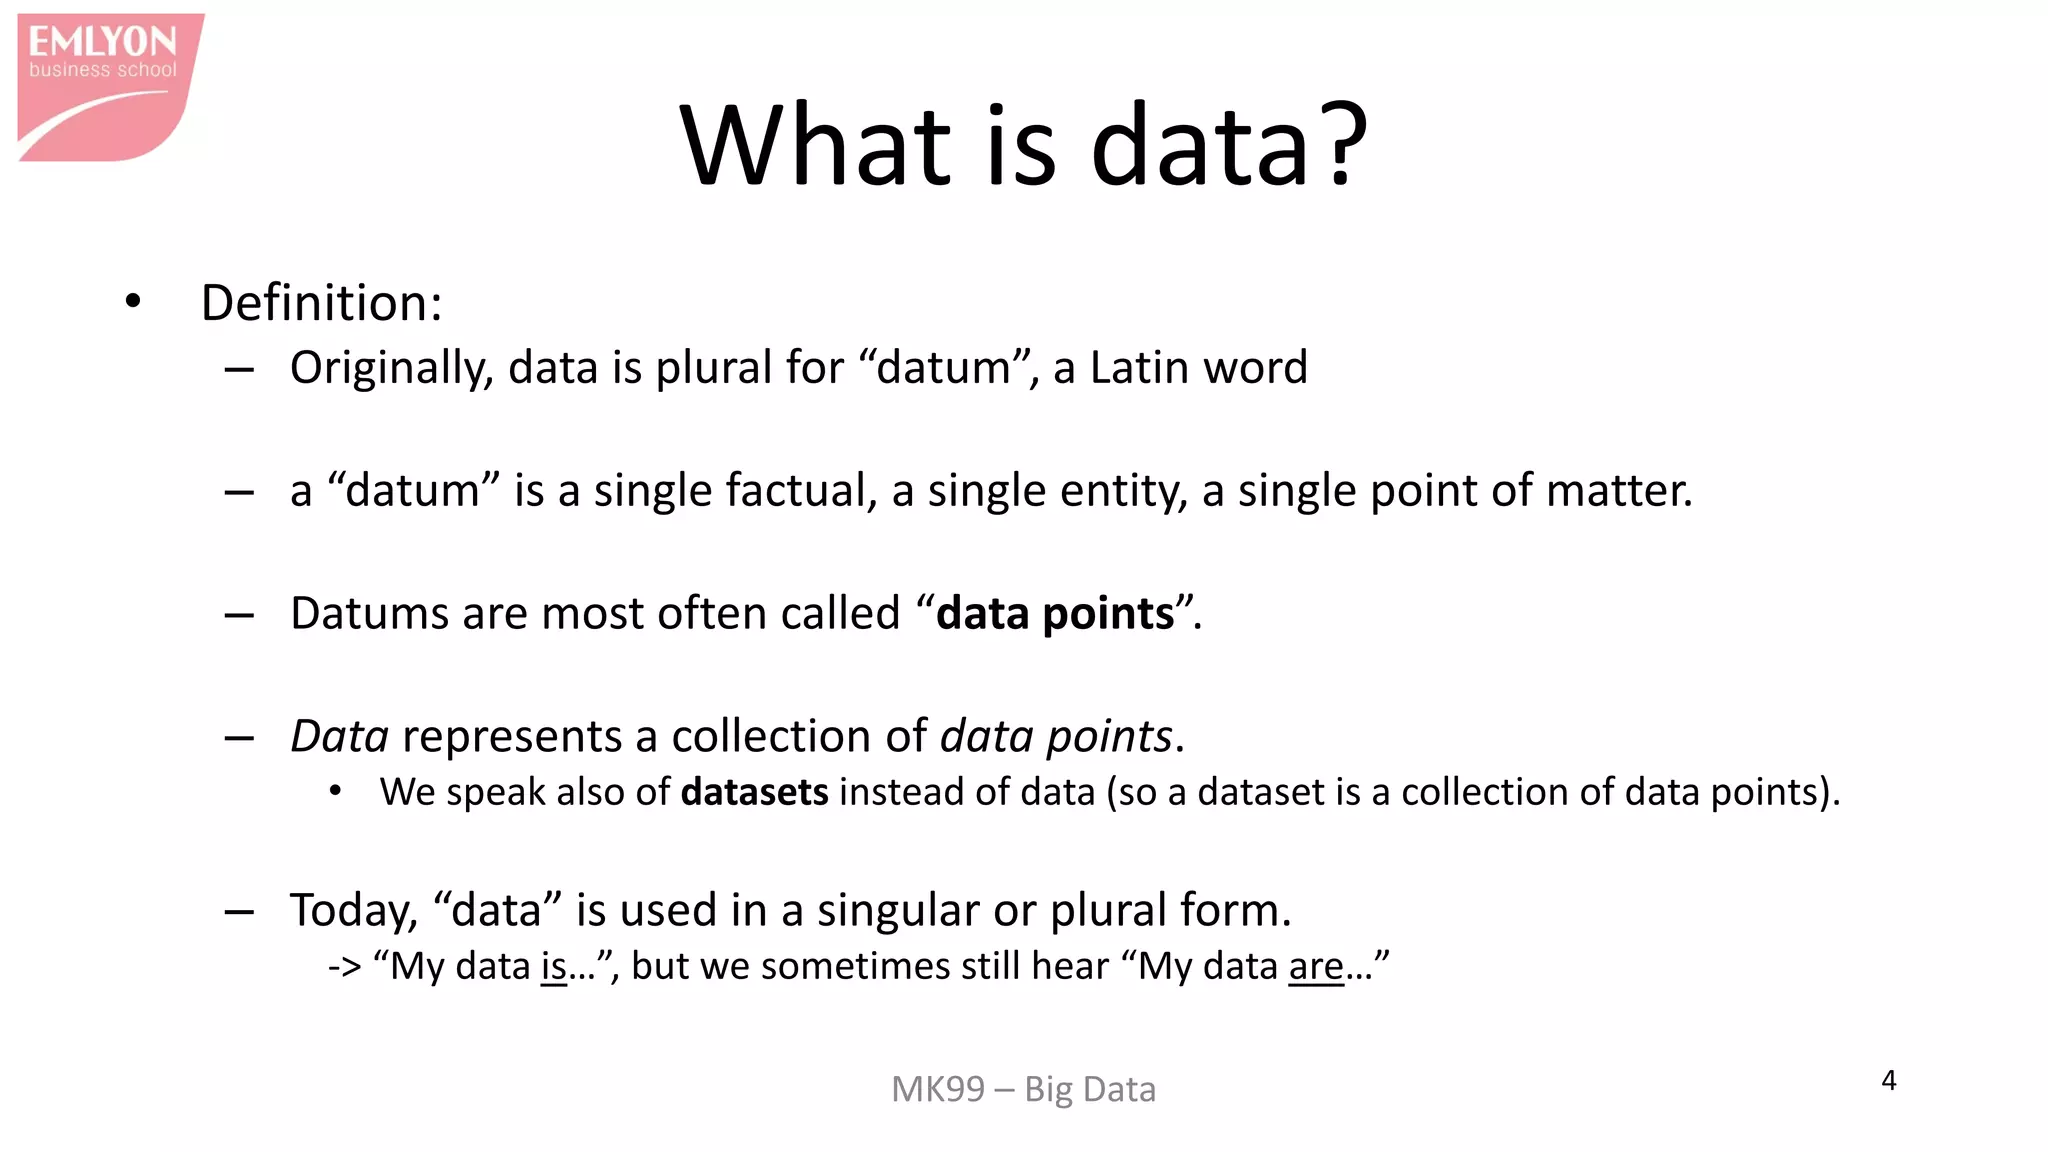
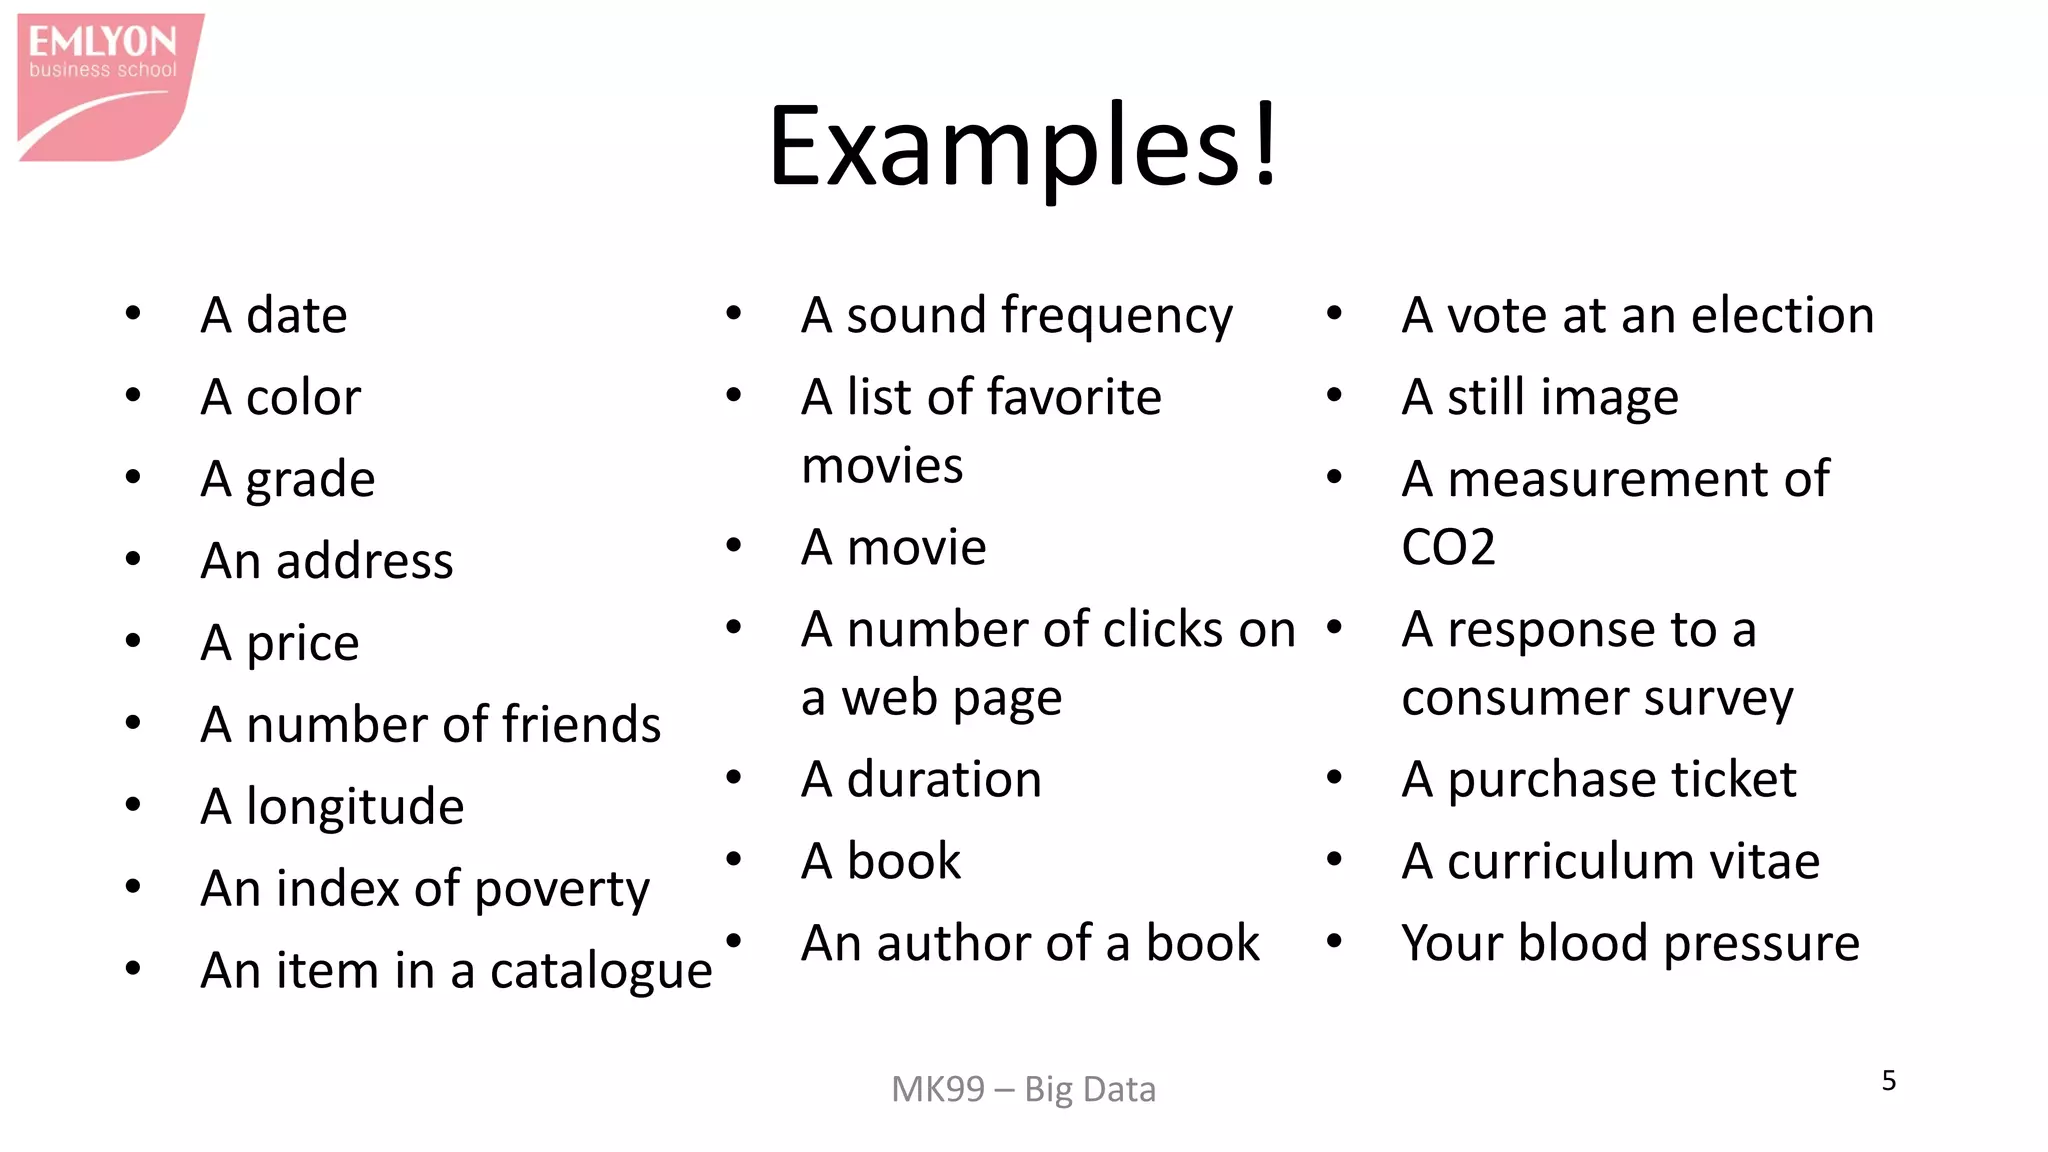
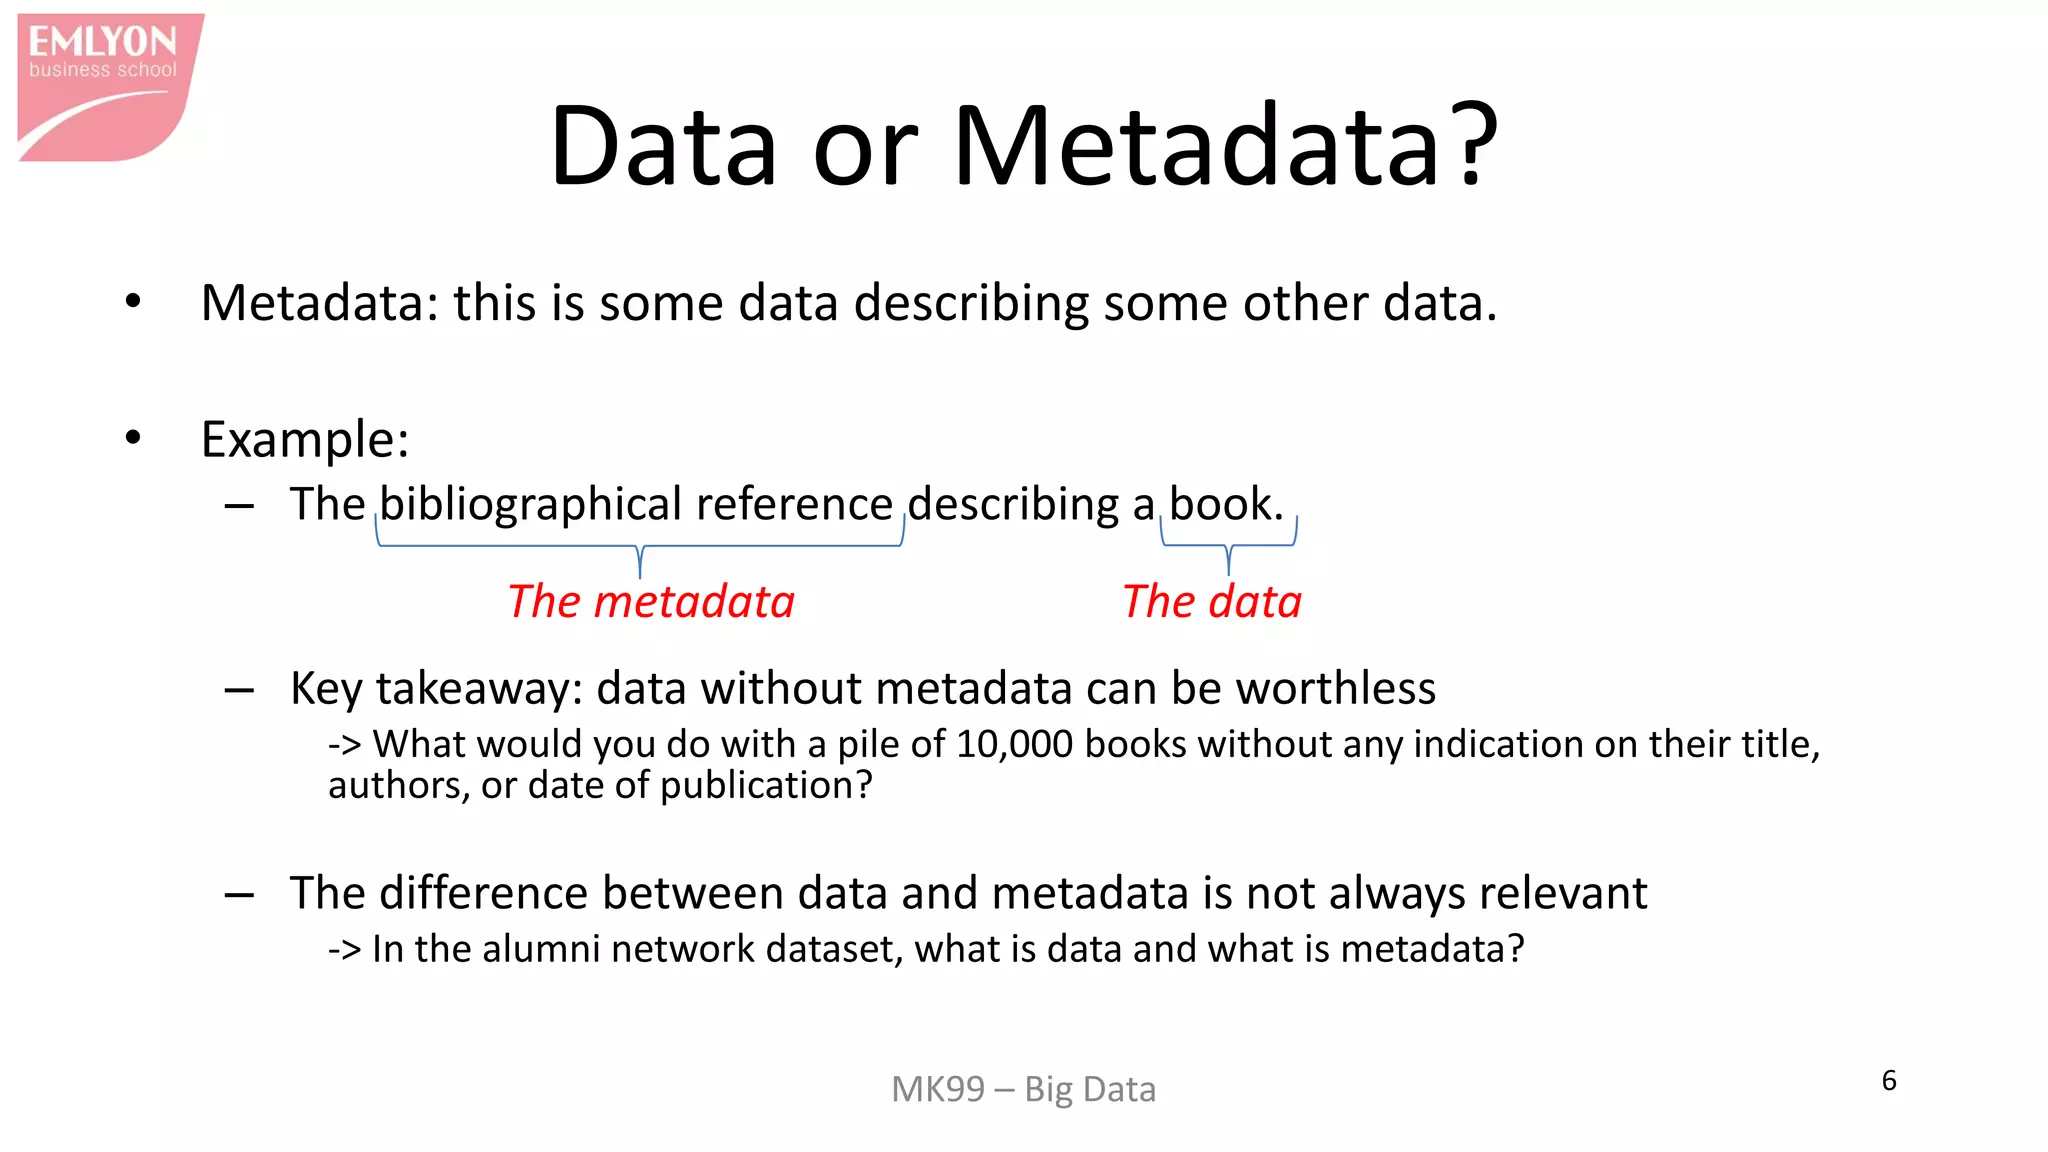
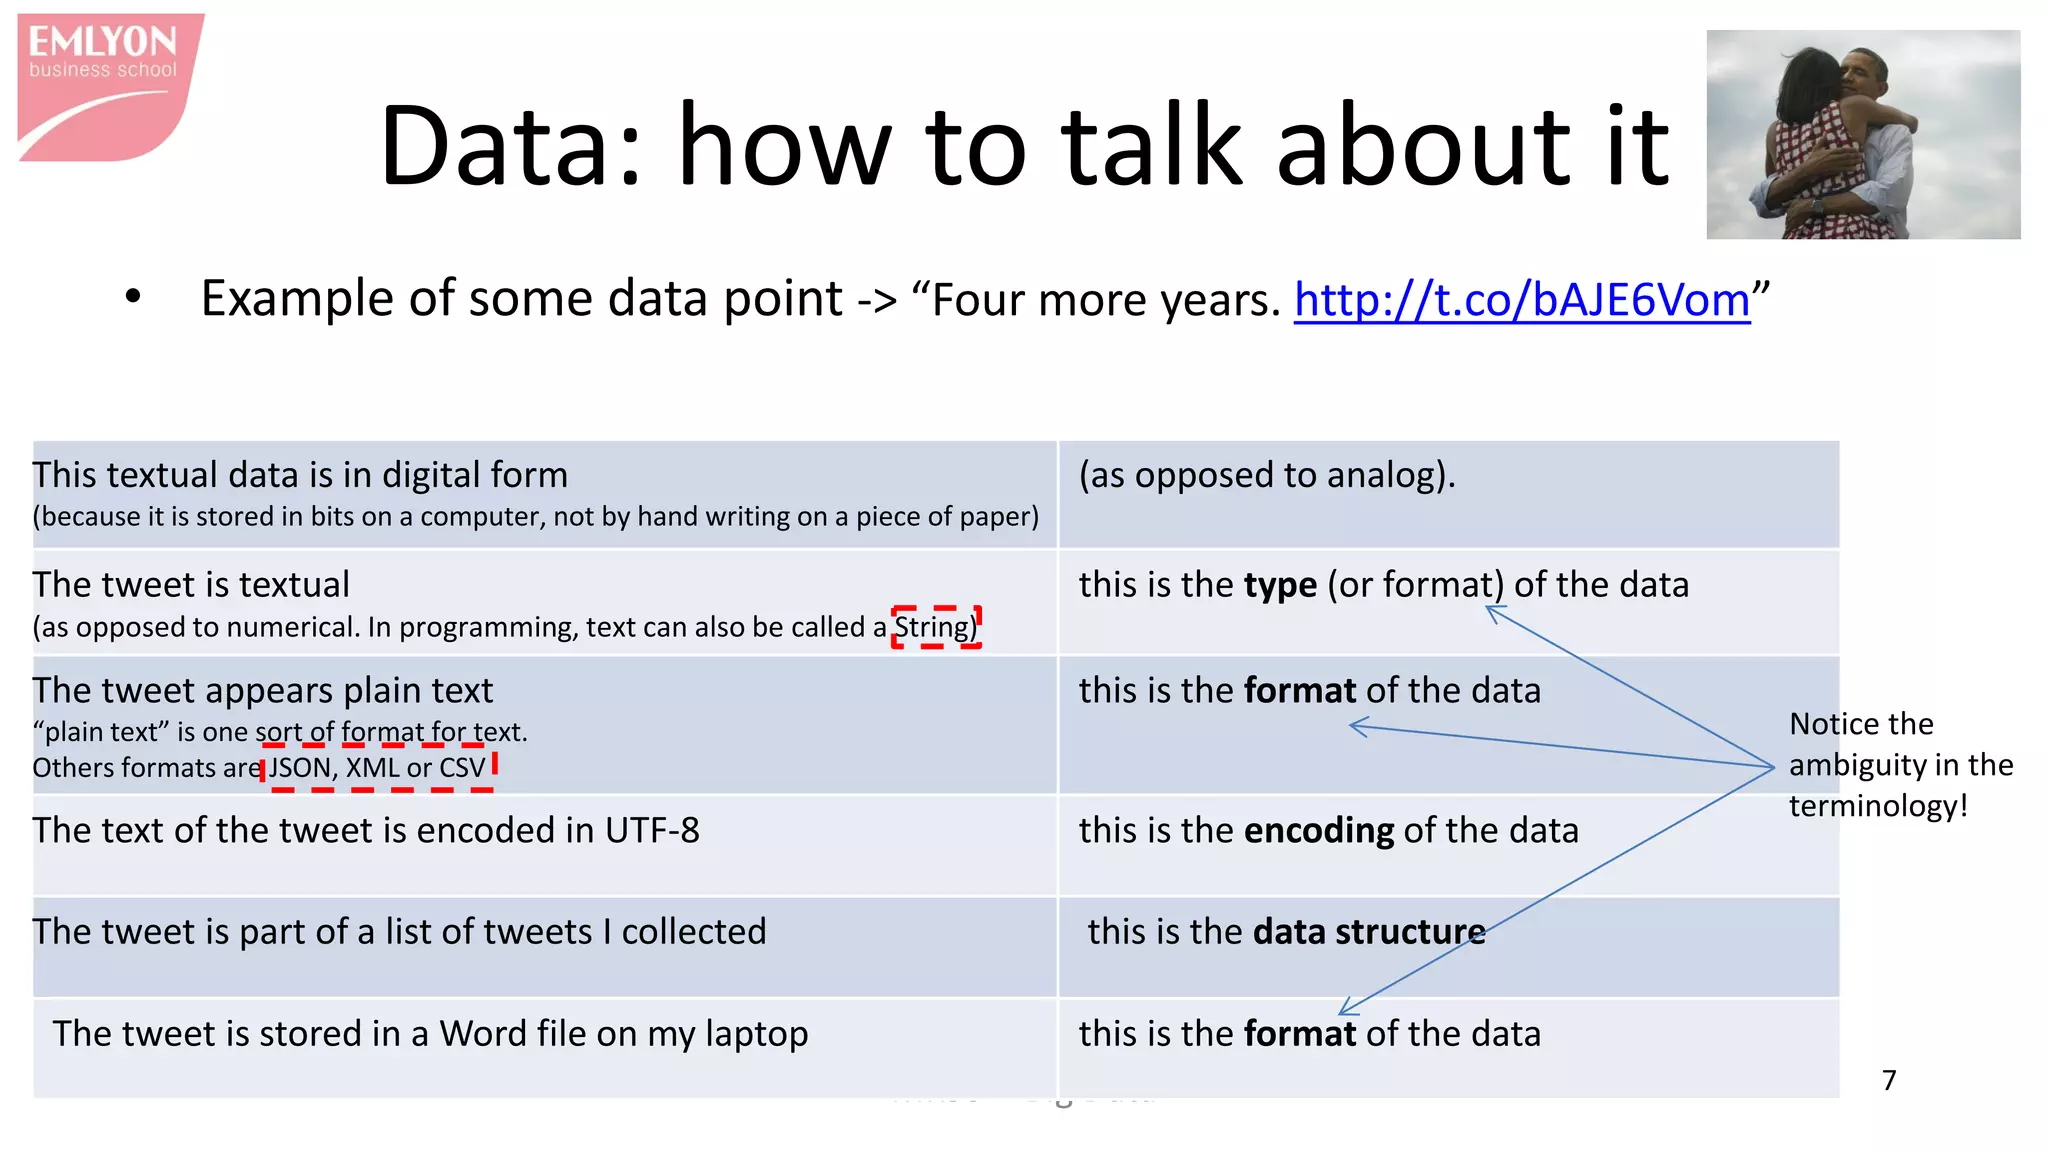
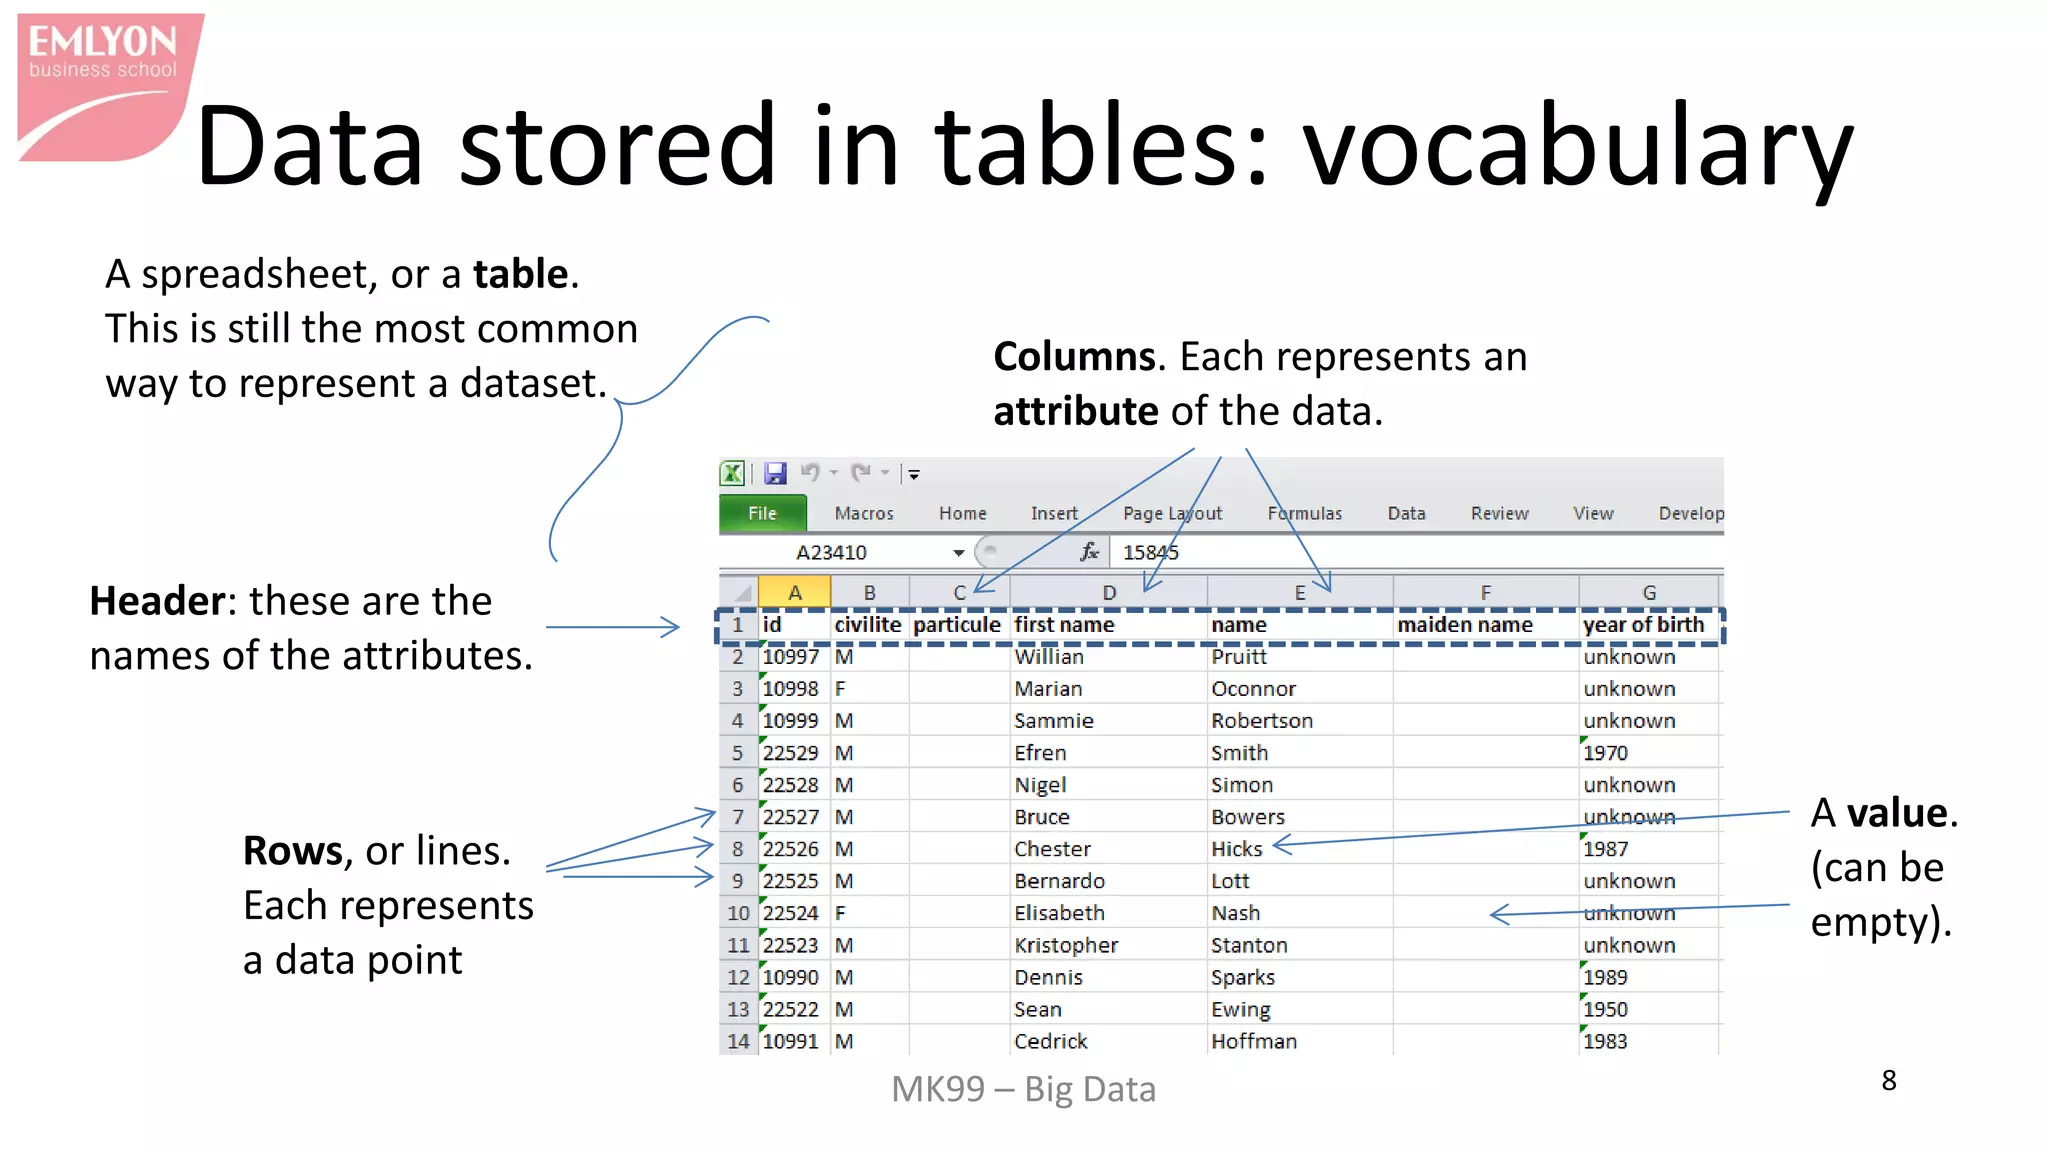
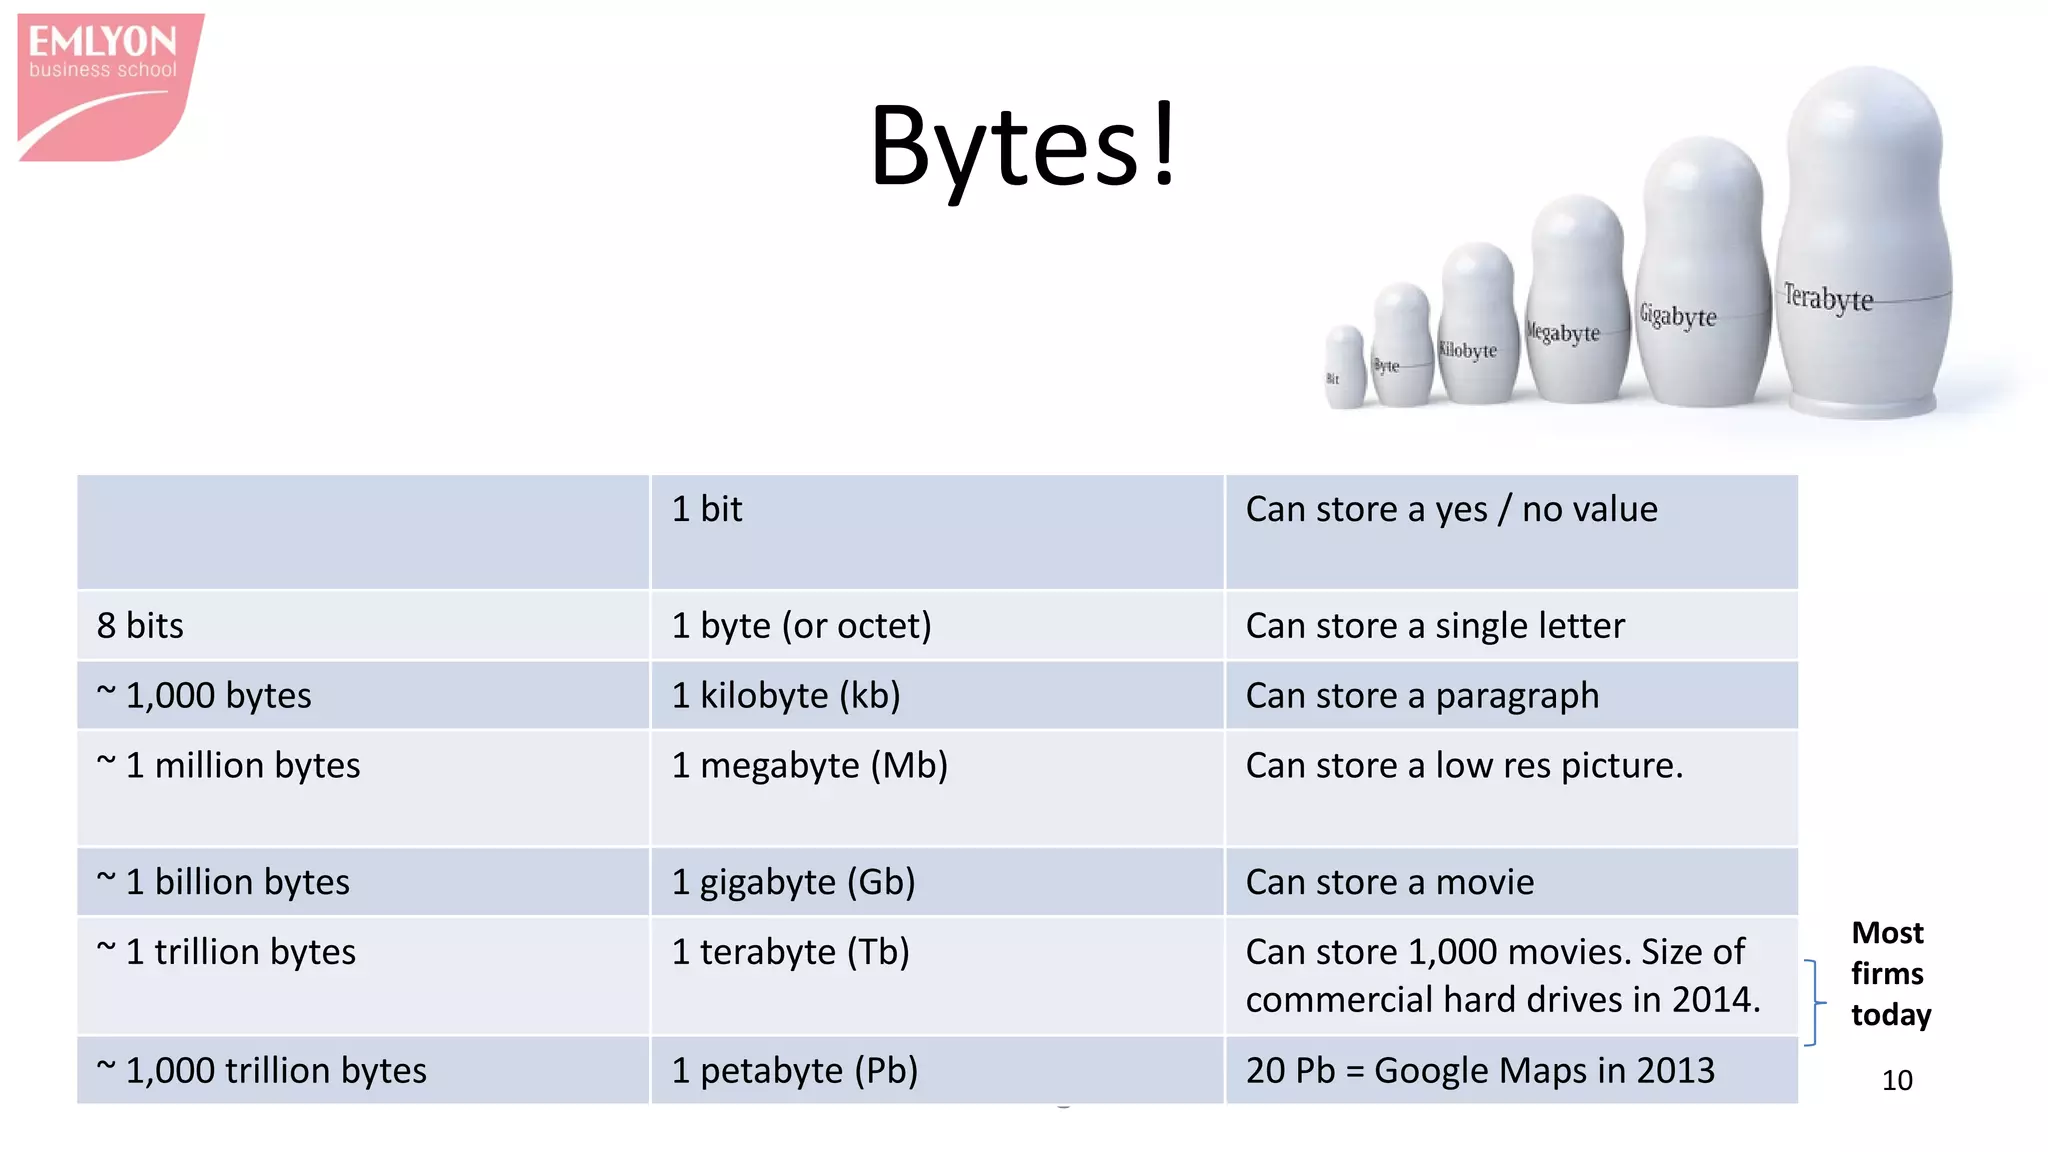
This document provides an introduction to key concepts related to big data including:
- It defines what data is, including that it originally referred to plural "data points" and now can be used singularly or plurally. Examples of different types of data are given.
- Metadata is introduced as "data describing other data" and its importance is highlighted.
- Different ways of talking about data are explored, including whether it is digital or analog, textual or numerical, its format, encoding, structure, and where it is stored.
- How data is often stored and represented in tables with rows, columns, headers and values is covered.
- The size of data and different units of measurement like
3 pillars of big data : structured data, semi structured data and unstructure...PROWEBSCRAPER
There are 3 pillars of Big Data
1.Structured data
2.Unstructured data
3.Semi structured data
Businesses worldwide construct their empire on these three pillars and capitalize on their limitless potential.
3 pillars of big data : structured data, semi structured data and unstructure...PROWEBSCRAPER
There are 3 pillars of Big Data
1.Structured data
2.Unstructured data
3.Semi structured data
Businesses worldwide construct their empire on these three pillars and capitalize on their limitless potential.
This slide deck gives a general overview of Data Visualization, with inspiring examples, the strength and weaknesses of the human visual system, a few technical frameworks that may be used for creating your own visualizations and some design concepts from the data visualization field.
Big Data - The 5 Vs Everyone Must KnowBernard Marr
This slide deck, by Big Data guru Bernard Marr, outlines the 5 Vs of big data. It describes in simple language what big data is, in terms of Volume, Velocity, Variety, Veracity and Value.
This presentation gives the idea about Data Preprocessing in the field of Data Mining. Images, examples and other things are adopted from "Data Mining Concepts and Techniques by Jiawei Han, Micheline Kamber and Jian Pei "
Data modeling is a process used to define and analyze data requirements needed to support the business processes within the scope of corresponding information systems in organizations.
It is an introduction to Data Analytics, its applications in different domains, the stages of Analytics project and the different phases of Data Analytics life cycle.
I deeply acknowledge the sources from which I could consolidate the material.
Our regular Introduction to Data Management (DM) workshop (90-minutes). Covers very basic DM topics and concepts. Audience is graduate students from all disciplines. Most of the content is in the NOTES FIELD.
Understanding data type is an important concept in statistics, when you are designing an experiment, you want to know what type of data you are dealing with, that will decide what type of statistical analysis, visualizations and prediction algorithms could be used.
#data #data types #ai #machine learning #statistics #data science #data analytics #artificial intelligence
What’s The Difference Between Structured, Semi-Structured And Unstructured Data?Bernard Marr
There are three classifications of data: structured, semi-structured and unstructured. While structured data was the type used most often in organizations historically, artificial intelligence and machine learning have made managing and analysing unstructured and semi-structured data not only possible, but invaluable.
This lecture gives various definitions of Data Mining. It also gives why Data Mining is required. Various examples on Classification , Cluster and Association rules are given.
Exploratory data analysis data visualization:
Exploratory Data Analysis (EDA) is an approach/philosophy for data analysis that employs a variety of techniques (mostly graphical) to
Maximize insight into a data set.
Uncover underlying structure.
Extract important variables.
Detect outliers and anomalies.
Test underlying assumptions.
Develop parsimonious models.
Determine optimal factor settings
A short presentation to introduce the idea of research data and why looking after data is important.
Notes to accompany the slides will be made available via www.lib.cam.ac.uk/dataman.
Présentation FrenchWeb: Qu'est-ce que la visualisation des données?Clement Levallois
Slides du Webinar FrenchWeb par Clément Levallois.
Pour en savoir plus:
https://executive.em-lyon.com/Formations/Certificats/EMS02-Transformation-Digitale-des-Organisations
Topics covered at the workshop address basic questions related to Research Data Management for open data, which include preparing a Research Data Management (RDM) plan, licensing data and intellectual property, metadata and contextual description (documentation), ethical and legal aspects of sharing sensitive or confidential data, anonymizing research data for reuse, data archiving and long-term preservation, and data security and storage.
Event: http://conferences.nib.si/AS2015/default.htm
Related material: http://conferences.nib.si/AS2015/BookAS15.pdf
Reserve Bank Of India is the Apex Bank of India responsible to take care of banking and credit system of the country.Its main function is to form the monetary policies and rules and regulations for efficient and transparent banking system..
Slides of the course on big data by C. Levallois from EMLYON Business School.
For business students. Check the online video connected with these slides.
-> The 5 driving forces behind big data.
Data Management for Librarians: An IntroductionGarethKnight
Slides from a training session given to librarians on data management. The session was intended to help librarians to consider the challenges associated with maintaining research data and steps that may be taken to address these issues. It was also used to discuss their role in supporting data management activities within LSHTM
There are many examples of text-based documents (all in ‘electronic’ format…)
e-mails, corporate Web pages, customer surveys, résumés, medical records, DNA sequences, technical papers, incident reports, news stories and more…
Not enough time or patience to read
Can we extract the most vital kernels of information…
So, we wish to find a way to gain knowledge (in summarised form) from all that text, without reading or examining them fully first…!
Some others (e.g. DNA seq.) are hard to comprehend!
Multi-Model Data Query Languages and Processing ParadigmsJiaheng Lu
Specifying users' interests with a formal query language is a typically challenging task, which becomes even harder in the context of multi-model data management because we have to deal with data variety. It usually lacks a unified schema to help the users issuing their queries, or has an incomplete schema as data come from disparate sources. Multi-Model DataBases (MMDBs) have emerged as a promising approach for dealing with this task as they are capable of accommodating and querying the multi-model data in a single system. This tutorial aims to offer a comprehensive presentation of a wide range of query languages for MMDBs and to make comparisons of their properties from multiple perspectives. We will discuss the essence of cross-model query processing and provide insights on the research challenges and directions for future work. The tutorial will also offer the participants hands-on experience in applying MMDBs to issue multi-model data queries.
Semi-automated Exploration and Extraction of Data in Scientific TablesElsevier
Ron Daniel and Corey Harper of Elsevier Labs present at the Columbia University Data Science Institute: https://www.elsevier.com/connect/join-us-as-elsevier-data-scientists-present-at-columbia-university
Cambridge Nationals R001 Revision lesson - for more details & resources see http://1000computing.wordpress.com/2014/11/18/the-thing-with-cambridge-nationals-lesson-resources/
Part 2: covid-19 on Twitter, with a focus on 3 new seed accountsClement Levallois
First part of the analysis chose to picture the global conversation on Twitter by picking 3 accounts in Italian, Spanish and English languages.
We identified several clusters gathering professional epidemiologists.
In this follow up, we run a new analysis where the starting points are 3 Twitter accounts of epidemiologists that were found in these clusters. The end goal is to identify many more epidemiologists.
Presentation of programming languages for beginnersClement Levallois
For beginners, a description of the main programming languages and what they can be used for. Includes Java, Swift, Python, R, Ruby, Javascript, C, C#, Objective C.
A report on a classroom experiment at em Lyon Business School. 90 students will build a sentiment analysis tool for tweets, in 8 languages.
This slidedeck is a report on theproject for the conference on "Digital Labor and data science", held in Paris on Oct 21, 2016.
-> http://www.dlids.org
Dans le cadre de la présentation du programme "Transformation Digitale des Organisations", lancé en 2017 par em Lyon Business School et Visiativ:
https://executive.em-lyon.com/Formations/Diplomes/EMS02-Programme-Transformation-Digitale-des-Organisations#index
Slides of the course on big data by Clement Levallois from EMLYON Business School.
For business students. Check the online video connected with these slides.
-> Machine learning explained in simple terms to a business audience: what is a training set, a test set, and how does machine learning differ from statistics.
Slides of the course on big data by Clement Levallois from EMLYON Business School.
For business students. Check the online video connected with these slides.
-> An exploration of the opportunities and limits that data brings to personalization.
Slides of the course on big data by C. Levallois from EMLYON Business School.
For business students. Check the online video connected with these slides.
-> Definition of text mining, the main categories of tools available (such as topic categorization or sentiment analysis) and their use for business.
Slides of the course on big data by C. Levallois from EMLYON Business School.
For business students. Check the online video connected with these slides.
-> Definition of data integration / fragmentation in a multichannel marketing environment. Explanation of the business stakes of data integration.
Francesca Gottschalk - How can education support child empowerment.pptxEduSkills OECD
Francesca Gottschalk from the OECD’s Centre for Educational Research and Innovation presents at the Ask an Expert Webinar: How can education support child empowerment?
Introduction to AI for Nonprofits with Tapp NetworkTechSoup
Dive into the world of AI! Experts Jon Hill and Tareq Monaur will guide you through AI's role in enhancing nonprofit websites and basic marketing strategies, making it easy to understand and apply.
Embracing GenAI - A Strategic ImperativePeter Windle
Artificial Intelligence (AI) technologies such as Generative AI, Image Generators and Large Language Models have had a dramatic impact on teaching, learning and assessment over the past 18 months. The most immediate threat AI posed was to Academic Integrity with Higher Education Institutes (HEIs) focusing their efforts on combating the use of GenAI in assessment. Guidelines were developed for staff and students, policies put in place too. Innovative educators have forged paths in the use of Generative AI for teaching, learning and assessments leading to pockets of transformation springing up across HEIs, often with little or no top-down guidance, support or direction.
This Gasta posits a strategic approach to integrating AI into HEIs to prepare staff, students and the curriculum for an evolving world and workplace. We will highlight the advantages of working with these technologies beyond the realm of teaching, learning and assessment by considering prompt engineering skills, industry impact, curriculum changes, and the need for staff upskilling. In contrast, not engaging strategically with Generative AI poses risks, including falling behind peers, missed opportunities and failing to ensure our graduates remain employable. The rapid evolution of AI technologies necessitates a proactive and strategic approach if we are to remain relevant.
Model Attribute Check Company Auto PropertyCeline George
In Odoo, the multi-company feature allows you to manage multiple companies within a single Odoo database instance. Each company can have its own configurations while still sharing common resources such as products, customers, and suppliers.
Palestine last event orientationfvgnh .pptxRaedMohamed3
An EFL lesson about the current events in Palestine. It is intended to be for intermediate students who wish to increase their listening skills through a short lesson in power point.
Acetabularia Information For Class 9 .docxvaibhavrinwa19
Acetabularia acetabulum is a single-celled green alga that in its vegetative state is morphologically differentiated into a basal rhizoid and an axially elongated stalk, which bears whorls of branching hairs. The single diploid nucleus resides in the rhizoid.
Macroeconomics- Movie Location
This will be used as part of your Personal Professional Portfolio once graded.
Objective:
Prepare a presentation or a paper using research, basic comparative analysis, data organization and application of economic information. You will make an informed assessment of an economic climate outside of the United States to accomplish an entertainment industry objective.
How to Make a Field invisible in Odoo 17Celine George
It is possible to hide or invisible some fields in odoo. Commonly using “invisible” attribute in the field definition to invisible the fields. This slide will show how to make a field invisible in odoo 17.
Read| The latest issue of The Challenger is here! We are thrilled to announce that our school paper has qualified for the NATIONAL SCHOOLS PRESS CONFERENCE (NSPC) 2024. Thank you for your unwavering support and trust. Dive into the stories that made us stand out!
1. MK99 – Big Data 1
Big data
&
cross-platform analytics
MOOC lectures Pr. Clement Levallois
2. MK99 – Big Data 2
Note
• You will find terms squared like this in the slides.
• These terms are part of your quizz assignment for
the week, to be found on the online platform.
• Often technical terms, it is vital that you know
their meaning, as they are the basic vocabulary of
data science.
3. MK99 – Big Data 3
What you we learn here:
• The definition of data
• The many ways to speak about data.
4. MK99 – Big Data 4
What is data?
• Definition:
– Originally, data is plural for “datum”, a Latin word
– a “datum” is a single factual, a single entity, a single point of matter.
– Datums are most often called “data points”.
– Data represents a collection of data points.
• We speak also of datasets instead of data (so a dataset is a collection of data points).
– Today, “data” is used in a singular or plural form.
-> “My data is…”, but we sometimes still hear “My data are…”
5. MK99 – Big Data 5
Examples!
• A date
• A color
• A grade
• An address
• A price
• A number of friends
• A longitude
• An index of poverty
• An item in a catalogue
• A sound frequency
• A list of favorite
movies
• A movie
• A number of clicks on
a web page
• A duration
• A book
• An author of a book
• A vote at an election
• A still image
• A measurement of
CO2
• A response to a
consumer survey
• A purchase ticket
• A curriculum vitae
• Your blood pressure
6. MK99 – Big Data 6
Data or Metadata?
• Metadata: this is some data describing some other data.
• Example:
– The bibliographical reference describing a book.
– Key takeaway: data without metadata can be worthless
-> What would you do with a pile of 10,000 books without any indication on their title,
authors, or date of publication?
– The difference between data and metadata is not always relevant
-> In the alumni network dataset, what is data and what is metadata?
The metadata The data
7. MK99 – Big Data 7
Data: how to talk about it
• Example of some data point -> “Four more years. http://t.co/bAJE6Vom”
This textual data is in digital form
(because it is stored in bits on a computer, not by hand writing on a piece of paper)
(as opposed to analog).
The tweet is textual
(as opposed to numerical. In programming, text can also be called a String)
this is the type (or format) of the data
The tweet appears plain text
“plain text” is one sort of format for text.
Others formats are JSON, XML or CSV
this is the format of the data
The text of the tweet is encoded in UTF-8 this is the encoding of the data
The tweet is part of a list of tweets I collected this is the data structure
The tweet is stored in a Word file on my laptop this is the format of the data
Notice the
ambiguity in the
terminology!
8. MK99 – Big Data 8
Data stored in tables: vocabulary
Rows, or lines.
Each represents
a data point
Columns. Each represents an
attribute of the data.
Header: these are the
names of the attributes.
A value.
(can be
empty).
A spreadsheet, or a table.
This is still the most common
way to represent a dataset.
9. MK99 – Big Data 9
Data and size.
• The size of data gives an idea of what can be done with it and the
challenges it might pose.
• The size of a dataset can be expressed in number of datapoints.
– Often called lines because we store them as lines in a spreadsheet
• Or the size can be expressed in terms of the storage space the data
takes on a computer drive (see next slide).
– A dataset with 23,000 lines and 16 columns takes ~ 2.6Mb when
presented as an Excel file.
10. MK99 – Big Data 10
Bytes!
1 bit Can store a yes / no value
8 bits 1 byte (or octet) Can store a single letter
~ 1,000 bytes 1 kilobyte (kb) Can store a paragraph
~ 1 million bytes 1 megabyte (Mb) Can store a low res picture.
~ 1 billion bytes 1 gigabyte (Gb) Can store a movie
~ 1 trillion bytes 1 terabyte (Tb) Can store 1,000 movies. Size of
commercial hard drives in 2014.
~ 1,000 trillion bytes 1 petabyte (Pb) 20 Pb = Google Maps in 2013
Most
firms
today
11. MK99 – Big Data 11
Much more…
• Make the readings for Week 1.
• Watch the video on big data, also in Week 1.
• Start following #bigdata and #dataanalytics on
Twitter.