


![Page 34 of 107Page 34 of 107
4. Indicates permeability
5. Defines bed boundaries
6. Measures borehole size with caliper measurement
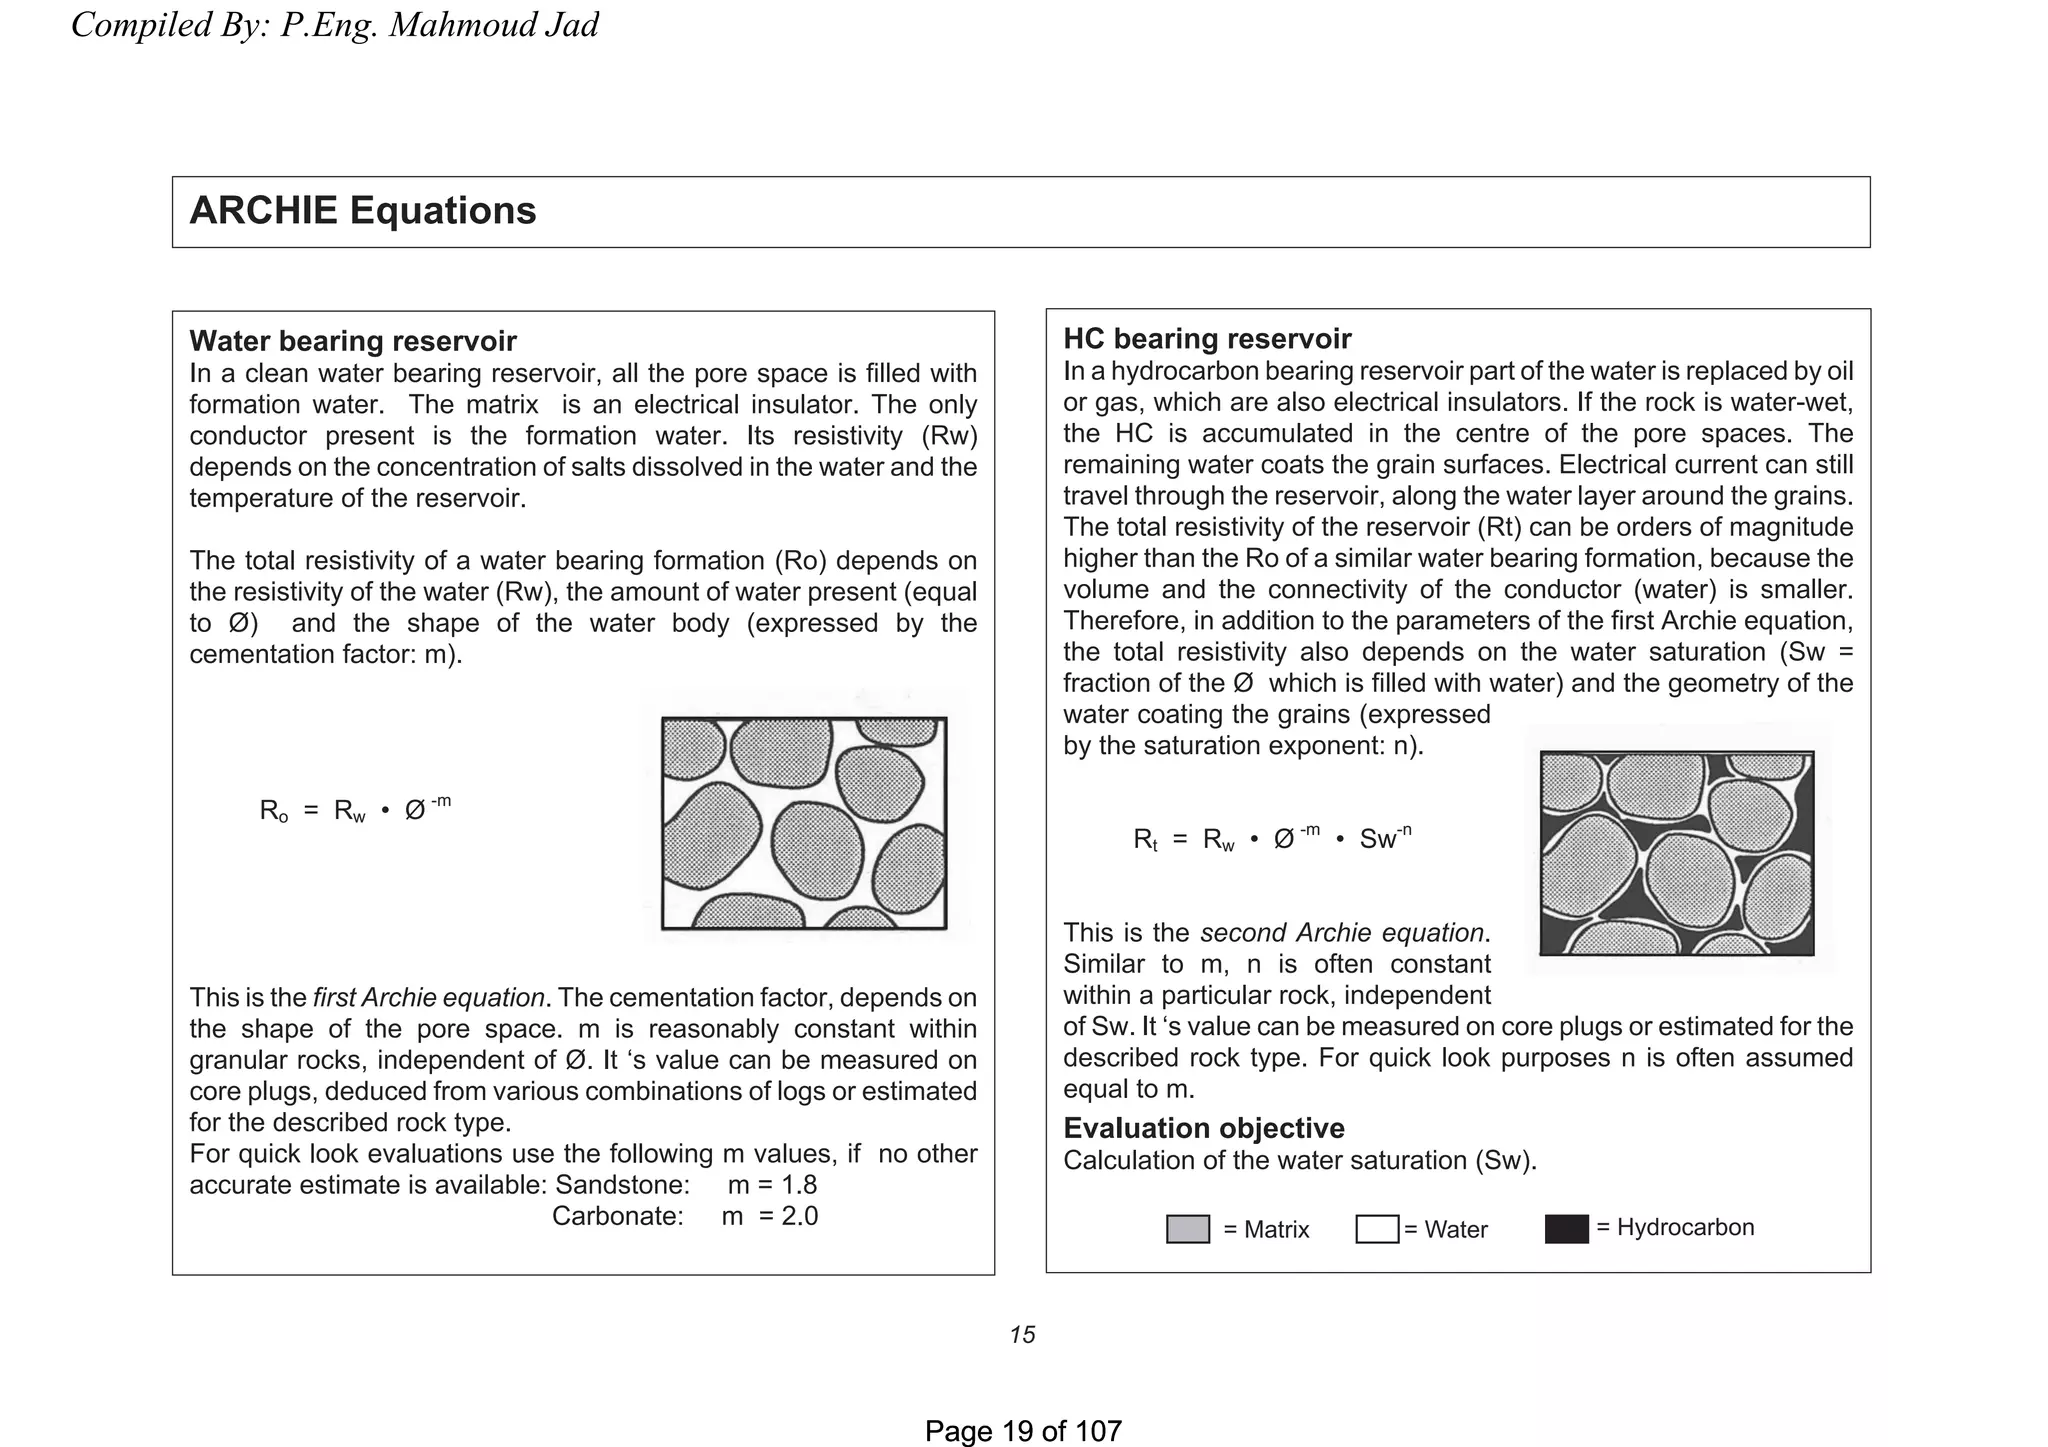
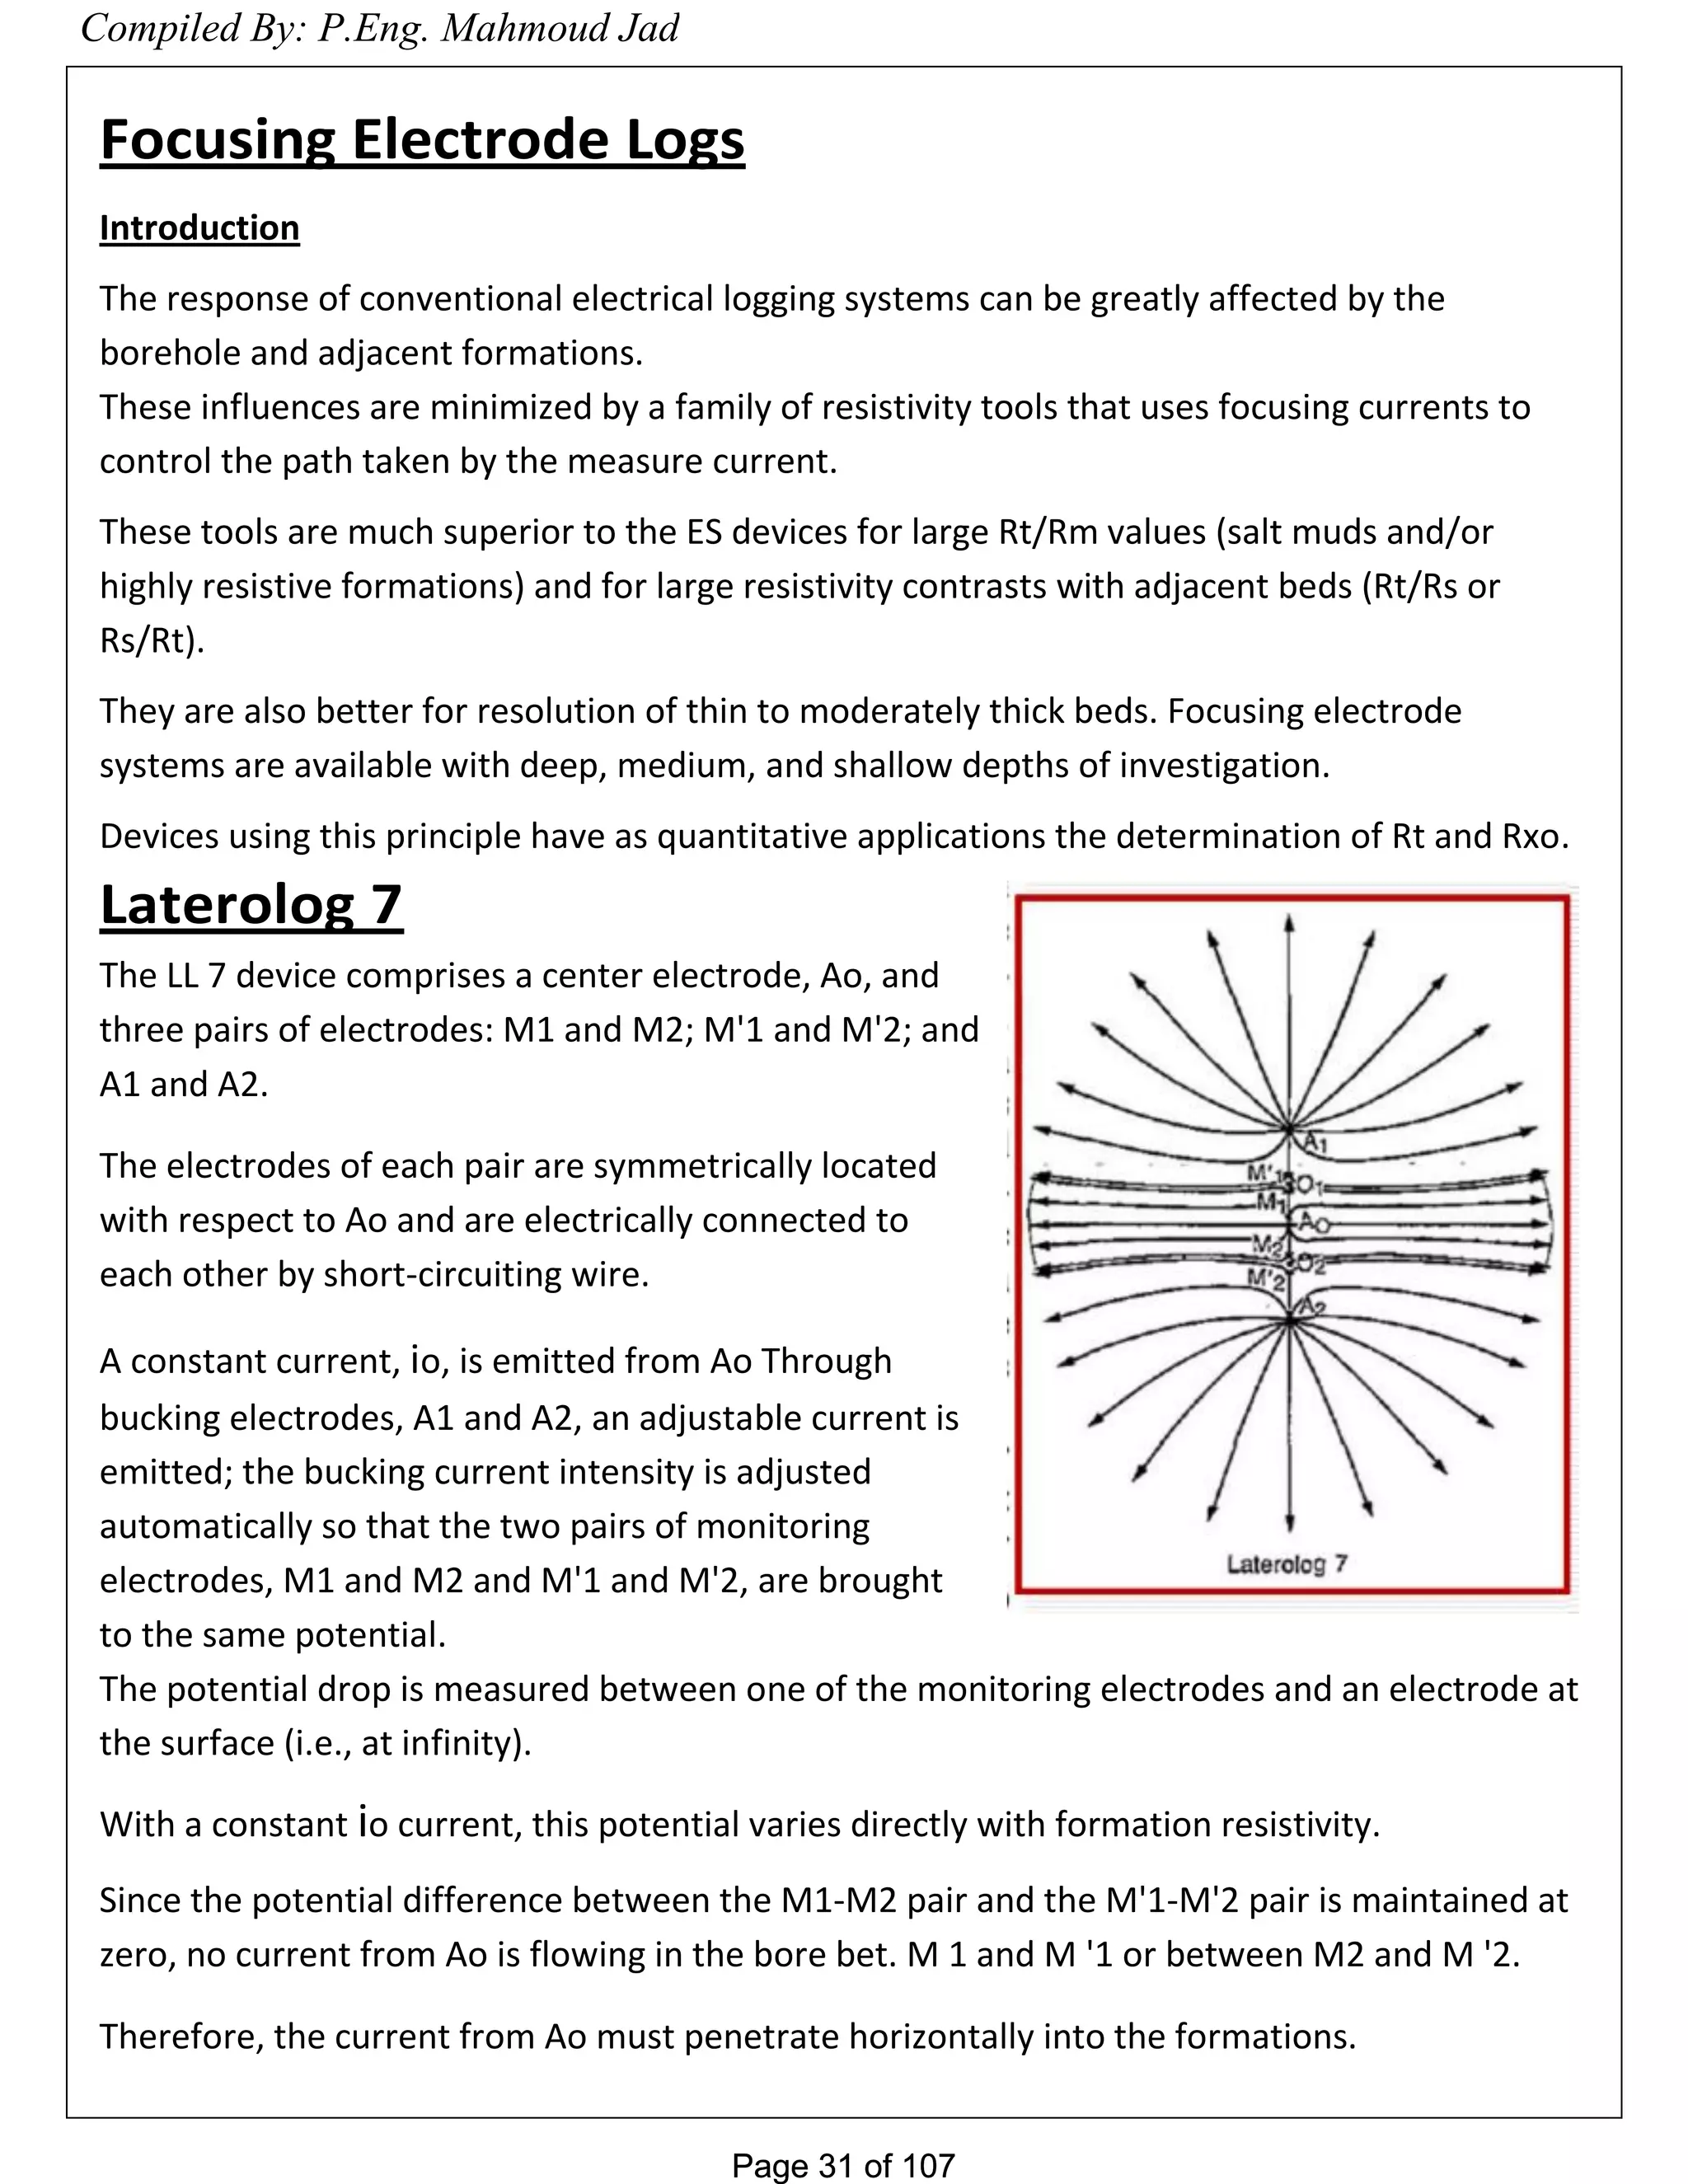
Microlog
An unfocused electrode device with small spacings, mounted on a pad and pressed against
the borehole wall.
The typical microlog has one current-emitting electrode and two measure electrodes in line
above it, one at 1 in. [2.5 cm], the other at 2 in. [5 cm].
The potential at the 2-in. electrode gives a 2-in. micro normal log.
The difference in potential between the two measure electrodes gives a 1-in. x 1-in. micro
inverse log.
The micronormal reads deeper than the micro inverse.
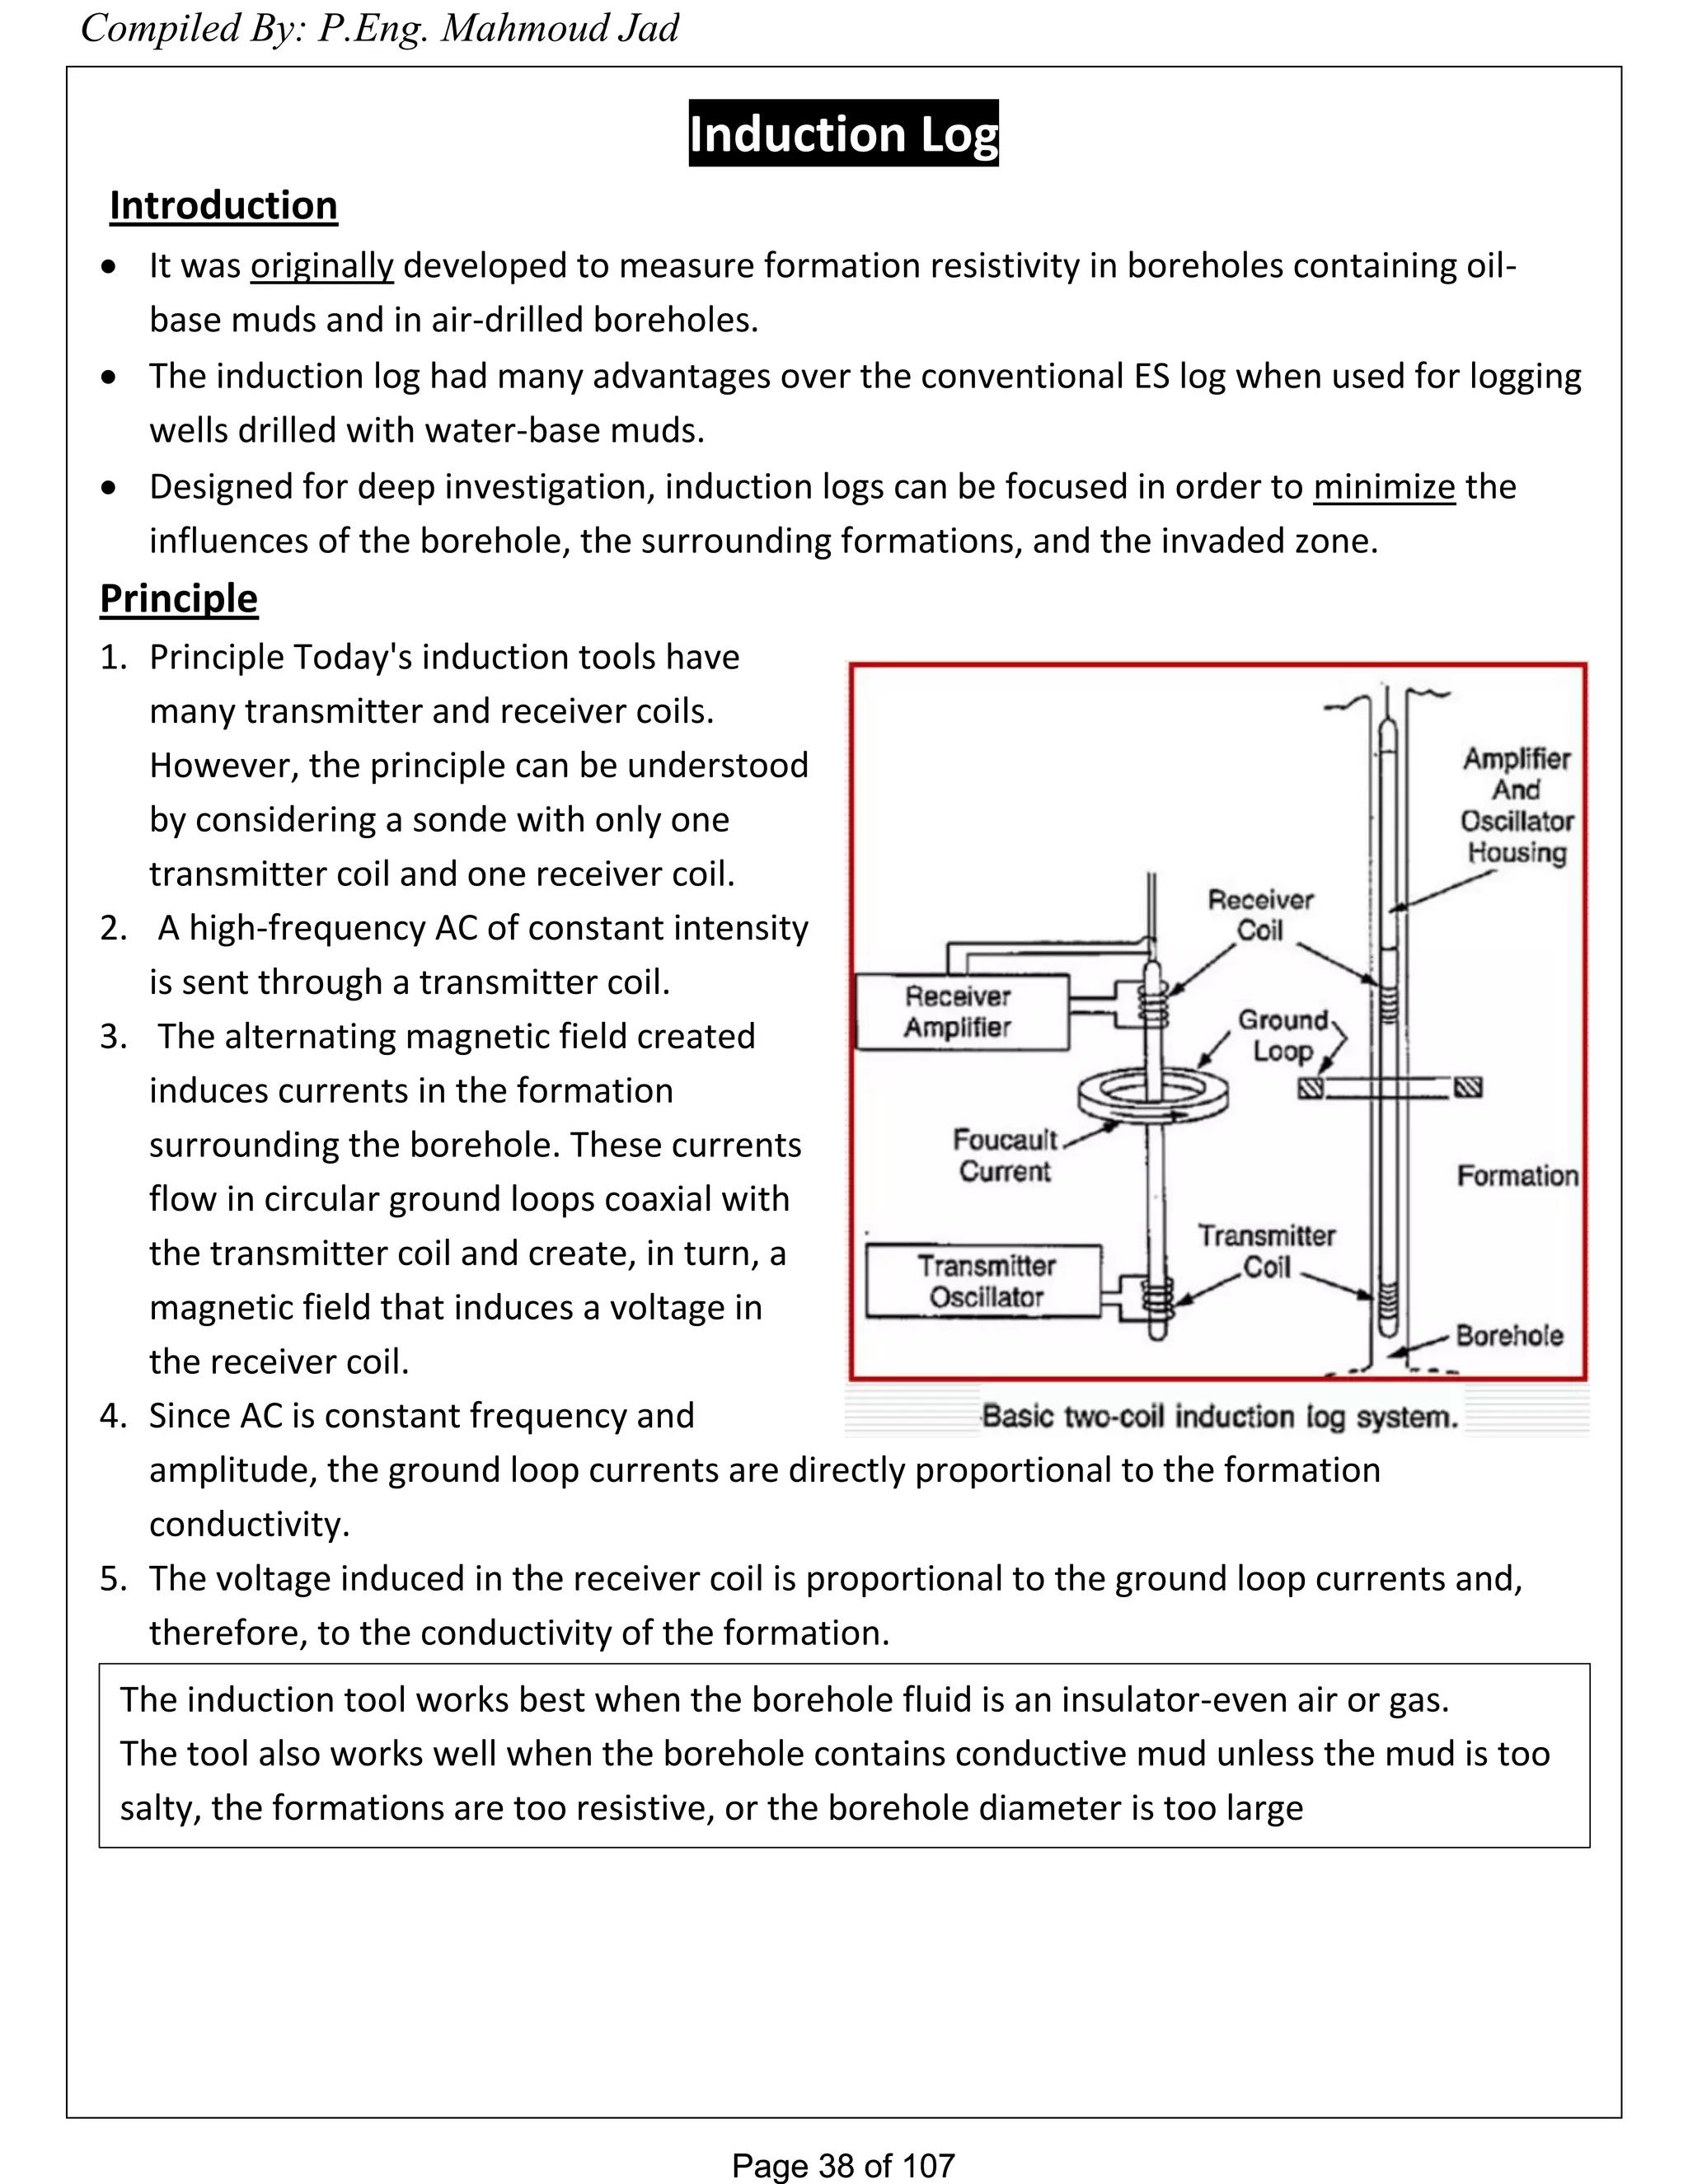
Principle
The rubber micro-log pad is pressed against the borehole wall by arms and springs.
The face of the pad has three small inline electrodes spaced 1 in. [2.5 cm] apart.
With these electrodes a 1- by 1-in. micro-inverse (R1'' x R1'') and a 2-in. [5.1 cm]
Micro-normal (R2") measurements are recorded simultaneously.
The currents emitted from these electrodes are totally unfocused and hence flow by the
path of least resistance.
Compiled By: P.Eng. Mahmoud Jad](https://image.slidesharecdn.com/welllogging-160320235331/75/Well-logging-34-2048.jpg)
![Page 35 of 107Page 35 of 107
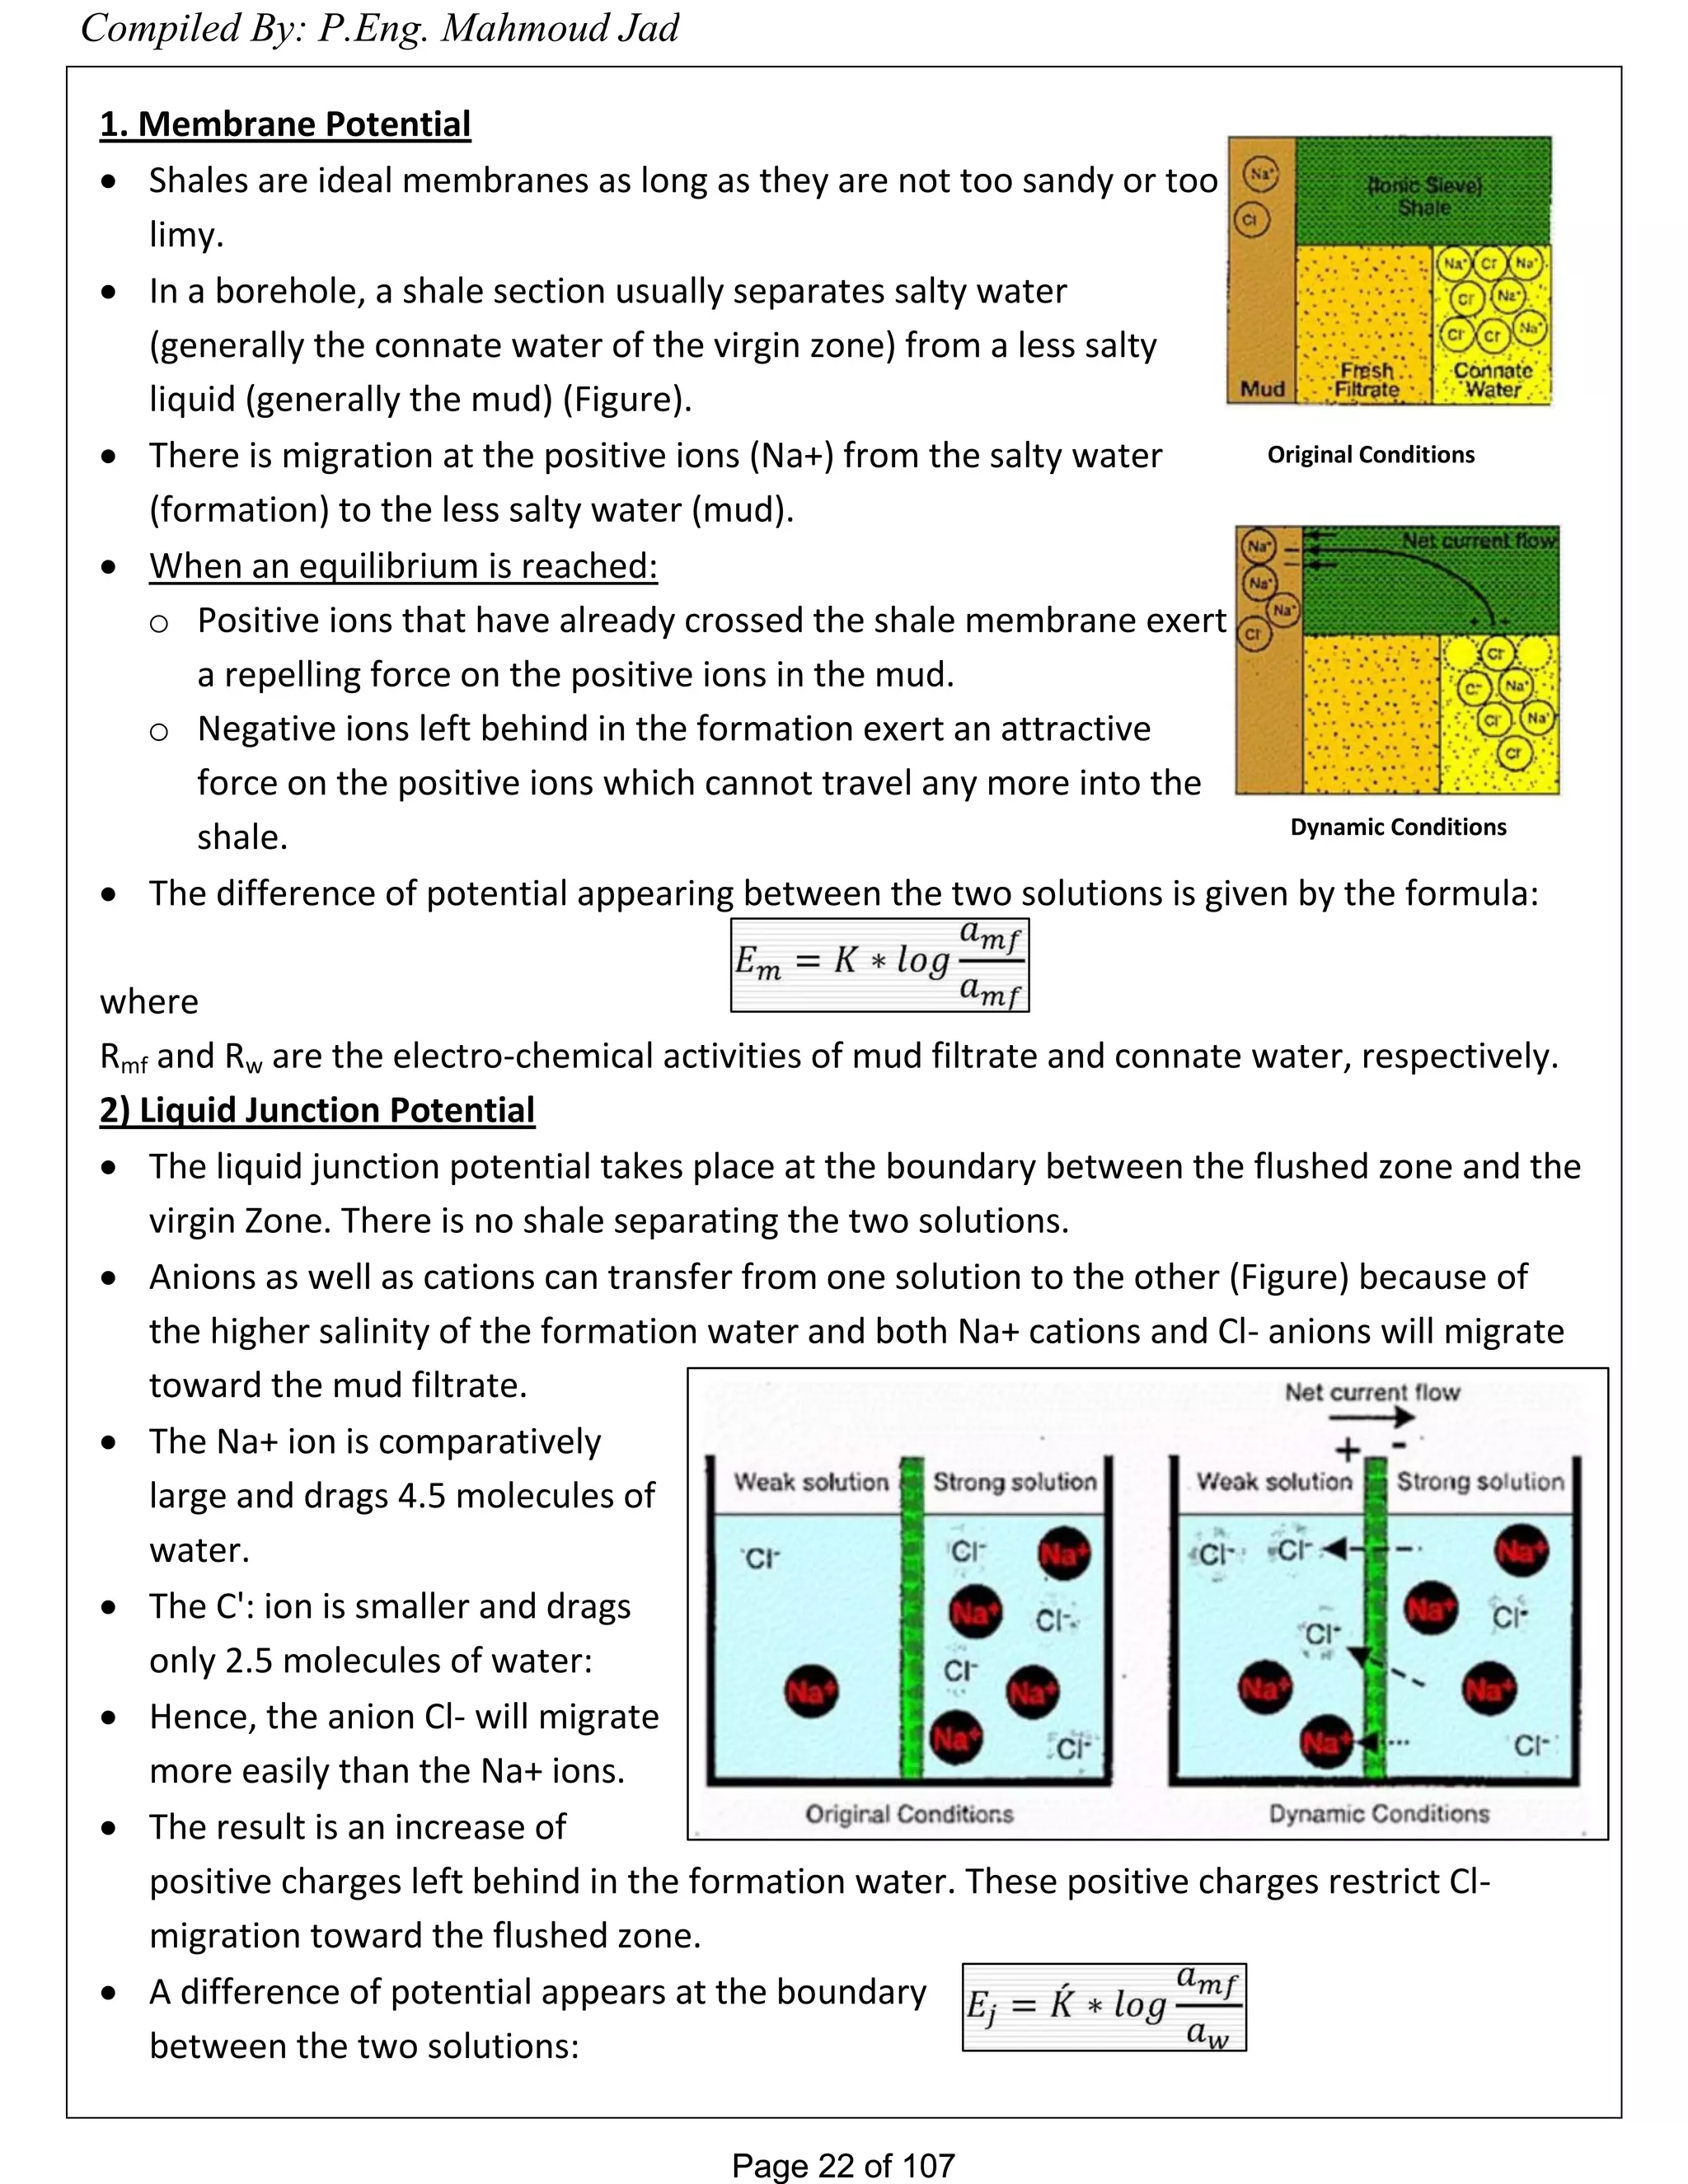
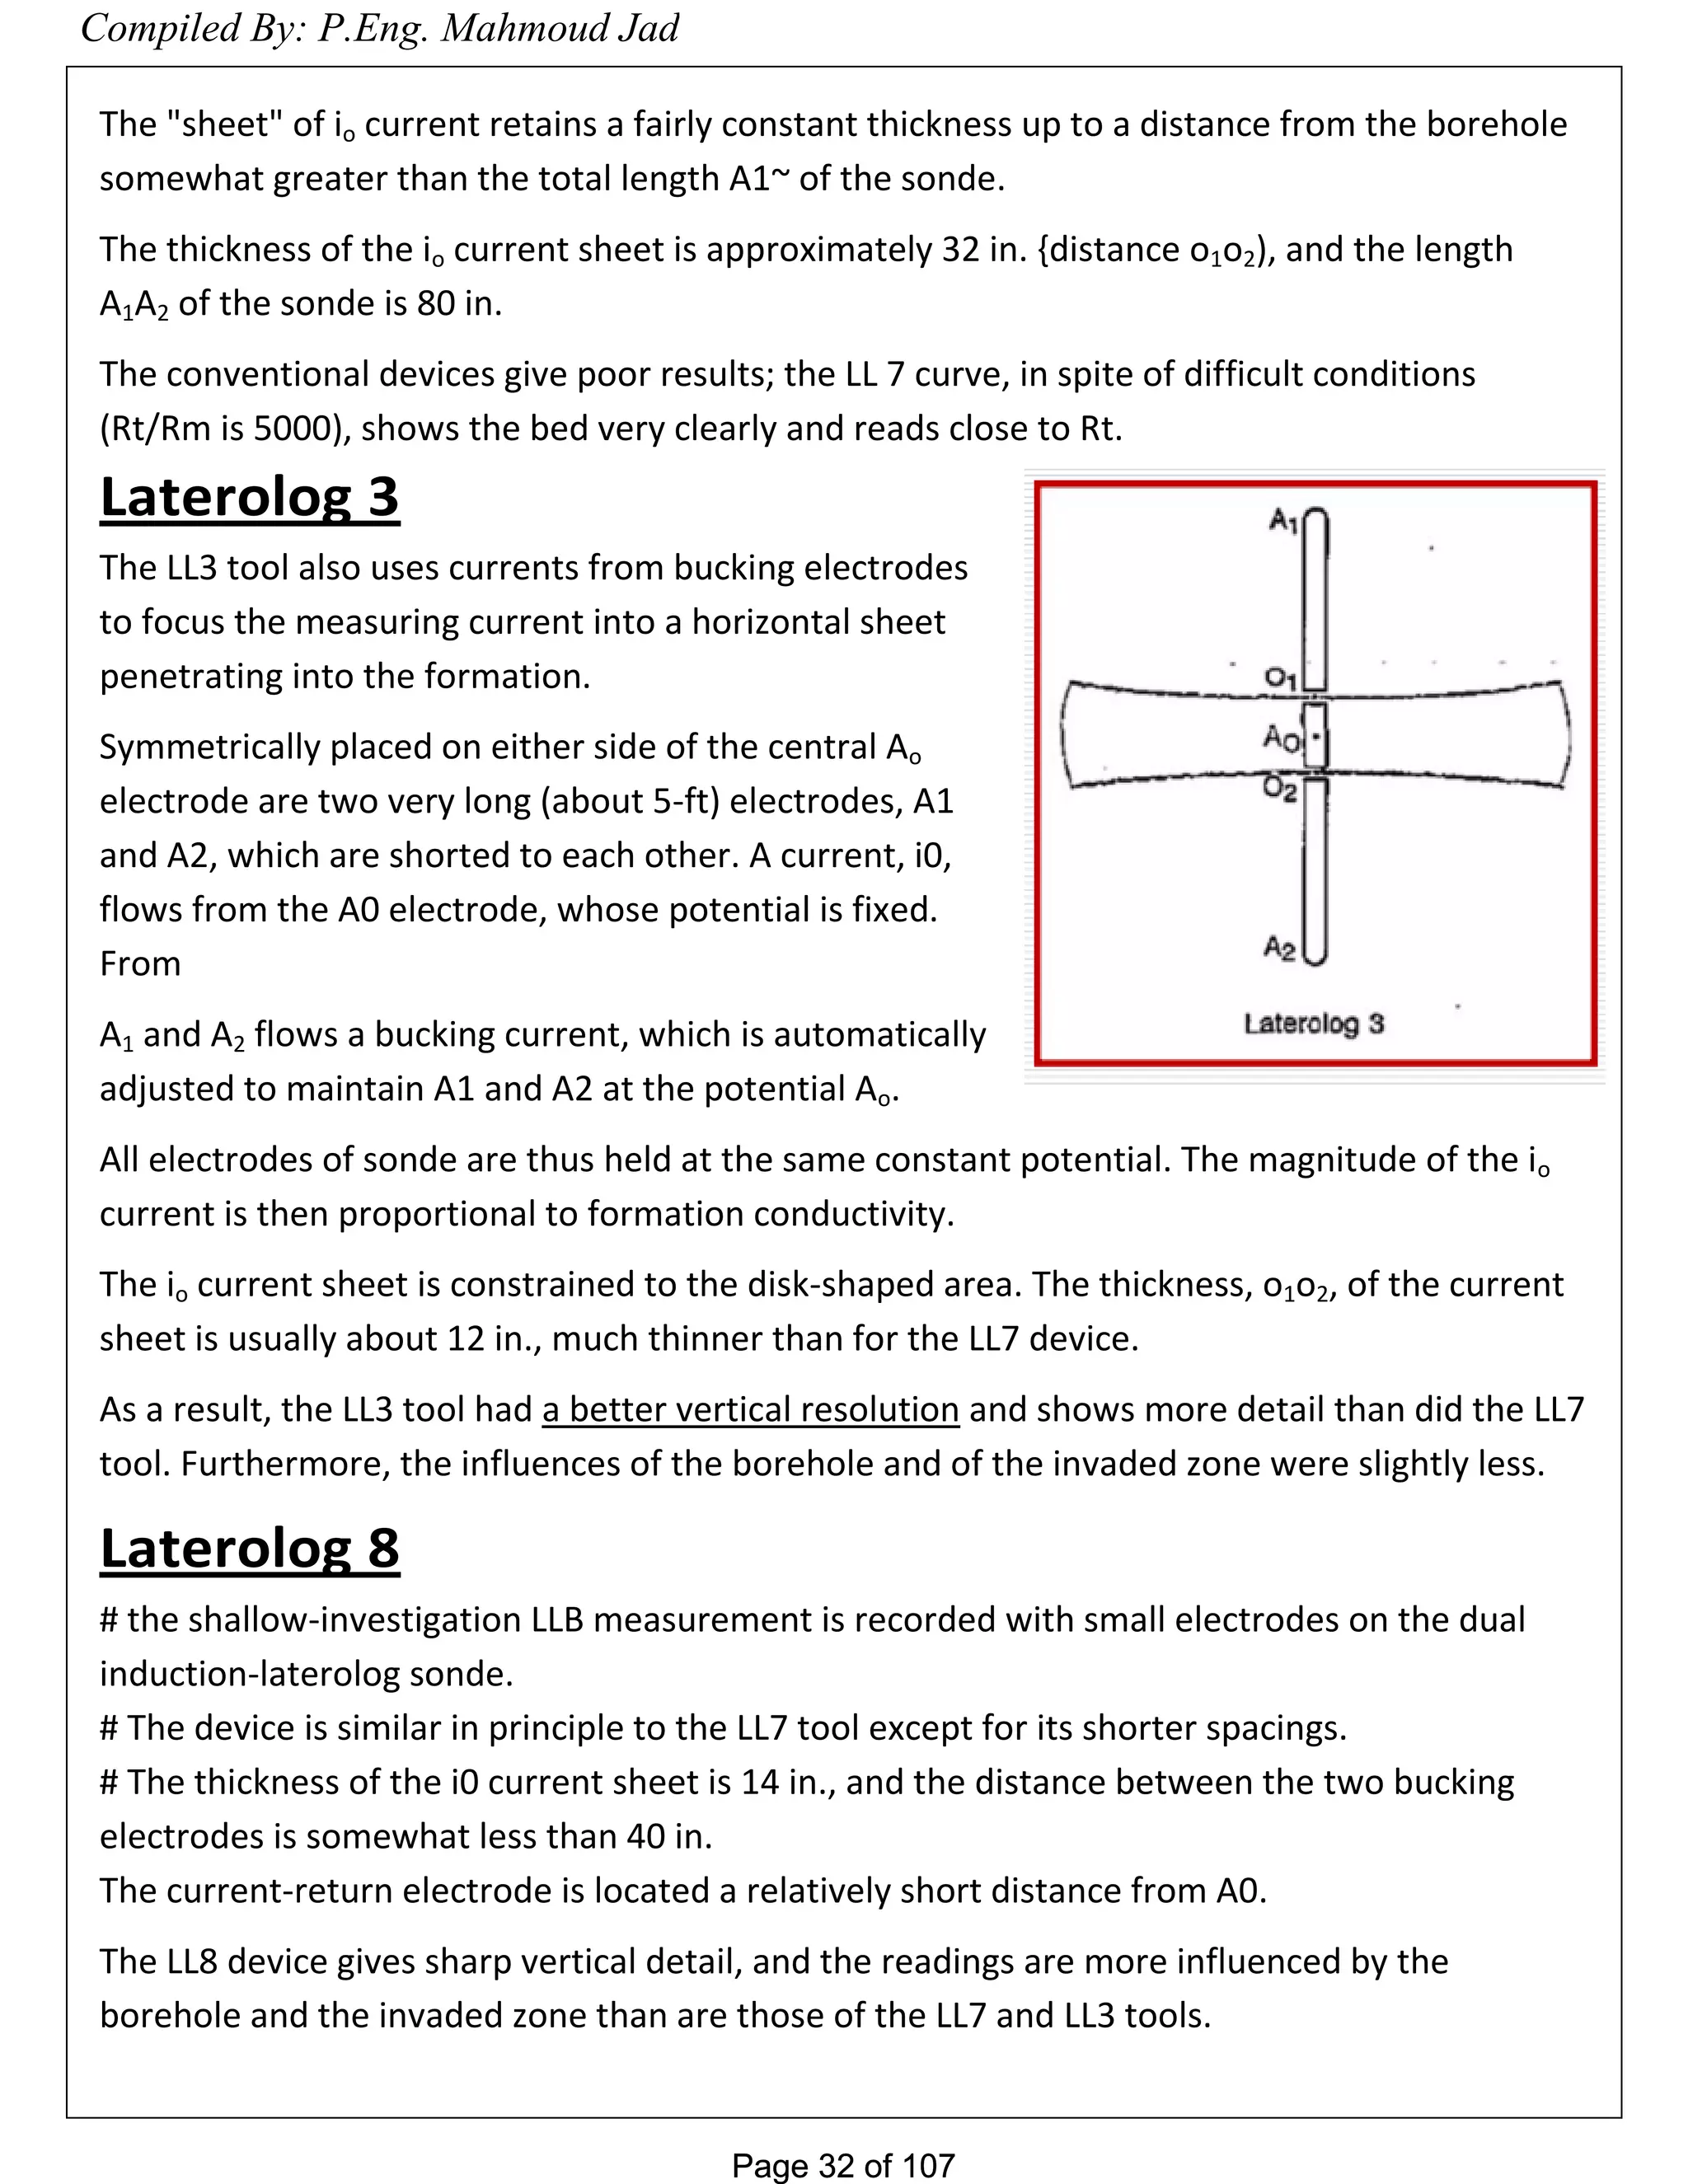
Positive curve separation.
As drilling fluid filters into the permeable
formations, mud solids accumulate on
the hole wall and form a mud cake.
Usually, the resistivity of the mud cake is
slightly greater than the resistivity of the
mud and considerably lower than the
resistivity of the invaded zone near the
borehole.
The 2-in. micro-nonnal device has a
greater depth of investigation than the
micro-inverse. It is, therefore, less
influenced by the mud cake and reads a
higher resistivity, which produce positive
curve separation.
In the presence of low-resistivity mud
cake, both devices measure moderate
resistivities, usually ranging from 2 to 10
times Rm.
In impervious formations, the two curves
read similarly or exhibit some negative separation. Here the resistivities are usually much
greater than in permeable formations.
The limitations of the method are as follows:
1. The ratio Rxo/Rmc must be less than approximately 15 (porosity more than 15%).
2. The value of hmc must be no greater than 0.5 in. [1.3 cm].
3. Depth of invasion must be greater than 4 in. [10 cm]; otherwise, the microlog readings
are affected by Rt.
The micro-log is used to detect permeable zones across which a mud cake has formed.
Since the mud cake is usually less resistive than the invaded zone, the micro-inverse will
read less than the micro-normal opposite permeable zones.
If the resistivity and thickness of the mud cake are known, it is possible to estimate the
resistivity of the flushed zone. The log is usually presented on a linear scale, chosen to
emphasize the lower readings often seen opposite permeable zones with mud cake.
Under favorable circumstances the microlog can be used to obtain Rxo but it is generally
considered a good qualitative indicator of permeability, rather than an Rxo measurement
Compiled By: P.Eng. Mahmoud Jad](https://image.slidesharecdn.com/welllogging-160320235331/75/Well-logging-35-2048.jpg)


![Page 76 of 107Page 76 of 107
Depth of Investigation:
The radial investigation depends on the porosity of the formation.
Very roughly, at zero porosity the depth of investigation is about 1 ft.
At higher porosity in liquid filled holes, the depth of investigation is less because neutrons
are slowed and captured closer to the borehole.
For average conditions, the depth of investigation for the SNP tool is about 8 in. in a high-
porosity rock; it is about 10 in. for the CNL tool in similar conditions.
Both tools sample a somewhat larger volume of formation than the FDC tools.
Factors Affecting CNL Logs, …
1. Lithology
A single known matrix must be present to accurately determine porosities.
Large errors can occur if the matrix selection is incorrect.
2. Shale
The presence of hydrogen in chemically bound water causes the CNL/DNL tool to read
high porosities in shales or shaly formations.
3. Fluid Type
3.1. Water: Fresh water has no effects. Saline water has a reduced hydrogen content
and the CNL/DNL tool will read low porosity; the correction is in the chart book.
3.2. Liquid Hydrocarbons:
o If the hydrogen content is close to that of water, there is little or no effect.
3.3. Gas: If the hydrogen concentration is low, the CNL/DNL tool reads low porosity.
4. Compaction
All neutron logs are unaffected by compaction.
5. Secondary Porosity
All neutron equipment measures total porosity (including primary and secondary).
6. Borehole Effect
The effects of rough hole are minimized by a large depth of investigation obtained by
the use of a high-yield source and the two-detector system.
When run in combination with the density tool, an automatic caliper correction system
is accurate to [356 mm]. Normally there is zero standoff correction.
7. Mud cake
Corrections for mud cake, fluid (mud and formation) salinity, mud weight, pressure and
temperature are in Charts Por-14(a) and 14(b), in the Log Interpretation Chart Book.
The average net correction is usually between one and three porosity units. Hence, for
calculations by hand, the correction is usually not done.
Compiled By: P.Eng. Mahmoud Jad](https://image.slidesharecdn.com/welllogging-160320235331/75/Well-logging-76-2048.jpg)


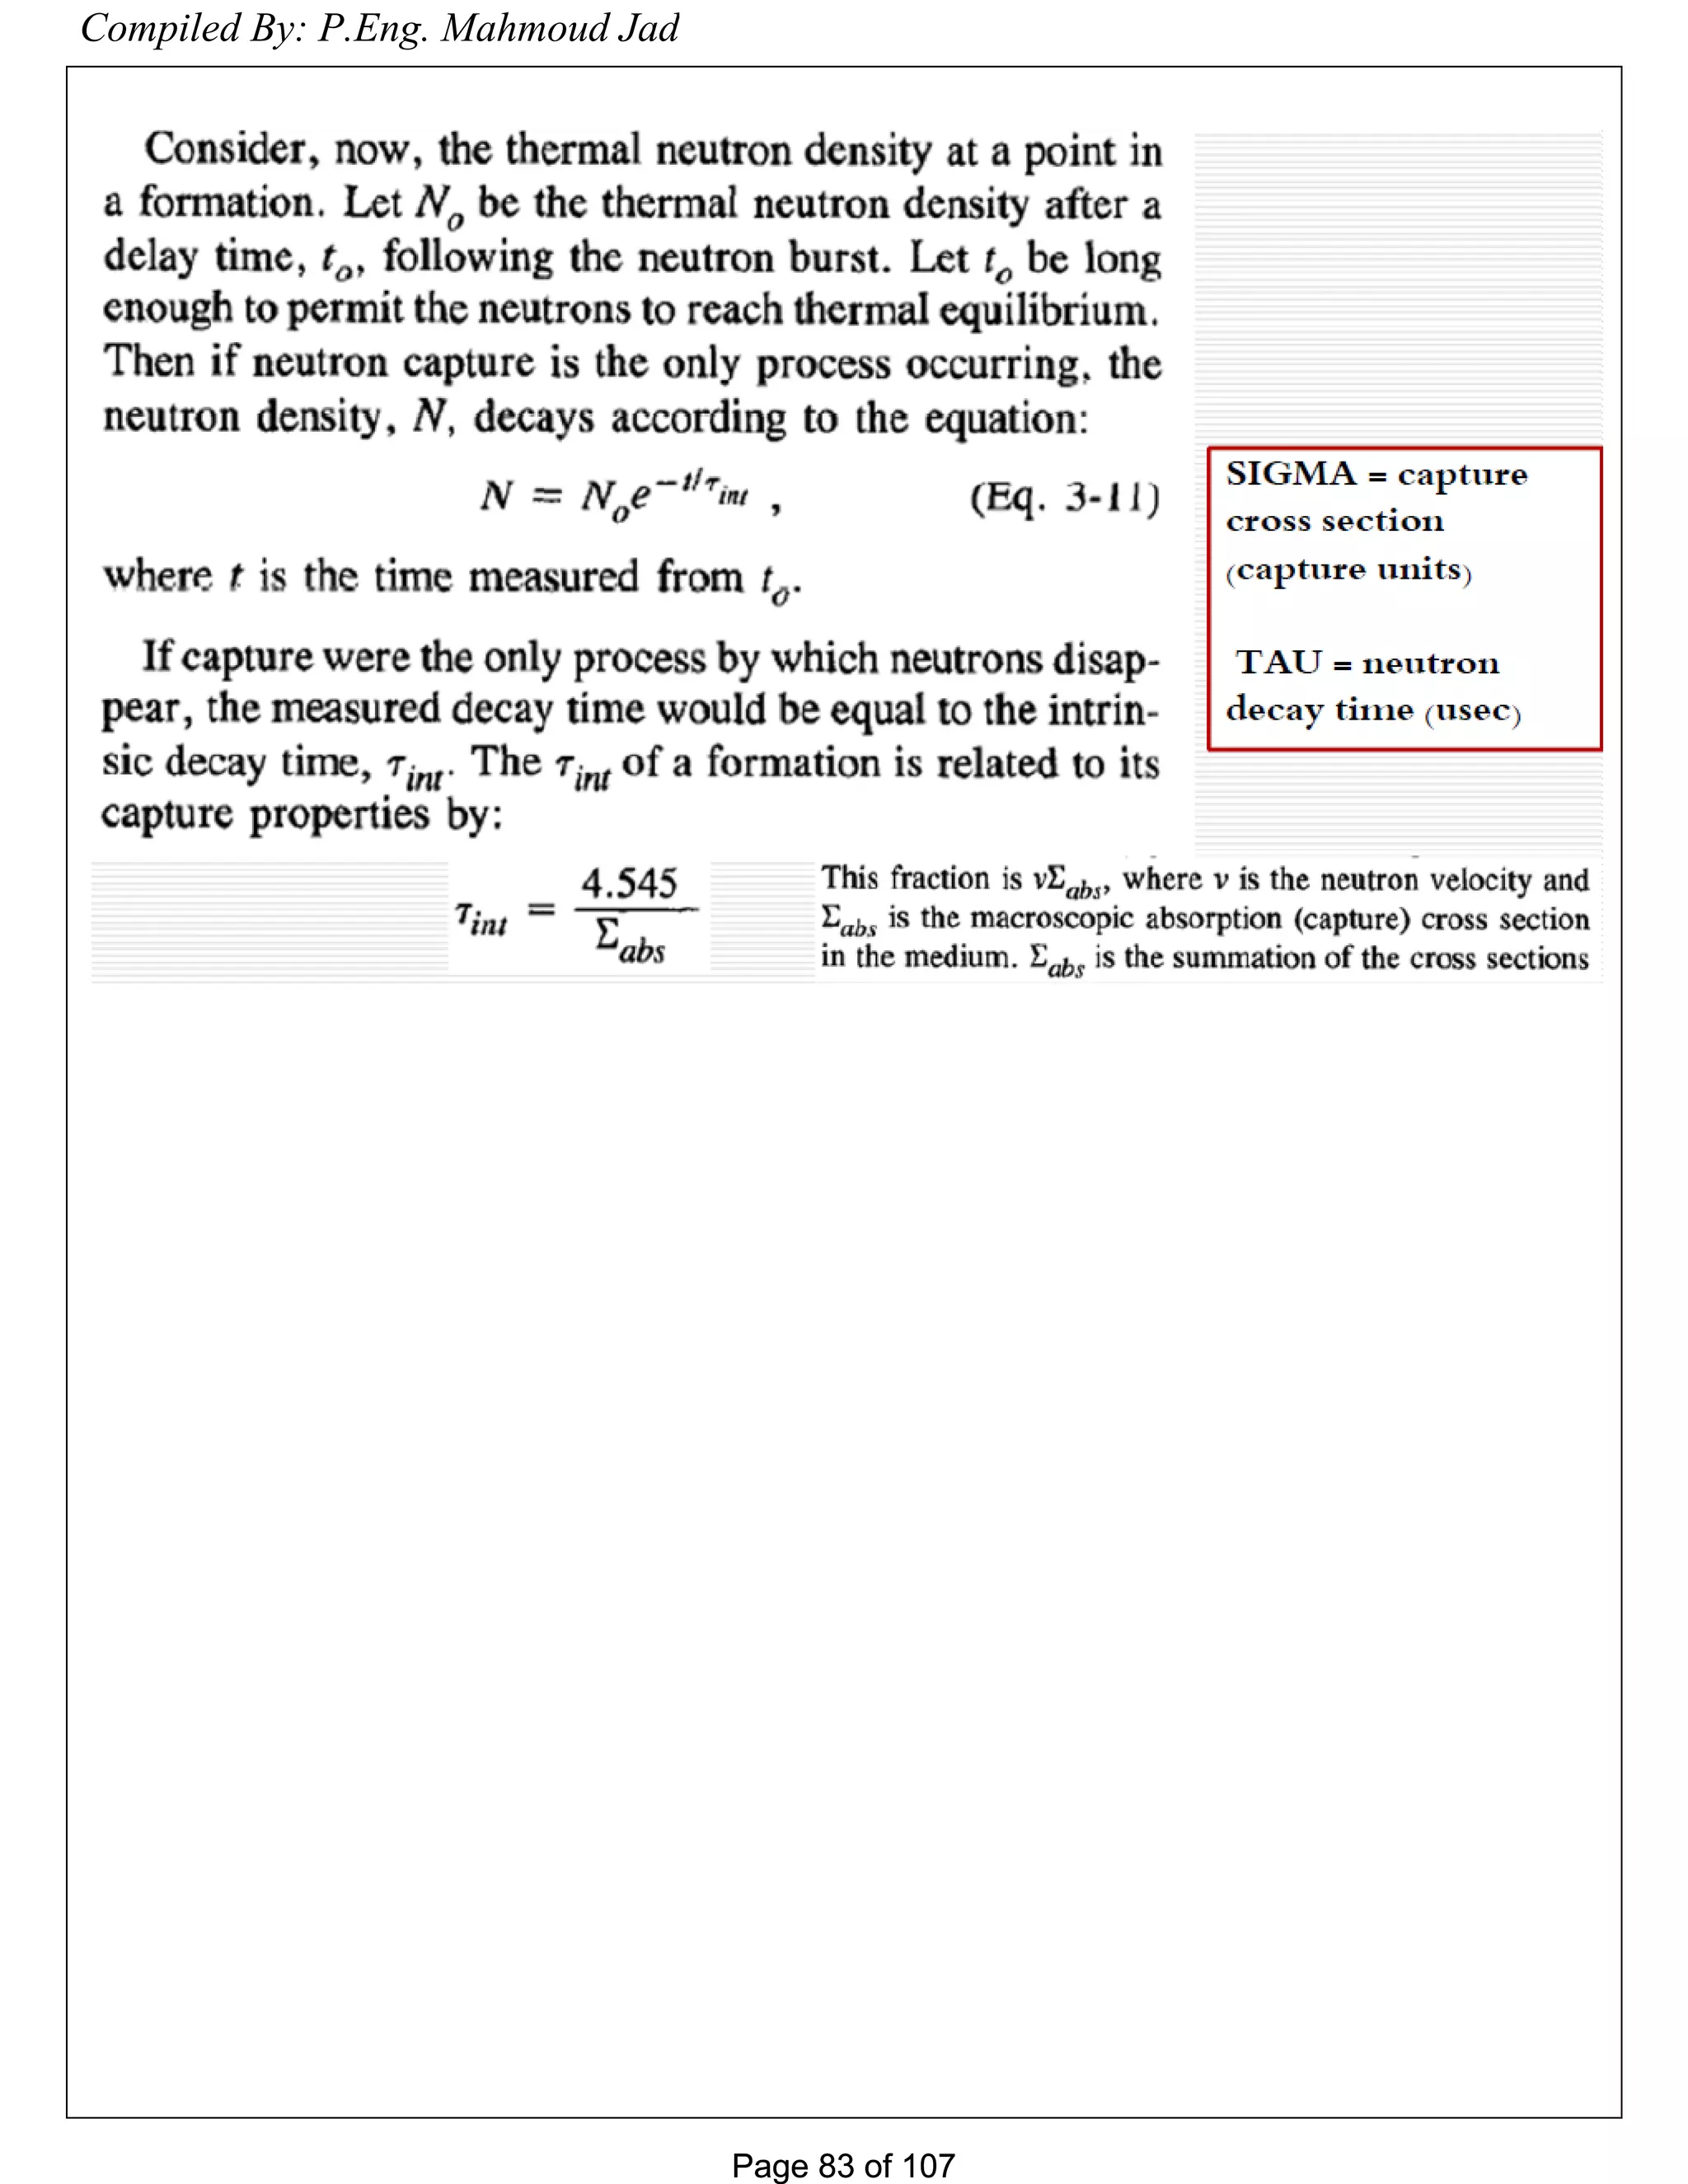
![Page 80 of 107Page 80 of 107
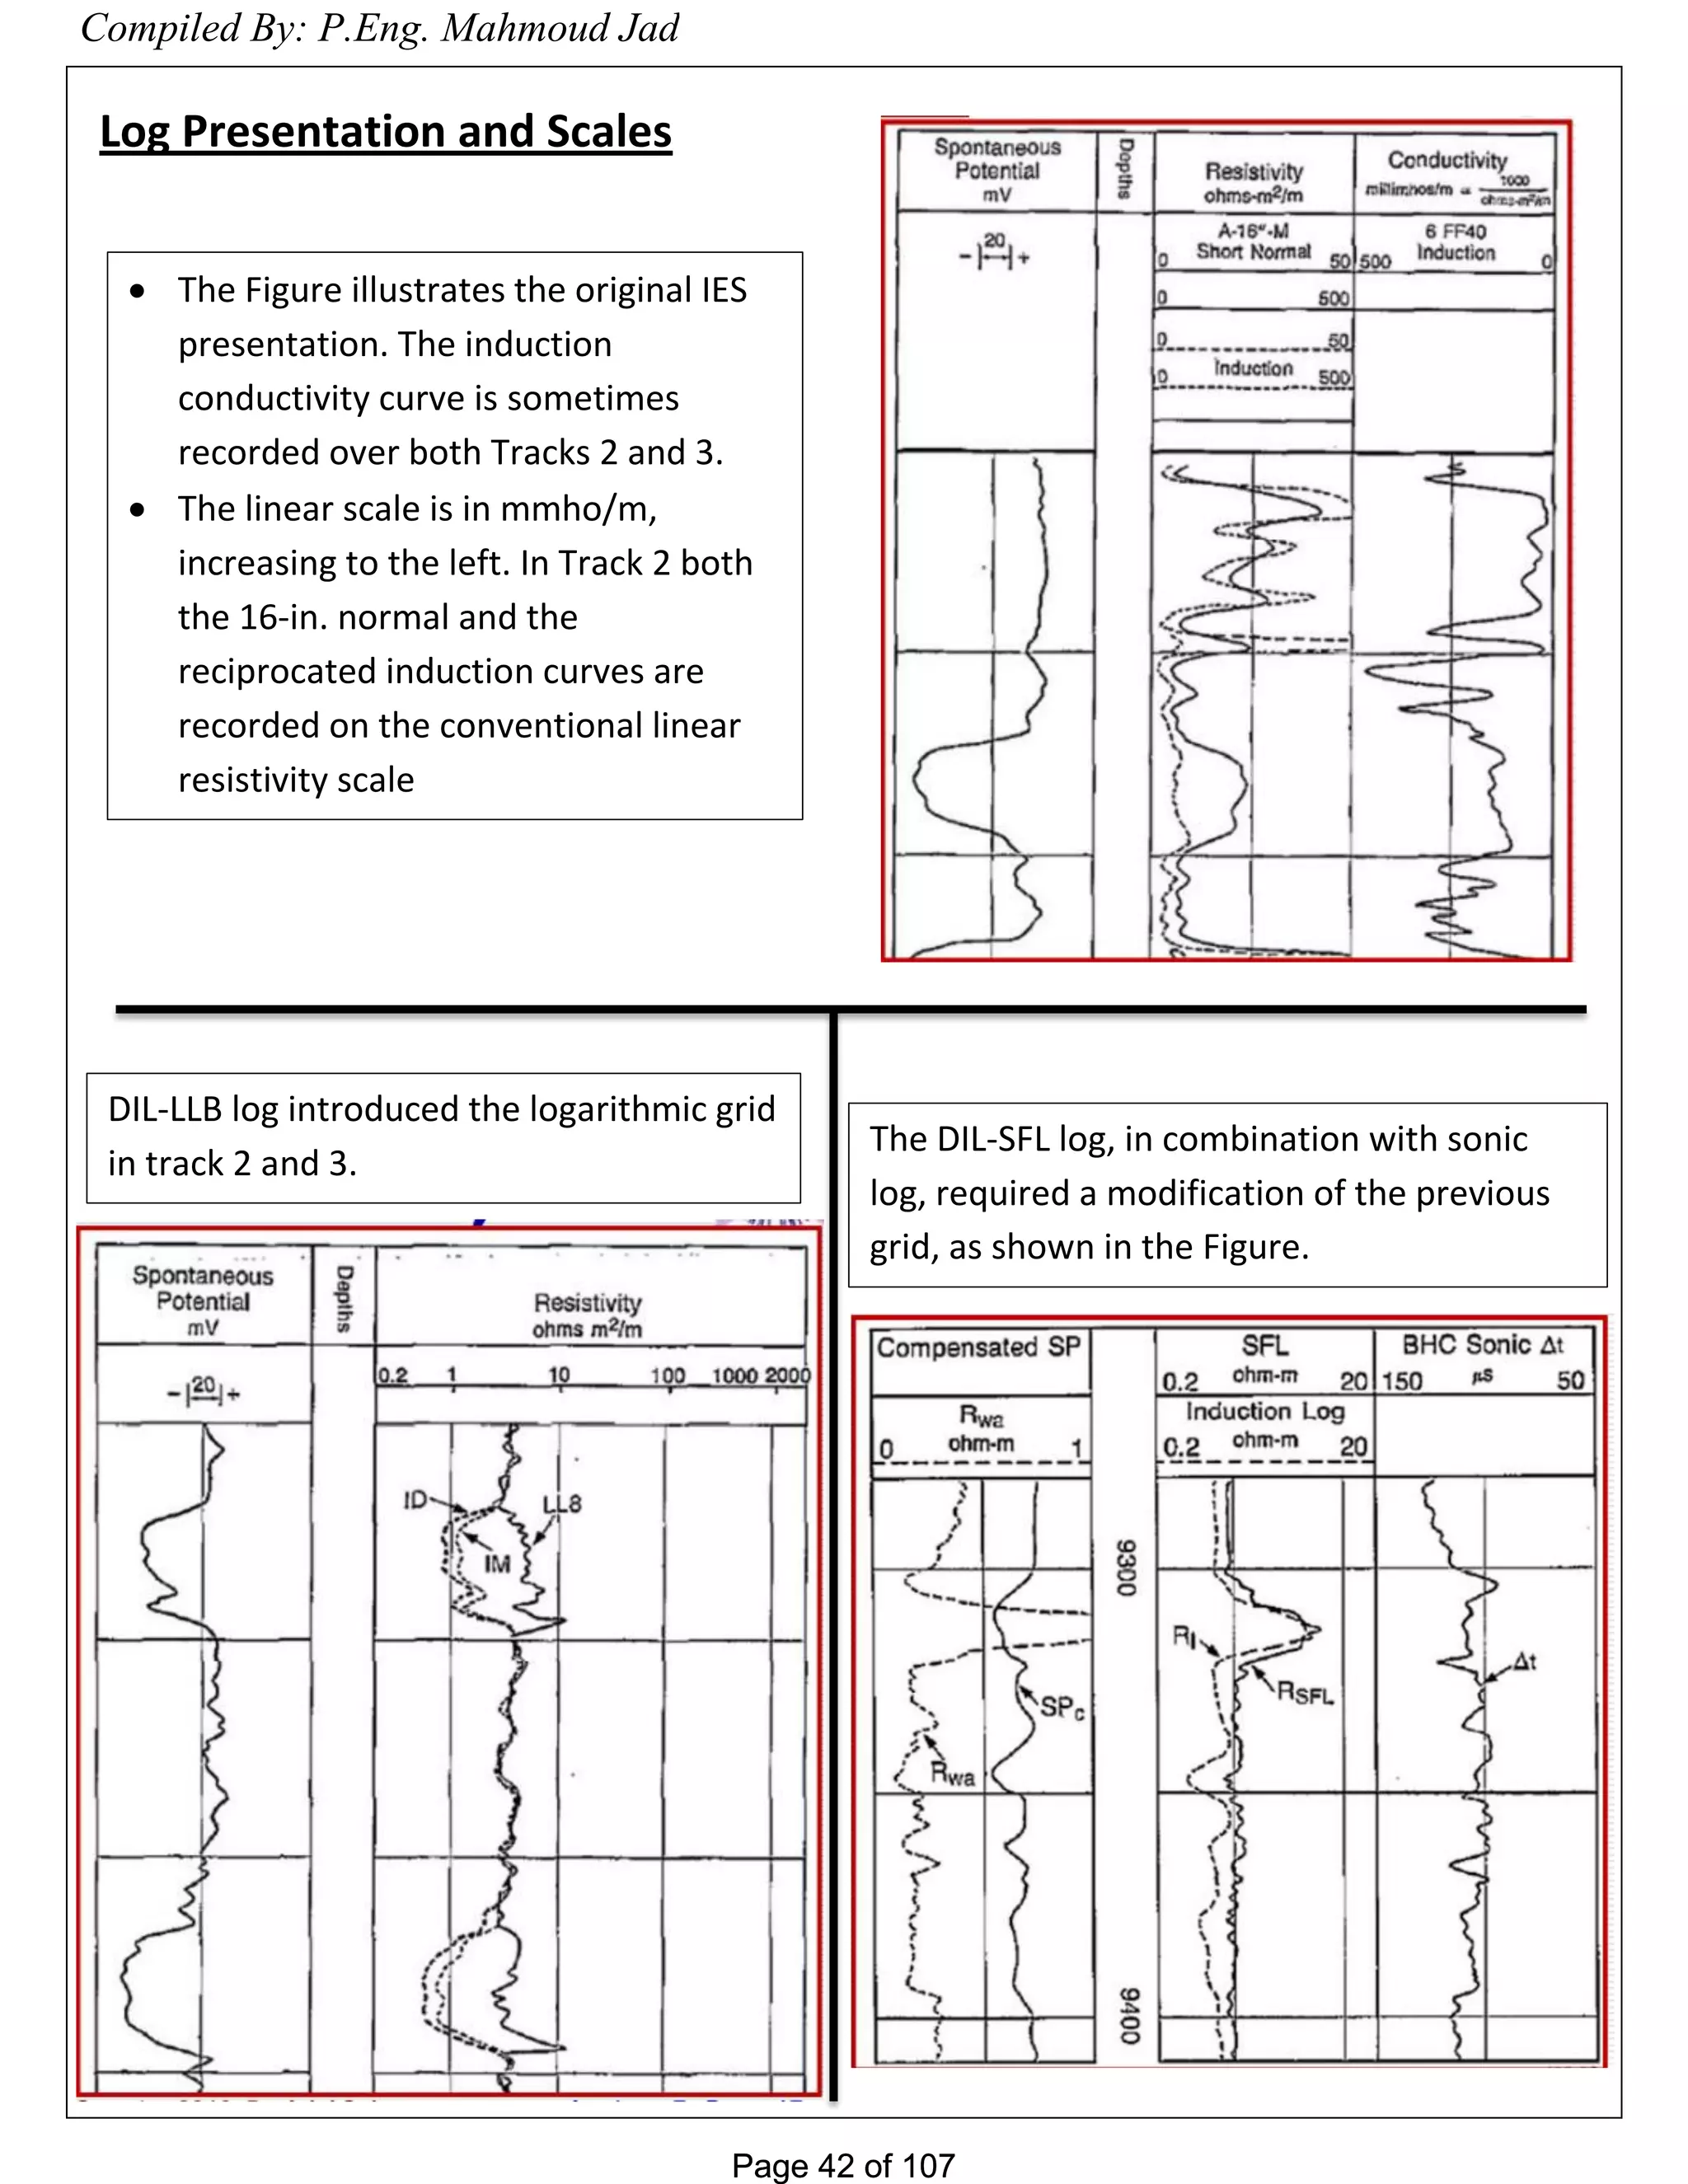
1. Effective Porosity and Shale Content from Porosity Logs
Effective porosity can be calculated well if Vsh and sh are known.
Experience has shown that, when one porosity tool is used to calculate , the density log
provides the best estimate. Because ( D)sh is much smaller than ( N)sh and ( S)sh the
correction term [Vsh ( a)sh] of the previous Equation is less sensitive to an incorrect
estimation of vsh .
To avoid misinterpretation caused by a non-representative Vsh value estimated from the
gamma ray log, an independent evaluation of Vsh is necessary. This can be done with two
porosity tool responses.
The two equations to be solved simultaneously for cj> and Vsh: <Pv =</>+ Vsh(<bo)sh • • and
<i>N=c/>+ Vsh«PN)sh•
Compiled By: P.Eng. Mahmoud Jad](https://image.slidesharecdn.com/welllogging-160320235331/75/Well-logging-80-2048.jpg)


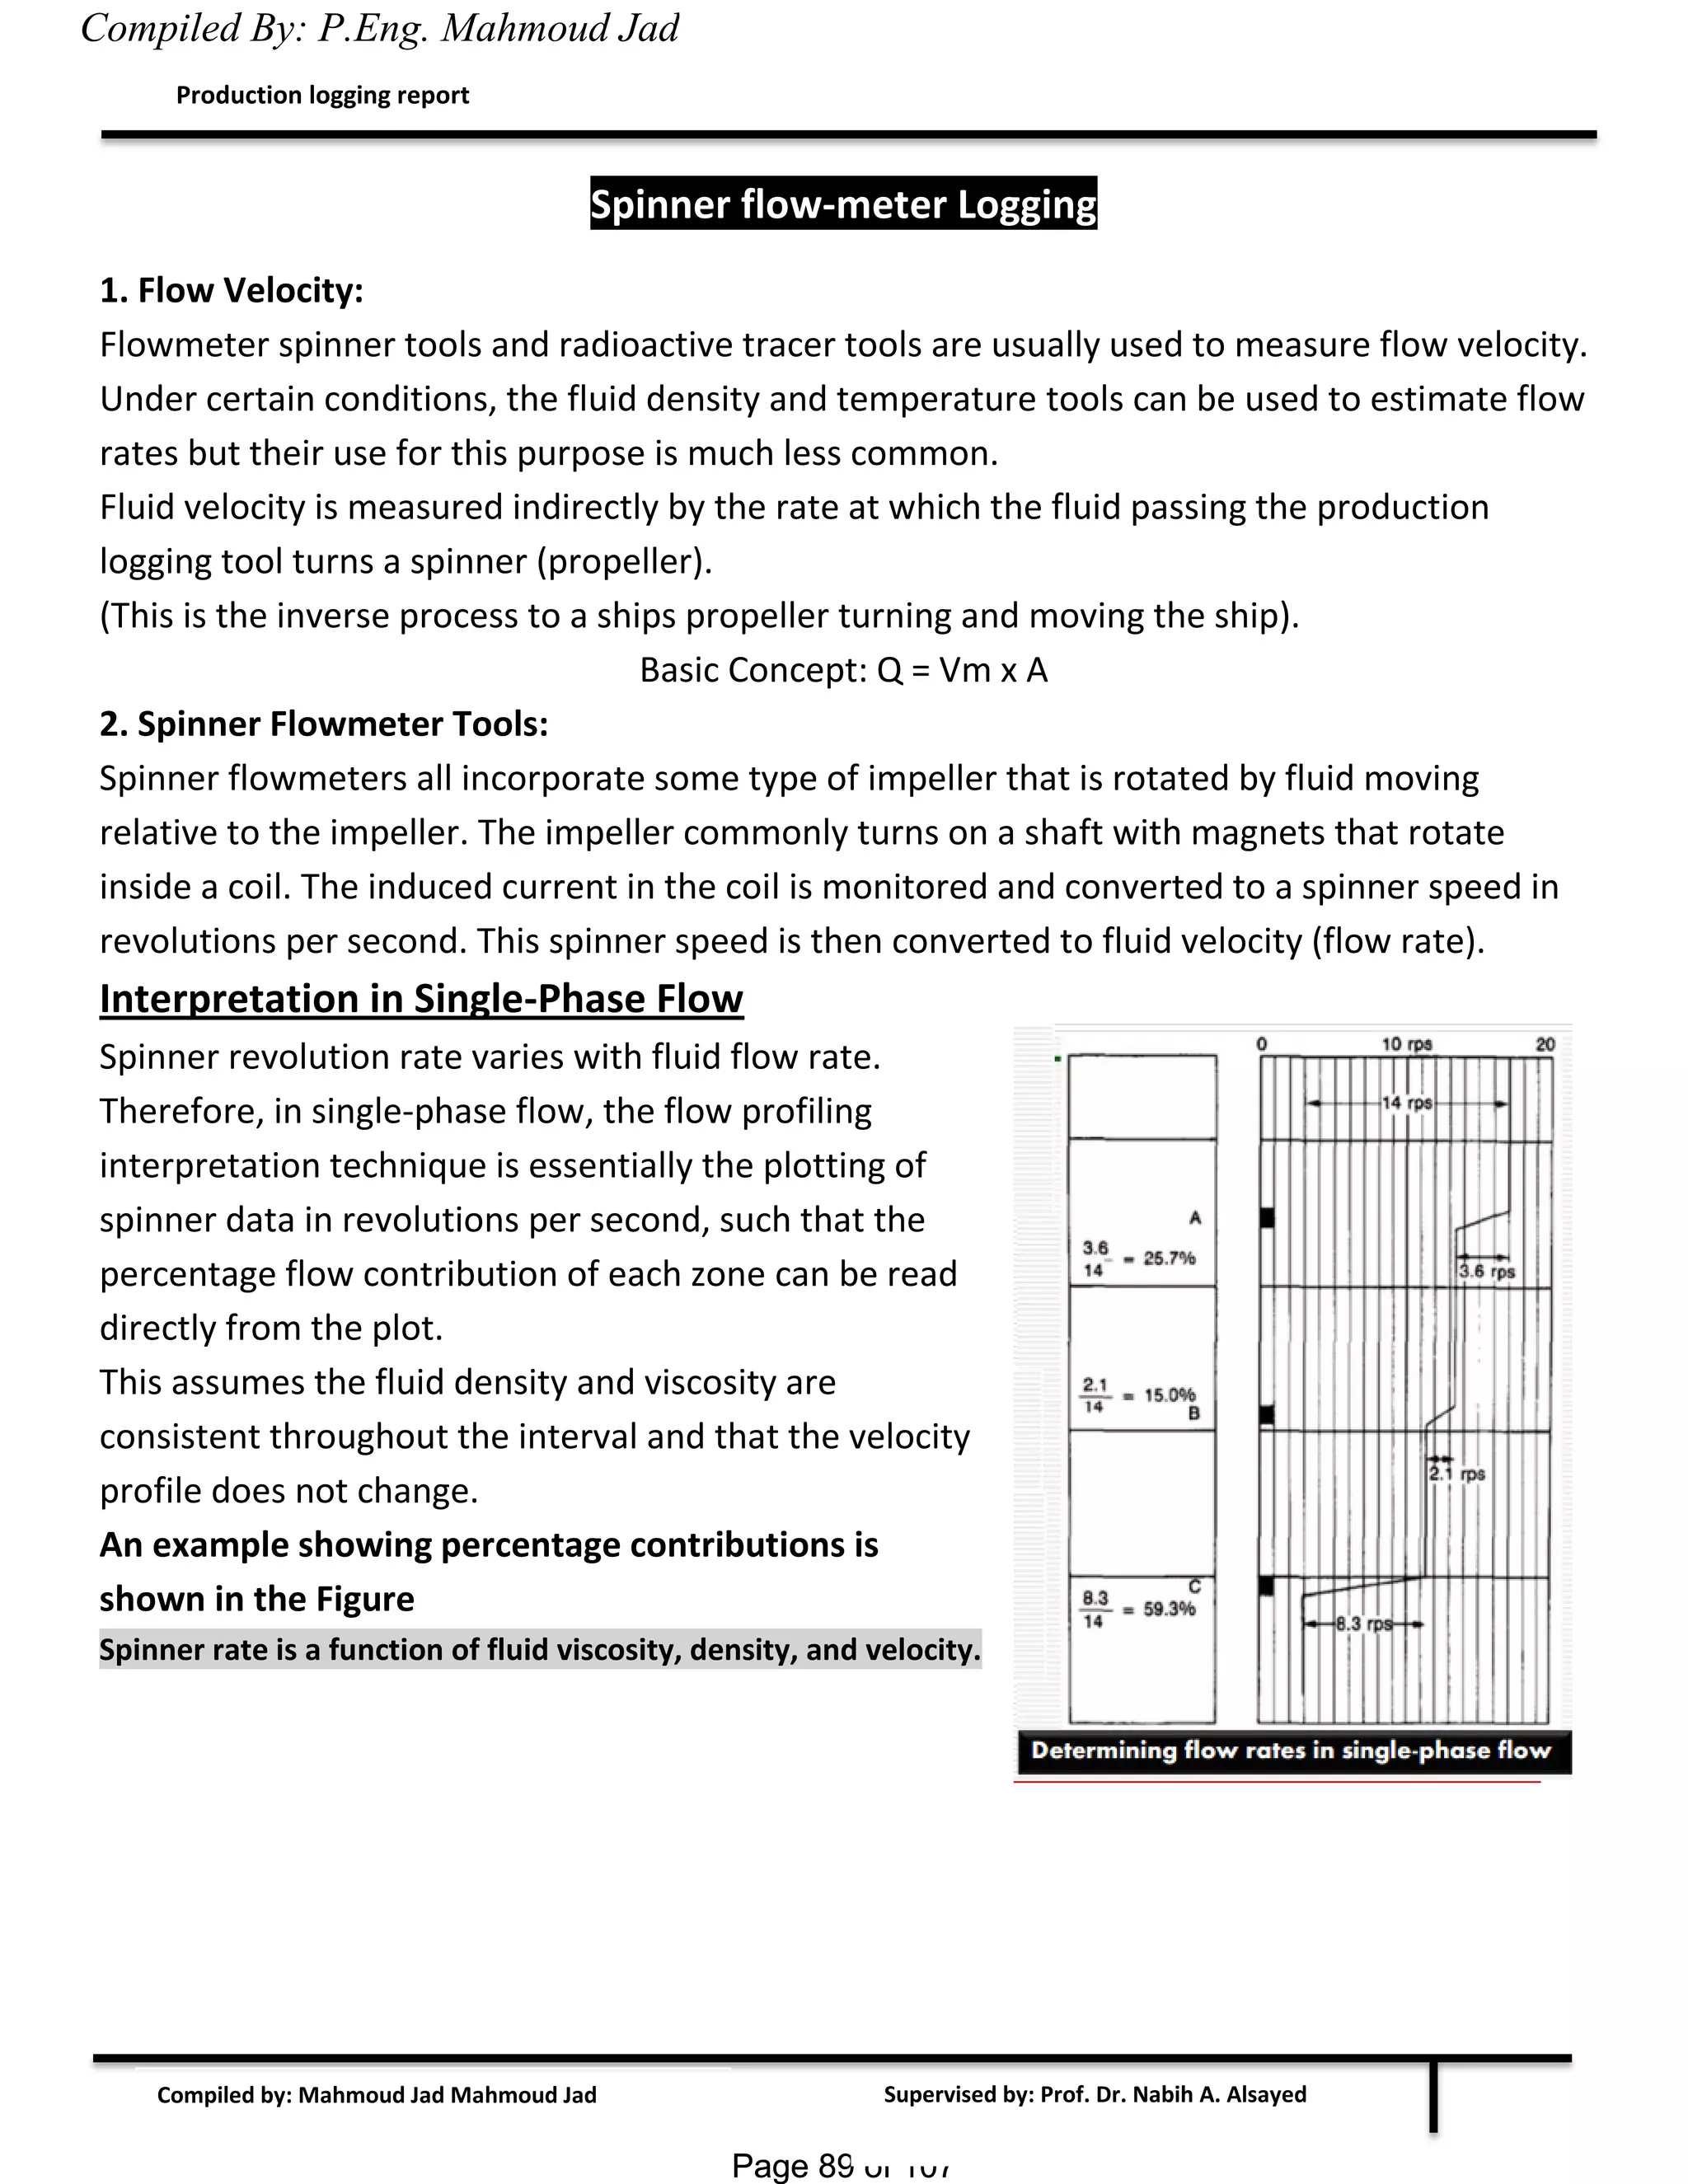


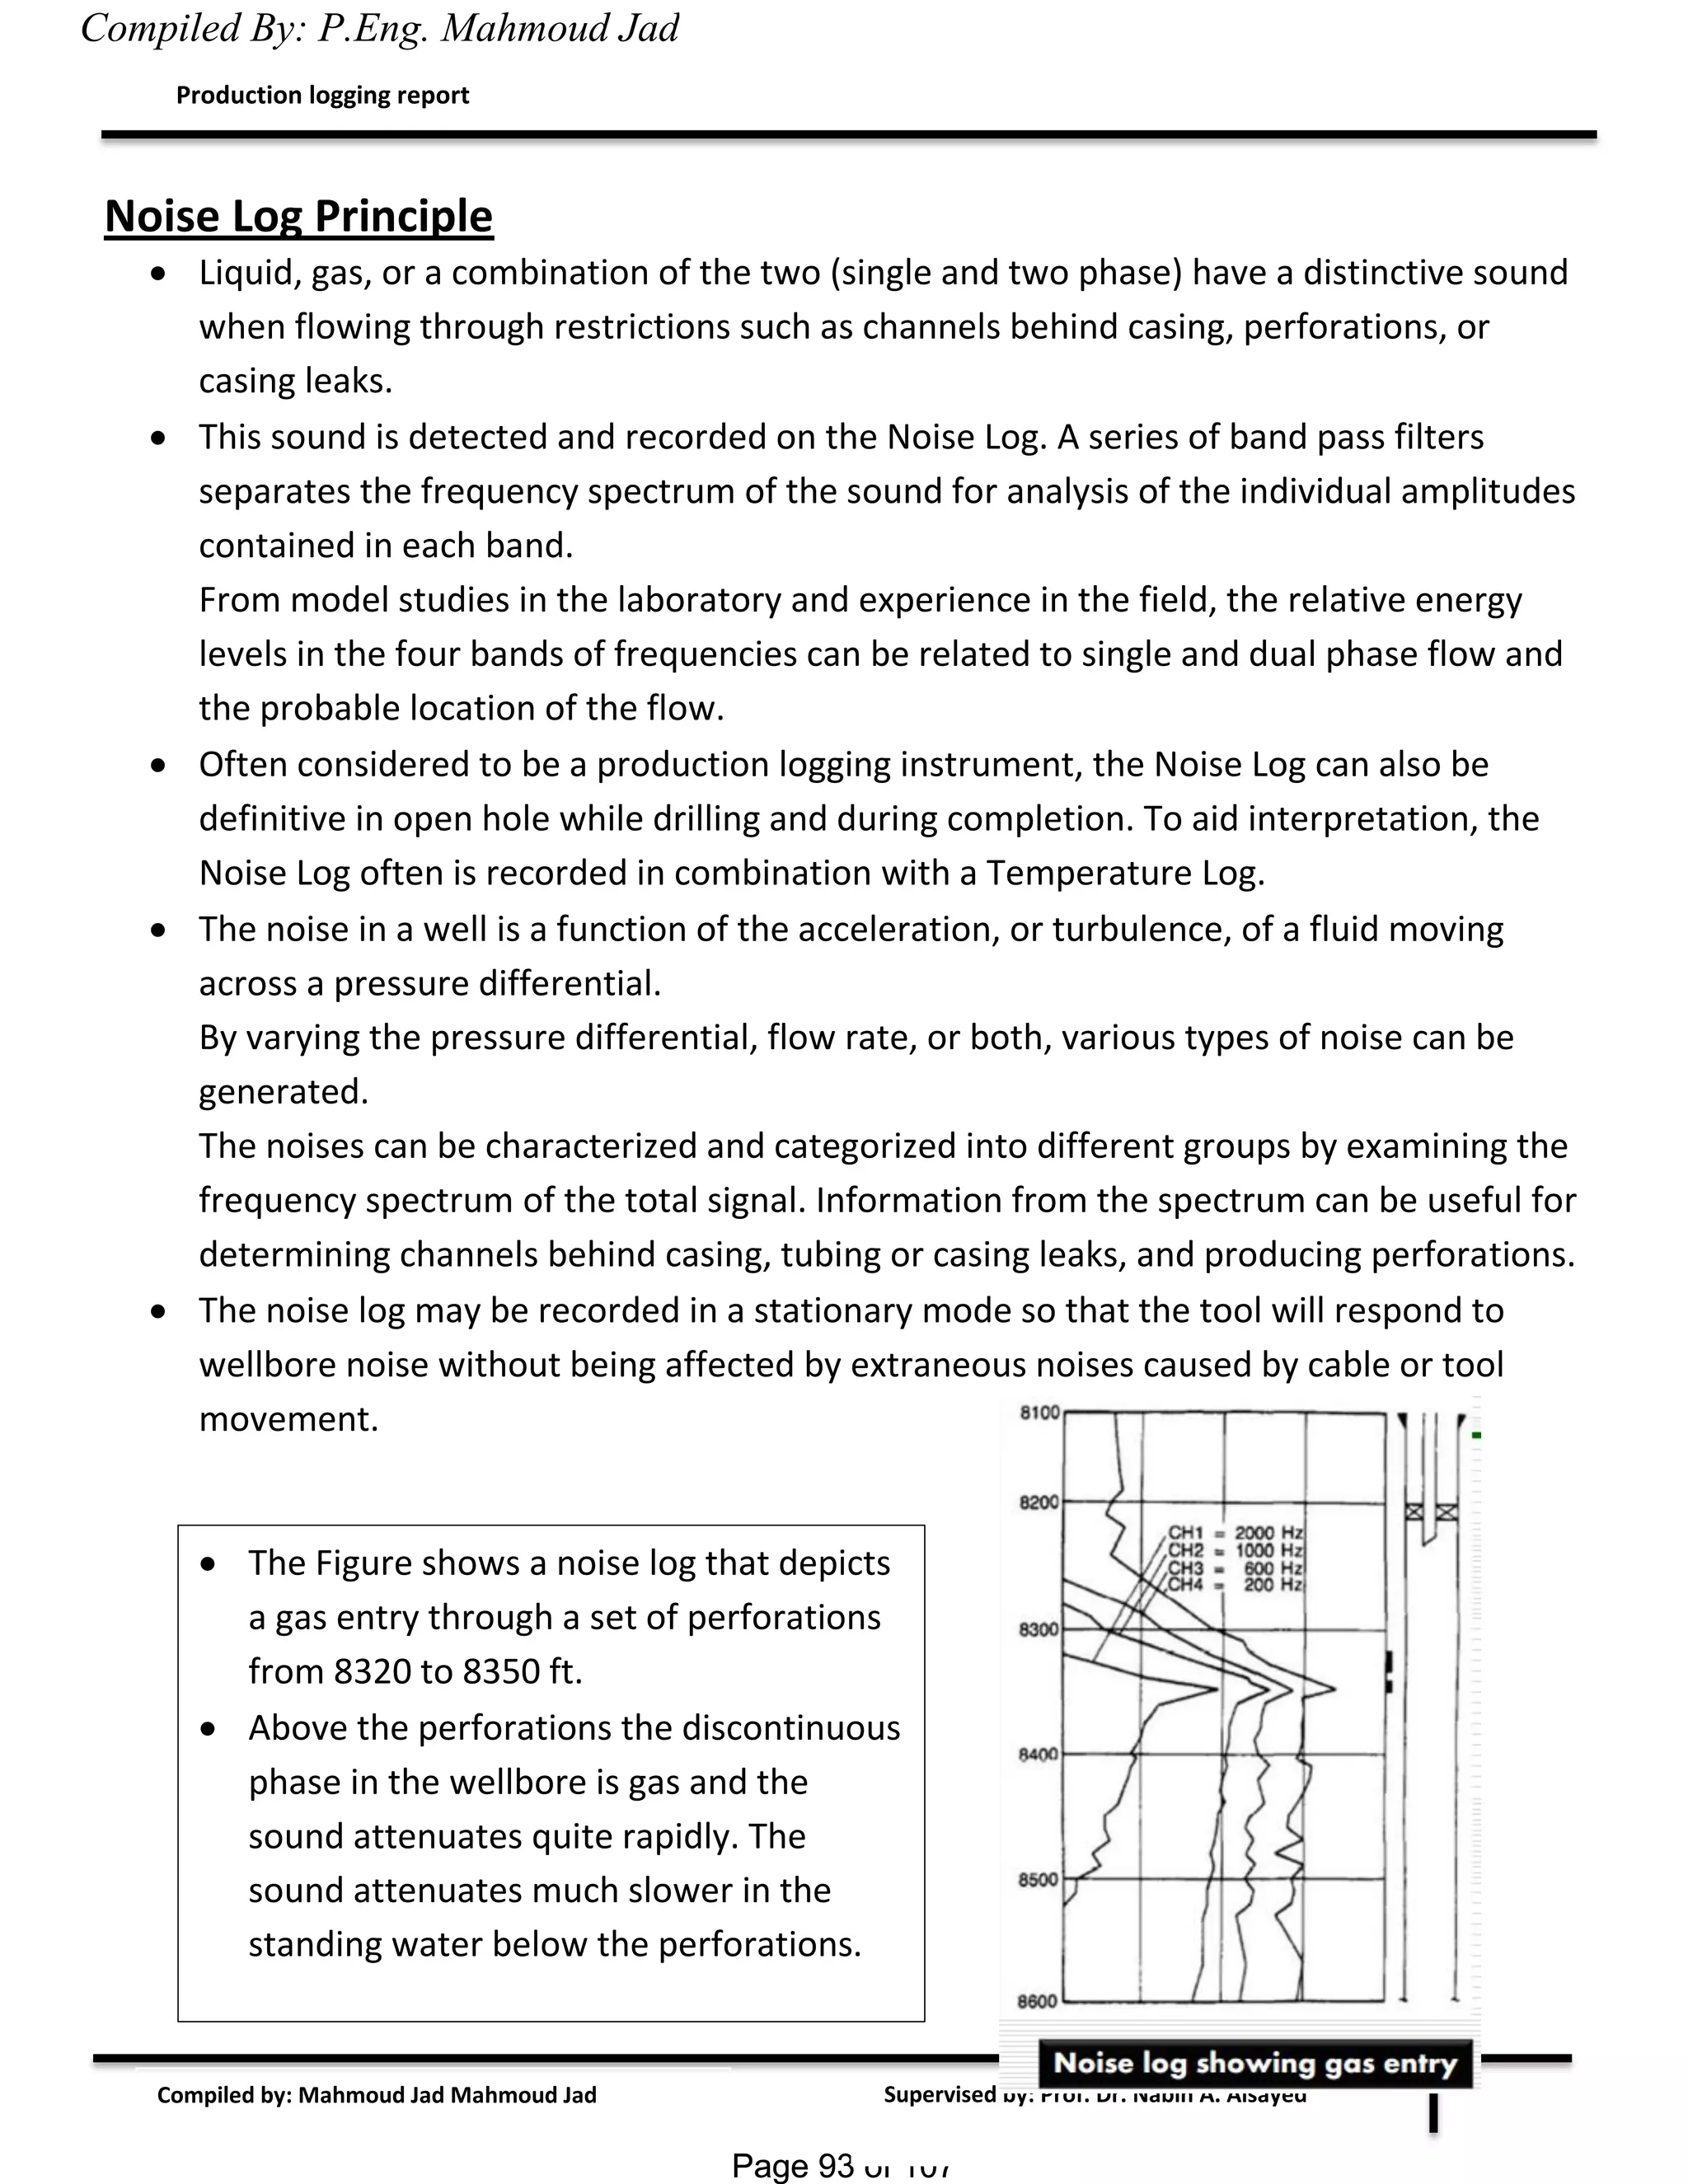


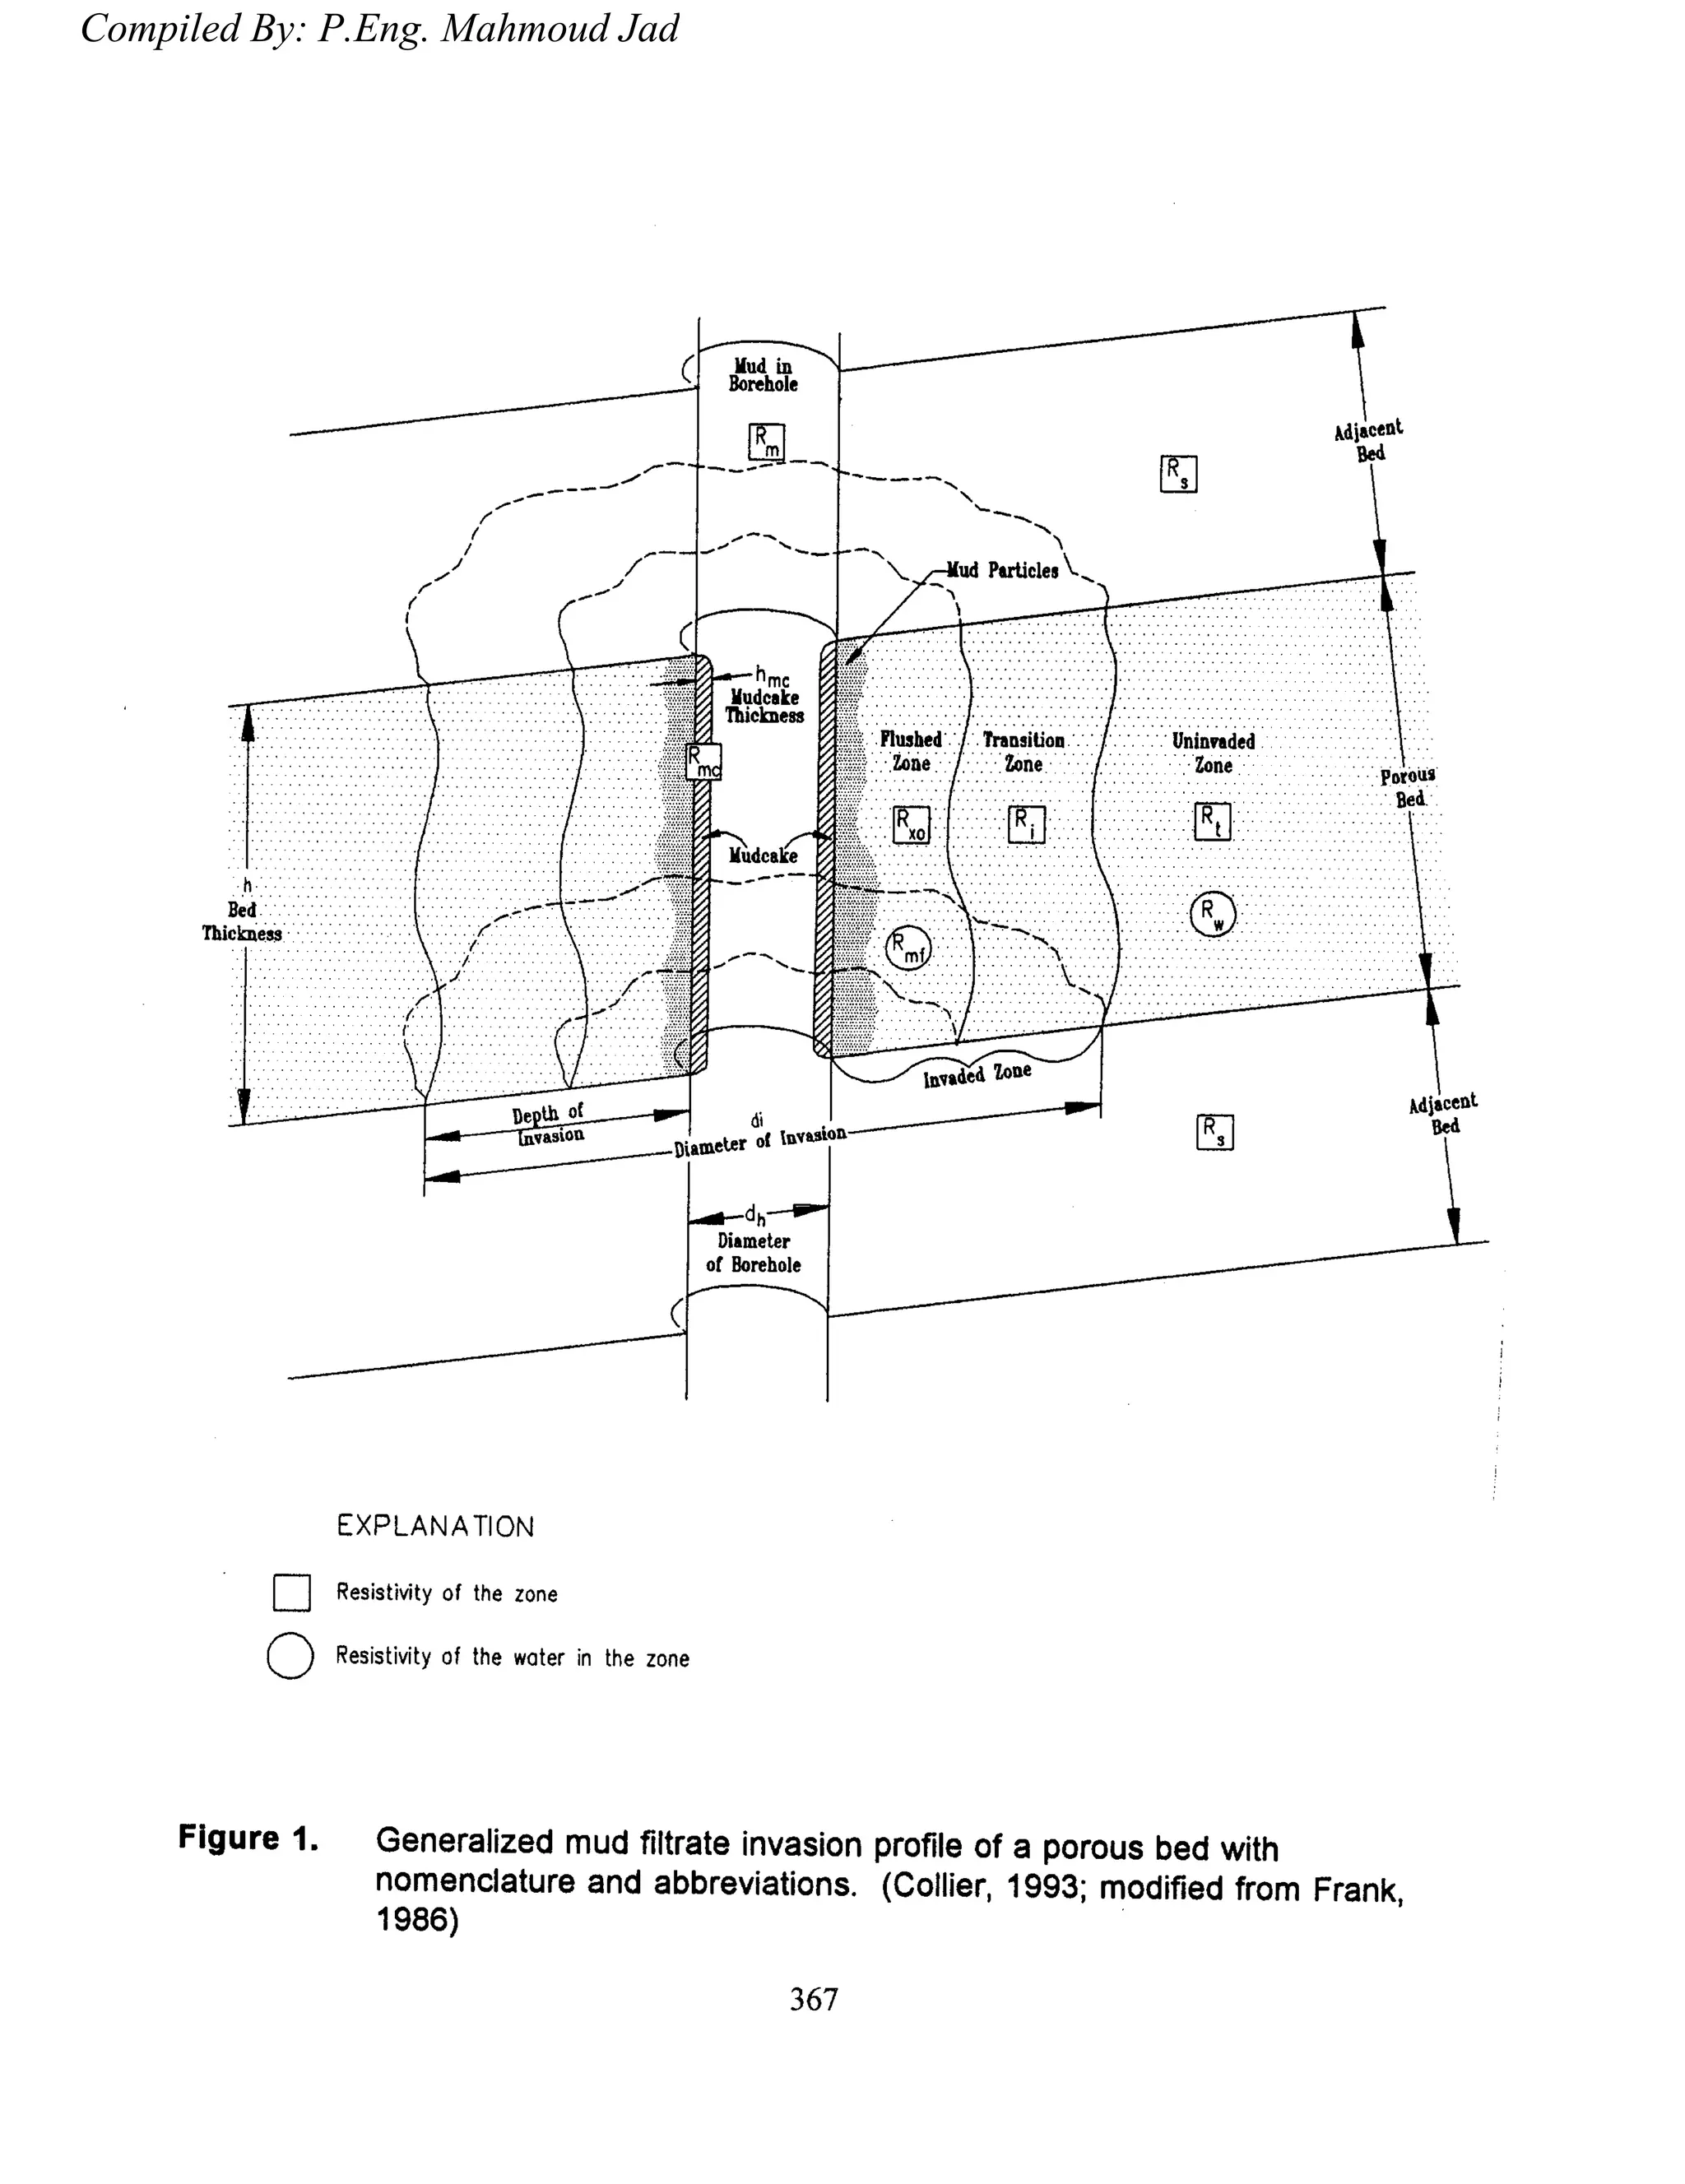
The document discusses well logging, a technique used in petroleum geology to measure the physical and chemical properties of subsurface rocks and fluids through drilled boreholes. It outlines various survey methods, the processes involved in logging operations, and the interpretation of well logs to determine reservoir characteristics and hydrocarbon potential. Additionally, the document explains the complexities of drilling fluid invasion and the importance of understanding the borehole environment for accurate log interpretation.


