Well Logging Guide
•
1 like•289 views

The document provides an overview of well logging terminology, techniques, history, and applications. Key points include: - Well logging involves lowering instruments into boreholes to evaluate subsurface formations and includes tools like density, neutron, and gamma ray logs. - Major types are wireline logs run after drilling and logging-while-drilling tools integrated into the drill string. - Well logging plays a central role in hydrocarbon exploration and development by determining lithology, porosity, fluid content, and other formation properties. - Advancements over time include the first electrical logs in the 1920s, development of continuous recording in the 1930s, and logging-while-drilling in the 1980s.

Recommended
More Related Content
What's hot
What's hot (20)
Similar to Well Logging Guide
Similar to Well Logging Guide (20)
Recently uploaded
Recently uploaded (20)
Well Logging Guide
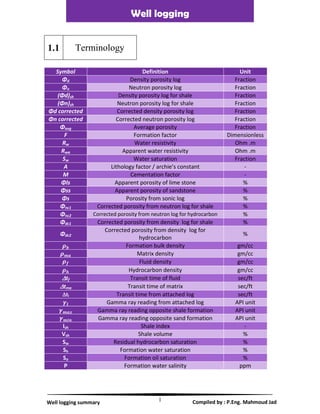
- 1. 1 Well logging Well logging summary Compiled by : P.Eng. Mahmoud Jad 1.1 Terminology Symbol Definition Unit Φd Density porosity log Fraction Φn Neutron porosity log Fraction (Φd)sh Density porosity log for shale Fraction (Φn)sh Neutron porosity log for shale Fraction Φd corrected Corrected density porosity log Fraction Φn corrected Corrected neutron porosity log Fraction Φavg Average porosity Fraction F Formation factor Dimensionless Rw Water resistivity Ohm .m Rwa Apparent water resistivity Ohm .m Sw Water saturation Fraction A Lithology factor / archie’s constant - M Cementation factor - Φls Apparent porosity of lime stone % Φss Apparent porosity of sandstone % Φs Porosity from sonic log % Φnc1 Corrected porosity from neutron log for shale % Φnc2 Corrected porosity from neutron log for hydrocarbon % Φdc1 Corrected porosity from density log for shale % Φdc2 Corrected porosity from density log for hydrocarbon % Formation bulk density gm/cc Matrix density gm/cc Fluid density gm/cc Hydrocarbon density gm/cc tf Transit time of fluid sec/ft tma Transit time of matrix sec/ft tl Transit time from attached log sec/ft Gamma ray reading from attached log API unit Gamma ray reading opposite shale formation API unit Gamma ray reading opposite sand formation API unit Ish Shale index - Vsh Shale volume % Sw Residual hydrocarbon saturation % Sh Formation water saturation % So Formation oil saturation % P Formation water salinity ppm
- 2. 2 Well logging Well logging summary Compiled by : P.Eng. Mahmoud Jad Formation evaluation is the process of using borehole measurements to evaluate the characteristics of subsurface formation. These measurements may be grouped into four categories: 1. Drilling operation logs 2. core analysis 3. wireline well logs 4. productivity tests The continuous recording of a geophysical parameter along a borehole produces a geophysical well log. The value of the measurement is plotted continuously against depth in the well. Well logging plays a central role in the successful development of a hydrocarbon reservoir. Its measurements occupy a position of central importance in the life of a well, between two milestones: the surface seismic survey, which has influenced the decision for the well location, and the production testing. Log is a graphic representation of the variations versus depth of other parameters. Wire line logs are measurements of physical parameter in the formations penetrated by borehole; they are run while drilling has been stopped i.e. after the drill string has been pulled out from the borehole. Some types of geophysical well logs can be done during any phase of a well's history: drilling, completing, producing, or abandoning. It is called also wireline logging due to the wireline cable which carries at its end the instruments & lower it into the well. 1.2 Introduction
- 3. 3 Well logging Well logging summary Compiled by : P.Eng. Mahmoud Jad The measured well log consists of: Log header: includes all information about the well logged and information necessary to describe the environment the measurement has been informed in (e.g. drilling mud parameters). Tool sketches and remarks informing about specific events during the logging operation complete the header. Main log: main display of measurement performed. Log trailer: includes tool/computation parameter table and calibration records. Wireline cables consist mainly of two layers: Outer Wire rope: to provide strength to cable to carry the instruments. Inner Wire: to provide electric power to downhole equipment & for data telemetry.
- 4. 4 Well logging Well logging summary Compiled by : P.Eng. Mahmoud Jad 1.3 History of well logging In 9191 Conrad Schlumberger gave the idea of using electrical measurements to map subsurface rock bodies . In 1919 Conrad Schlumberger and his brother marcel begin work on well logs . The first electrical log was introduced in 1927 in France using stationed resistivity method. The first commercial electrical resistivity tool in 1929 was used in Venezuela, USA and Indonesia. Sp was run along with resistivity first time in 1931 Schlumberger developed the first continuous recording in 1931 and neutron logs was started in 1941 Micro-resistivity array dipmeter and lateralog were first time introduced in 1950's The first induction tool was used in 1956 followed by formation tester in 1957, fomation density in 1960's, electromagnetic tool in 1978 and most of imaging logs were developed in 1980's Advanced formation tester was commercialized in early 1990's
- 5. 5 Well logging Well logging summary Compiled by : P.Eng. Mahmoud Jad 1.4 Field operations Wire line electrical logging is done from a logging truck as a " mobile laboratory" the truck carries the down measurement instruments .the electrical cable and winch needed to lower the instruments into the bore hole, surface instrumentation needs to power the down hole instruments and to receive and process their signal .measurement instruments are usually composed of tow components :- The cartridge: - contains electronics that power the sensors. The snode: contains sensors used in making the measurement. It runs into the bore hole at the end of a wire line connects it to recorders on the surface located in the logging unit. Parameters that are measured-: There are tow types of phenomena that can be studied by wire line logging :- 1. Natural ones “temperature, spontaneous radioactivity, etc “that are measured by a sensor or a receiver with no signal transmitted beforehand. 2. Induced ones "radioactivity, electric logs, wave travel time, etc ”generated by a transmitter and measured by one or more receivers, the unit is mounted on a truck that parked near the well for operations on shore. Well logging is performed in boreholes drilled for the oil and gas, groundwater, mineral and geothermal exploration, as well as part of environmental and geotechnical studies.
- 6. 6 Well logging Well logging summary Compiled by : P.Eng. Mahmoud Jad Wireline Unit: The cabin that contains the surface hardware needed to make wireline logging measurements. The logging unit contains at the minimum the surface instrumentation, a winch, a depth recording system and a data recorder. The surface instrumentation controls the logging tool, processes the data received and records the results digitally and on hard copy. The winch lowers and raises the cable in the well. A depth wheel drives the depth recording system. The data recorder includes a digital recorder and a printer. 1. Onshore: The logging company sends Truck Logging Unit which contains the computers, winch and recorders. 2. Offshore: The logging unit is stored as small house on the rig. Logging While Drilling (LWD): In the 1980s, a new technique, logging while drilling (LWD), was introduced which provided similar information about the well. Instead of sensors being lowered into the well at the end of wireline cable, the sensors are integrated into the drill string and the measurements are made while the well is being drilled. While wireline well logging occurs after the drill string is removed from the well, LWD measures geological parameters while the well is being drilled. However, because there are no wires to the surface, data are recorded downhole and retrieved when the drill string is removed from the hole. A small subset of the measured data can also be transmitted to the surface in real time via pressure pulses in the well's mud fluid column. This mud telemetry method provides a bandwidth of much less than 100 bits per second, although, as drilling through rock is a fairly slow process, data compression techniques mean that this is an ample bandwidth for real- time delivery of information.
- 7. 7 Well logging Well logging summary Compiled by : P.Eng. Mahmoud Jad Measuring While Drilling (MWD): It is the evaluation of physical properties, usually including pressure, temperature and wellbore trajectory in three-dimensional space, while extending a wellbore. MWD is now standard practice in offshore directional wells. The measurements are made downhole, stored in solid-state memory for some time and later transmitted to the surface. Data transmission methods vary from company to company, but usually involve digitally encoding data and transmitting to the surface as pressure pulses in the mud system. Some MWD tools have the ability to store the measurements for later retrieval with wireline or when the tool is tripped out of the hole if the data transmission link fails. 1.5 Objectives of well logging Determination the nature and amount of fluids contained in the rocks. Estimation of accurate values of hydrocarbons saturation. Estimation of accurate values of water saturation. Estimation of hydrocarbon in place Estimation of recoverable hydrocarbon Determination of the lithology of the reservoir rock. Determination of permeability index. Determination of porosity. Fracture detection Determination of water salinity Reservoir pressure determination Water flood feasibility Reservoir quality mapping Identify potential reservoir rocks and cap rocks. Analyze sediment deposition conditions. Locate “woc” & “goc “. Correlation of offset wells.
- 8. 8 Well logging Well logging summary Compiled by : P.Eng. Mahmoud Jad 1.6 Advantages and Limitations of Well Logging Advantages: Limitations: o Continuous measurements o Easy and quick to work with Short time acquisition o Better resolution than seismic data o Economical o More advanced tools o Better depth control o Only choice available (certain tools). o More certain on data quality o Indirect measurements o Limited by tool specification o Affected by environment o Varying resolution o Invasion effect o Hole condition dependent. o Unable to log in high angle wells (>60 deg ) o Acquired after drilling, more rig time o More uncertainty in getting data or good data in problem prone wells 1.7 Types of well logging There are three major types of well logs: 1. The logs used by geologists and reservoir engineers to evaluate the characteristics of the formations and fluids and quantify them. 2. The logs used by drillers that provide technical information. 3. The logs used by production staff to study fluid and fluid flow phenomena.
- 9. 9 Well logging Well logging summary Compiled by : P.Eng. Mahmoud Jad 1.8 Logging tools These are electronic devices that records data over depth. The tool is attached to the end of wireline cable & lowered to the borehole. There are many types of tools such BHC tool, GR tool, Density tool and many others. Usually, these tools are integrated as measurement sensors in one tool called Sonde. Cartridge: The section of a wireline logging tool that contains the telemetry, the electronics and power supplies for the measurement, as distinct from the sonde that contains the measurement sensors.
- 10. 10 Well logging Well logging summary Compiled by : P.Eng. Mahmoud Jad Caliper Tool: The Caliper Tool is a 3 armed device that measures the internal diameter (I.D.) of casing or open borehole completions. This information is crucial to all types of production logging. The caliper probe provides a “first look” at borehole conditions in preparation for additional logging. It uses a tool which has 2, 4, or more extendable arms. The caliper is a useful first log to determine the borehole conditions before running more costly probes or those containing radioactive sources. The log is used to: "Interpretation Goals" measure borehole diameter, Location of cracks, fissures, caving, faulting, casing breaks. assess borehole quality and stability For calculation of pore volume for pile construction. Input for environmental corrections for other measurements. Qualitative indication of permeability. Correlation. Correction of other logs affected by borehole diameter Provide information on build-up of mudcake adjacent to permeable zones. Locate packer seats in open hole. Notes Increasing in diameter of borehole indicates about Wash out Process (ex: Shale). Decreasing in diameter of borehole indicates about Invasion process (ex: Porous Sand).
- 11. 11 Well logging Well logging summary Compiled by : P.Eng. Mahmoud Jad Conventional Geophysical Well Logs [Adapted and Expanded from Keys (1990)] Type of log Varieties and related techniques Properties measured Potential application Required hole conditions Other limitations Spontaneous potential. Electric potential caused by salinity differences in borehole and interstitial fluids. Lithology, shale content, water quality. Uncased hole filled with conductive fluid. Salinity difference needed between borehole fluid and interstitial fluids. Single-point resistance. Conventional, differential. Resistance of rock, saturating fluid, and borehole fluid. High-resolution lithology. Fracture location by differential probe. Uncased hole filled with conductive fluid. Not quantitative; hole diameter effects significant. Multi- electrode resistivity. Normal, focused, or lateral. Resistivity, in ohm-meters, of rock and saturating fluids. Quantitative data on salinity of interstitial water; lithology. Uncased hole filled with conductive fluid. Normals provide incorrect values and thicknesses in thin beds. Electrical induction. Deep, shallow, and focused. Resistivity, in ohm-meters, of rock and saturating fluids. Quantitative data on salinity of interstitial water; lithology. Open hole with plastic casing. Skin effect correction for highly conductive formation. Natural gamma. Gamma spectral. Gamma radiation from natural or artificial radioisotopes. Lithology-may be related to clay and silt content and permeability; spectral identifies radioiso-topes. Any hole conditions, except very large, or several strings of casing and cement. Very high counts need to be corrected for dead-time. Gamma- gamma. Compensated (dual detector). Electron density. Bulk density, porosity, moisture content, lithology. Optimum results in uncased; qualitative through casing or drill stem. Severe hole-diameter effects. Neutron. Epithermal, thermal, compensated activation, pulsed. Hydrogen content. Saturated porosity, moisture content, activation analysis, lithology. Optimum results in uncased; can be calibrated for casing. Hole-diameter and chemical effects. Acoustic velocity. Compensated wave form. Compressional wave velocity. Porosity, lithology, fracture location, and character, cement bond. Fluid-filled, 3 to 16 inch diameter. Does not see secondary porosity. Acoustic televiewer. Acoustic caliper. Acoustic reflectivity of borehole wall. Location, orientation, and character of fractures and solution openings, strike and dip of bedding, casing inspection. Fluid-filled. Heavy mud or mud cake attenuate signal; very slow log. Caliper. Oriented, 4-arm high-resolution bow spring. Hole or casing diameter. Hole-diameter corrections to other logs, lithology, fractures, hole volume for cementing. Any conditions. Deviated holes limit some.
- 12. 12 Well logging Well logging summary Compiled by : P.Eng. Mahmoud Jad Fluid column temperature. Differential. Temperature of fluid near sensor. Geothermal gradient, in-hole flow, location of injected water, correction of other logs, curing cement. Fluid-filled. Accuracy and resolution of tools varies. Fluid column conductivity. Resistivity. Most measure resistivity of fluid in hole. Quality of borehole fluid, in- hole flow, location of contaminant plumes. Fluid-filled. Accuracy varies, requires temperature correction. Flow. Spinner, tracer, thermal pulse, electromagnetic. Velocity of net flow in borehole. In-hole flow, location, and apparent Hydraulic conductivity of permeable interval. Fluid-filled. Spinners require higher velocities. Needs to be centralized. Some of Special logging Tools Resistivity Based Imaging Tool - Pad device on 4 to 6 arm caliper, few mm resolution - Application: Thin bed Evaluation, Dip meter, Paleostream direction, fracture evaluation, stratigraphy. Nuclear Magnetic Resonance - Using Permanent magnet to realign hydrogen protons to new magnetic field, a Lithology dependence porosity, saturation and permeability estimation Dipole Shear Sonic - Shear measurement, AVO and Rock mechanics applications Borehole sonic imaging - Acoustic based borehole imaging for 360 coverage, lower resolution than resistivity based imaging tools. Modular Formation Test - Very robust formation tester with the capability to take unlimited pressure tests, pump the fluid into the borehole, identify the fluid type before sampling Wellbore Seismic - VSP: Vertical seismic profile surface guns, wellbore detectors - SAT: Seismic acquisition tool - WST: Well seismic tool - DSA: Downhole seismic array tool (3 axis geophones)
- 13. 13 Well logging Well logging summary Compiled by : P.Eng. Mahmoud Jad Some of modern logging tools
- 14. 14 Well logging Well logging summary Compiled by : P.Eng. Mahmoud Jad 1.9 Selection of the Tools to run It depends on what type of information you are about to get and the cost you are willing to spend. Ability to Define Your Need: Geological Geophysical Reservoir Petrophysical Mechanical Type of Information to Acquire Geology Geophysics Petro-physics Reservoir Rock Mechanics Sand development and sand thickness Stratigraphic information Lateral continuity Hydrocarbon source Velocity uncertainty Well to seismic tie Seismic and fluids/lithology correlation Porosity Water saturation Permeability Mineralogy Compartment Fluid properties Reservoir pressure Reservoir monitoring Stress direction Pressure profile Fracture orientation 1.10 Well Log Interpretation The three most important questions to be answered by well site interpretation are: 1. Does the formation contain hydrocarbons, and if so at what depth and are they Oil or gas? 2. If so, what is the quantity present? 3. Are the hydrocarbons recoverable? 1.10.1 Interpretation procedure The basic logs, which are required for the adequate formation evaluation, are: 1. Permeable zone logs (SP, GR, Caliper) 2. Resistivity logs (MFSL, Shallow and Deep resistivity logs) 3. Porosity logs (Density, Neutron and Sonic).
- 15. 15 Well logging Well logging summary Compiled by : P.Eng. Mahmoud Jad Generally, the permeable zone logs are presented in track one, the resistivity logs are run in track two and porosity logs on track three. Using such a set of logs, a log interpreter has to solve the following problems, (I). Where are the potential producing hydrocarbons zones? (II). How much hydrocarbons (oil or gas) do they contain? First step: The first step in the log interpretation is to locate the permeable zones. Scanning the log in track one and it has a base line on the right, which is called the shale base line. This base line indicates shale i.e., impermeable zones and swings to the left indicate clean zones- e.g., sand, limestone etc. The interpreter focuses his attention immediately on these permeable zones. Next step: To scan the resistivity logs in track 2 to see which of the zones of interest gives high resistivity readings. High resistivity reflects either hydrocarbons in the pores or low porosity. Next step: Scan the porosity logs on the track 3 to see which of the zones have good porosity against the high resistivity zones. Discard the tight formations. Select the interesting zones for the formation evaluation. 1.10.2 Quantitative interpretation Procedure: 1. Ensure that the logs are “on depth” relative to each other by taking a “marker “which is an anomaly or a distinctive response that appear on all logs in the same depth, so the logs are all “on depth”. 2. Take the readings from the attached logs (if there are any corrections, make them carefully). 3. Calculate porosity from sonic log and density log. Calculate the shale correction for neutron and density log. Calculate the hydrocarbon correction for neutron and density log. Calculate the effective porosity Calculate the formation factor Calculate water saturation and oil saturation. 1.10.2.1 Estimation of shale content (Vsh): First we should estimate shale / radioactivity index (Ish):- From gamma ray log: Where: = gamma ray response in the zone of interest =the average gamma ray response in the clean sand formation = the average gamma ray response in the cleanest shale formation Vsh = 𝜸𝒍𝒐𝒈− 𝜸 𝒎𝒊𝒏 𝜸 𝒎𝒂𝒙− 𝜸 𝒎𝒊𝒏
- 16. 16 Well logging Well logging summary Compiled by : P.Eng. Mahmoud Jad Empirical correlations relating shale content to gamma ray shale index, Ish Then The shale volume can be calculated from one of the following methods 01 For tertiary rocks, the larionov equation is: 02 The stieber equation is: − 03 The clavier et al equation is: √ 04 For older rocks, the larionov equation is: Note: Tertiary model gives the least value as shown in figure and will be used in the analysis. 05 From resistivity log √ Where: Rt = is the reading from resistivity log Rtsh= is the resistivity opposite to the cleanest shale zone 06 from neutron porosity log: Where: Øn = neutron porosity log reading at zone of interest (Øn)sh= neutron porosity log reading opposite to the cleanest shale zone
- 17. 17 Well logging Well logging summary Compiled by : P.Eng. Mahmoud Jad 07 From cross-plot: − − Where: Øn = neutron porosity log reading at zone of interest (Øn) sh= neutron porosity log reading opposite to the cleanest shale zone Ød = density porosity log reading at zone of interest (Ød) sh= density porosity log reading opposite to the cleanest shale zone Calculation of minimum Vshale, (Vsh,min) is the smallest value of Vsh among Vsh values. 1.10.2.2 Determination of porosity from density log (фd):- Firstly by using the attached (ρb -log) determine every reading at selected interval then determine (ф d). Where: is the measured bulk density (from Lithe-Density tool) is the density of the matrix (depends on lithology) is the density of the fluid in pore volumes. is the percent volume of pore space . 1.10.2.3 Determination of porosity from sonic log (фs):- Firstly by using the attached ( t -log) determine every reading at selected interval then determine (ф s). Where: tlog is the reading on the sonic log in µsec/m tmat is the transit time of the matrix material tf is the transit time of the saturating fluid 1.10.2.4 Corrections: 1. Correction for sandstone: Since the neutron porosity log measures the porosity in l.S Units, three porosity units are added to the apparent neutron porosity to obtain the corrected neutron porosity for sandstone. Ønc = øn + 3 𝑡 𝑙𝑜𝑔− 𝑡 𝑚𝑎𝑡 𝑡 𝑓−𝑡 𝑚𝑎𝑡
- 18. 18 Well logging Well logging summary Compiled by : P.Eng. Mahmoud Jad 2. Correction for shale: a) For neutron porosity: Where: Ønc = corrected neutron porosity to shale. Øn = apparent neutron porosity from log. Ønsh = apparent neutron porosity opposite to the cleanest shale. b) For density porosity: Where: Ødc = corrected density porosity to shale Ød = apparent density porosity from log Ødsh = apparent density porosity opposite to the cleanest shale 3. Correction for hydrocarbon effect: Light oil or gas will cause the formation density (ρb) to decrease by an amount of ∆ρb & apparent porosity (ød & øn) to increase by an amount of ( ∆ød & ∆øn ) respectively . [ ] [ ] (Ρb)corr. = ρb + ∆ ρb (Øn )corr. = øn + ∆øn (Ød)corr. = ød - ∆ød Where: Sor = residual hydrocarbon saturation (from relative permeability curves) P = formation water salinity (ppm) 1.10.2.5 Determination of effective porosity:- After determination of corrected porosity for shale and hydrocarbon: √
- 19. 19 Well logging Well logging summary Compiled by : P.Eng. Mahmoud Jad 1.10.2.6 Determination of water resistivity (Rw):- 1. From bulk density V.s resistivity plot. By using the attached logs we should determine values of (Rt) & (ρb). Then draw “Hingle plot “which is a relation ship between (ρb) and (1/Rt .5 ) Connect the point which determines the matrix density with the most Upper points in the chart this line will be (%100) Sw line. (Rt) value which be on this line equal the value of (Ro). Then determine the value of porosity from the (ρb) value which is in this line. The formation factor (F) equal (1/ ф2 ). 2. From charts by using formation water salinity & reservoir temperature 3. From SP. 4. From Rxo & Rt 1.10.2.7 Calculation of water saturation:- Sw% can be determined by the following equation: √ Where: F = formation factor Rw = formation water resistivity Rt = true formation resistivity That equation is for clean sand but for shaly sand the equation becomes: √ 1.10.2.8 Determination of hydrocarbon saturation:- Sh% can be calculated from the following equation 1.10.2.9 Determination the volume of:- Water :- =фeff *Sw Oil :- = фeff *Shyd Residual oil :- = фeff * Sor
- 20. 20 Well logging Well logging summary Compiled by : P.Eng. Mahmoud Jad 1.11 References “Schlumberger log interpretation”,vol.9, 1 (9171-1989) Donald P. Helander“fundamental of formation evaluation”, oil & gas consultants, international Inc., Tulsa. E.R.Crain,”the log analysis handbook”, vol. 9, Pennwell publishing co., Tulsa, oklahoma, USA. “Theory, measurement, and interpretation of well logs”, Zaki Bassiouni, SPE textbook series vol.4. Geology & Geophysics in Oil Exploration 2010 by: Geophysicist, Mahmoud Ahmed Sroor.