Download as PDF, PPTX

![5-. References
[1]Cabello,P.,Falivene,O.,López-Blanco,M.,Howell,JohnA.,Arbués,P.,Ramons,E.(2011).Anoutcrop-basedcomparisonoffaciesmodellingstrategiesinfan-deltareservoiranaloguesfromtheEoceneSantLlorençdelMuntfan-delta(NESpain).Pet.Geocience,Vol.17,pp.65-90.
[2]Cabello,P.,López-Blanco,M.,Howell,J.,Arbués,P.,Ramos,E.(2009).Modellingfaciesbeltdistributioninfandeltascouplingsequencestratigraphyandgeostatics:TheEoceneSantLlorençdelMuntexample(Ebroforelandbasin,NESpain).Elsevierltd.MarineandpetroleumGeology.
[3] Dubrule, O. & Damsleth, E. 2001. Achievements and challenges in petroleum geostatistics. Petroleum Geocience, 7, S1-7.
Deutsch, C.V. 1999. Reservoir modelling with publicly available software Computers & Geociences, 24, 69-76.
[4] FaliveneO., Arbués, P., Howell, J., Muñoz, J.A., Fernandez, O. & Marzo, M. 2006, Hierarchical geocellularfacies modelling of a turbiditereservoir analogue from the Eocene of the AinsaBasin, NE Spain. Marine and Petroleum Geology, 23, 679-701.
[5]Gómez-Paccard,M.,López-Blanco,M.etal.(2012).Tectonicandclimaticcontrolsonthesequentialarrangementofanalluvialfan/fan-deltacomplex(Montserrat,Eocene,EbroBasin,NESpain).BasinResearch24,437-455.Pg.3.](https://image.slidesharecdn.com/3dfaciesmodellingfianl-141125075055-conversion-gate02/75/3D-Facies-Modeling-35-2048.jpg)
![[6] Gundeso, R. & Egeland, O. 1990. SESIMIRA: a new geological tool for 3D modelling of heterogenousreservoirs. In:Buller, A.T., Berg, E., Hjelmeland, O., Kleppe, J., Torsaeter, O. & Aasen, J.O (eds) North Sea oil and Gas Reservoirs II.TheNorwegian Institute of Technology, Graham & Trotman, London, 363-371.
[7] Jackson, M.D., Hampson, G.J. & Sech, R.P. 2009. Three-dimensional modelling of a shoreface-shelf parasequencereservoir analog: Part 2. Geologic controls on fluid flow and hydrocarbon recovery. American Association of PpetroleumGeologists Bulletin, 93, 1183-1208.
[8]López-Blanco,M.(2006).StratigraphicandtectonosedimentarydevelopmentoftheEoceneSantLlorençdelMuntandMontserratfan-deltacomplexes(SoutheastEbrobasinmargin, NortheastSpain).CONTRIBUTIONStoSCIENCE,3(2):125-148.Pg.134
[9]López-Blanco,M.(1993).StratigraphyandsedimentarydevelopmentoftheSantLlorençdelMuntfan-deltacomplex(Eocene,southernPyreneanforelandbasin,norheastSpain).Int. Ass.Sediment,20,67-88.
[10] Matheron, G., Beucher, H., de Fouquet, H., Galli, A., Gerillot, D. & Ravenne, C. 1987. Conditional simulation of the geometry of fluviodeltaicreservoirs. Paper SPE 16753, presented at the 62ndAnnual SPE Conference and Exhibition, Dallas, 27-30 September, 591-599.
Stanley, K.O., Jorde, K., Raestad, N. & Stockbridge, C.P. 1990. Stochastic modelling of reservoir sandbodiesfor input to reservoir simulation, Snorrefield , northern North Sea, Norway. In: Buller, A.T., Berg, E., Hjelmeland, O., Kleppe, J, Torsaeter, O. & Aasen, J.O. (eds) North Sea Oil and Gas Reservoirs II. The Norwegian Institute of Technology, Graham & Trotman, London, 91-103.
5-. References](https://image.slidesharecdn.com/3dfaciesmodellingfianl-141125075055-conversion-gate02/75/3D-Facies-Modeling-36-2048.jpg)
![[11] Sech, R.P., Jackson, M.D. & Hampson, G.J. 2009. Three-dimensional modelling of a shoreface- shelf parasequencereservoir analog: Part 1. Surface-based modelling to capture high-resolution facies architecture. American Association of Petroleum Geologists Bulletin, 93, 1155-1181.
[12] TravéA. (1988). Estratigrafiai Sedimentologiadelsdipòsitsdeltaicsde l’eocèmitjà-superior al sector de Manresa. Universitatde Barcelona Phdthesis, pp. 85.
Valles J.C. (1985). Facies y evolución del complejo de abanico deltaico de Montserrat en la transversal del rio Llobregat (Eoceno, Provincia de Barcelona). Phdthesis, pp. 66
5-. References](https://image.slidesharecdn.com/3dfaciesmodellingfianl-141125075055-conversion-gate02/75/3D-Facies-Modeling-37-2048.jpg)

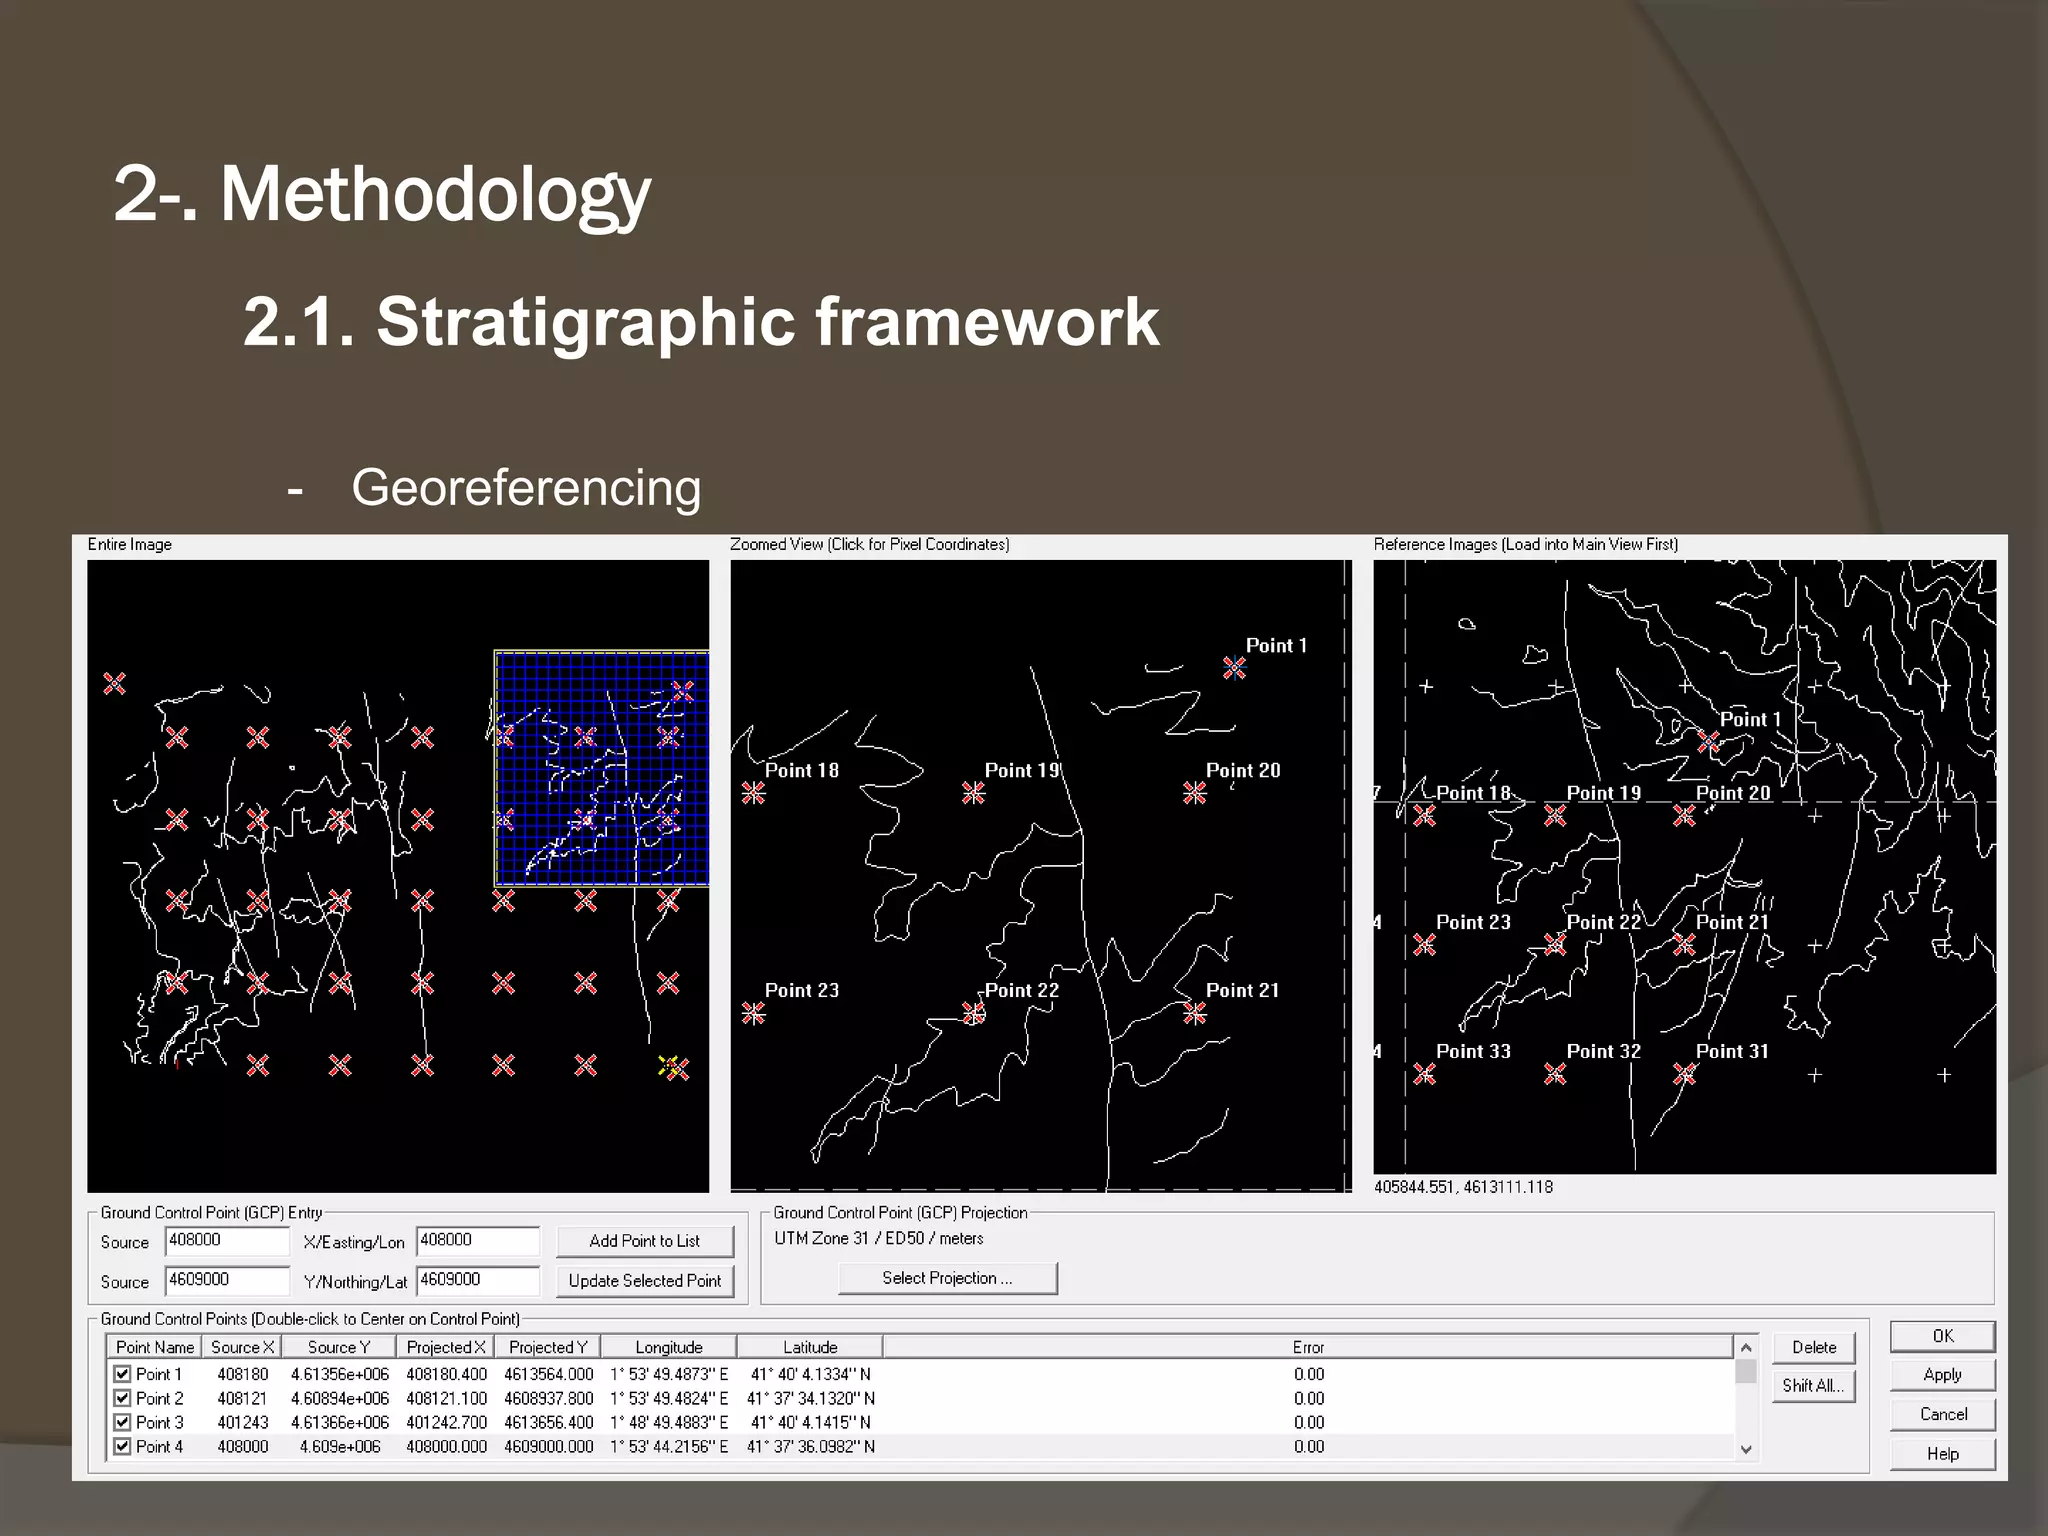
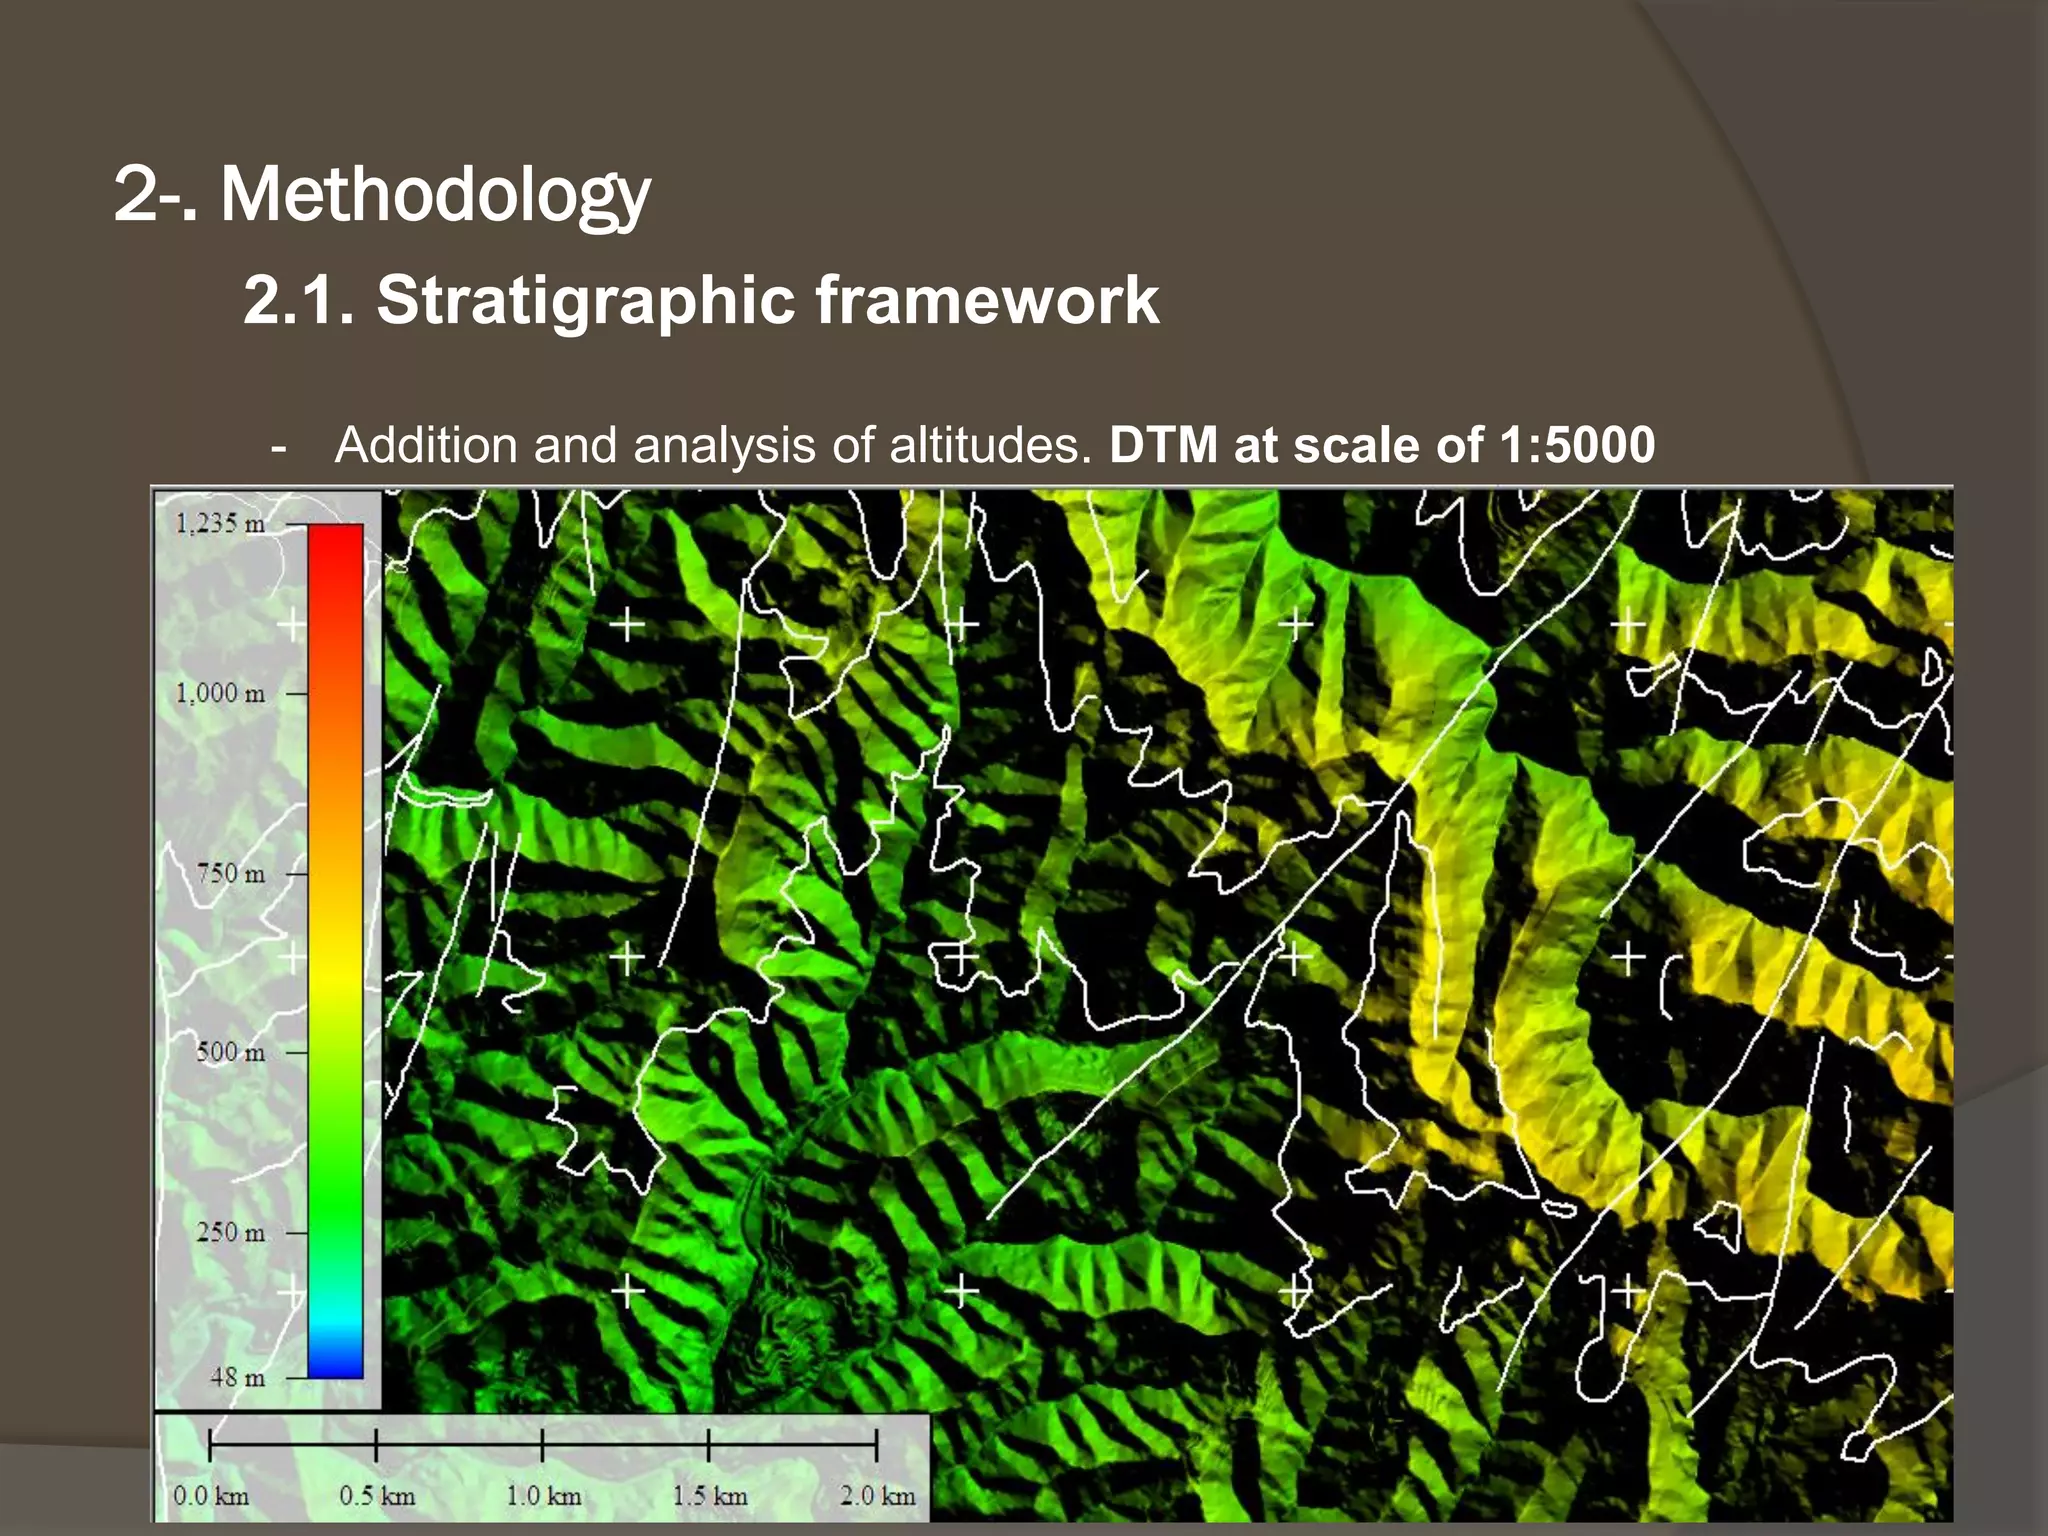
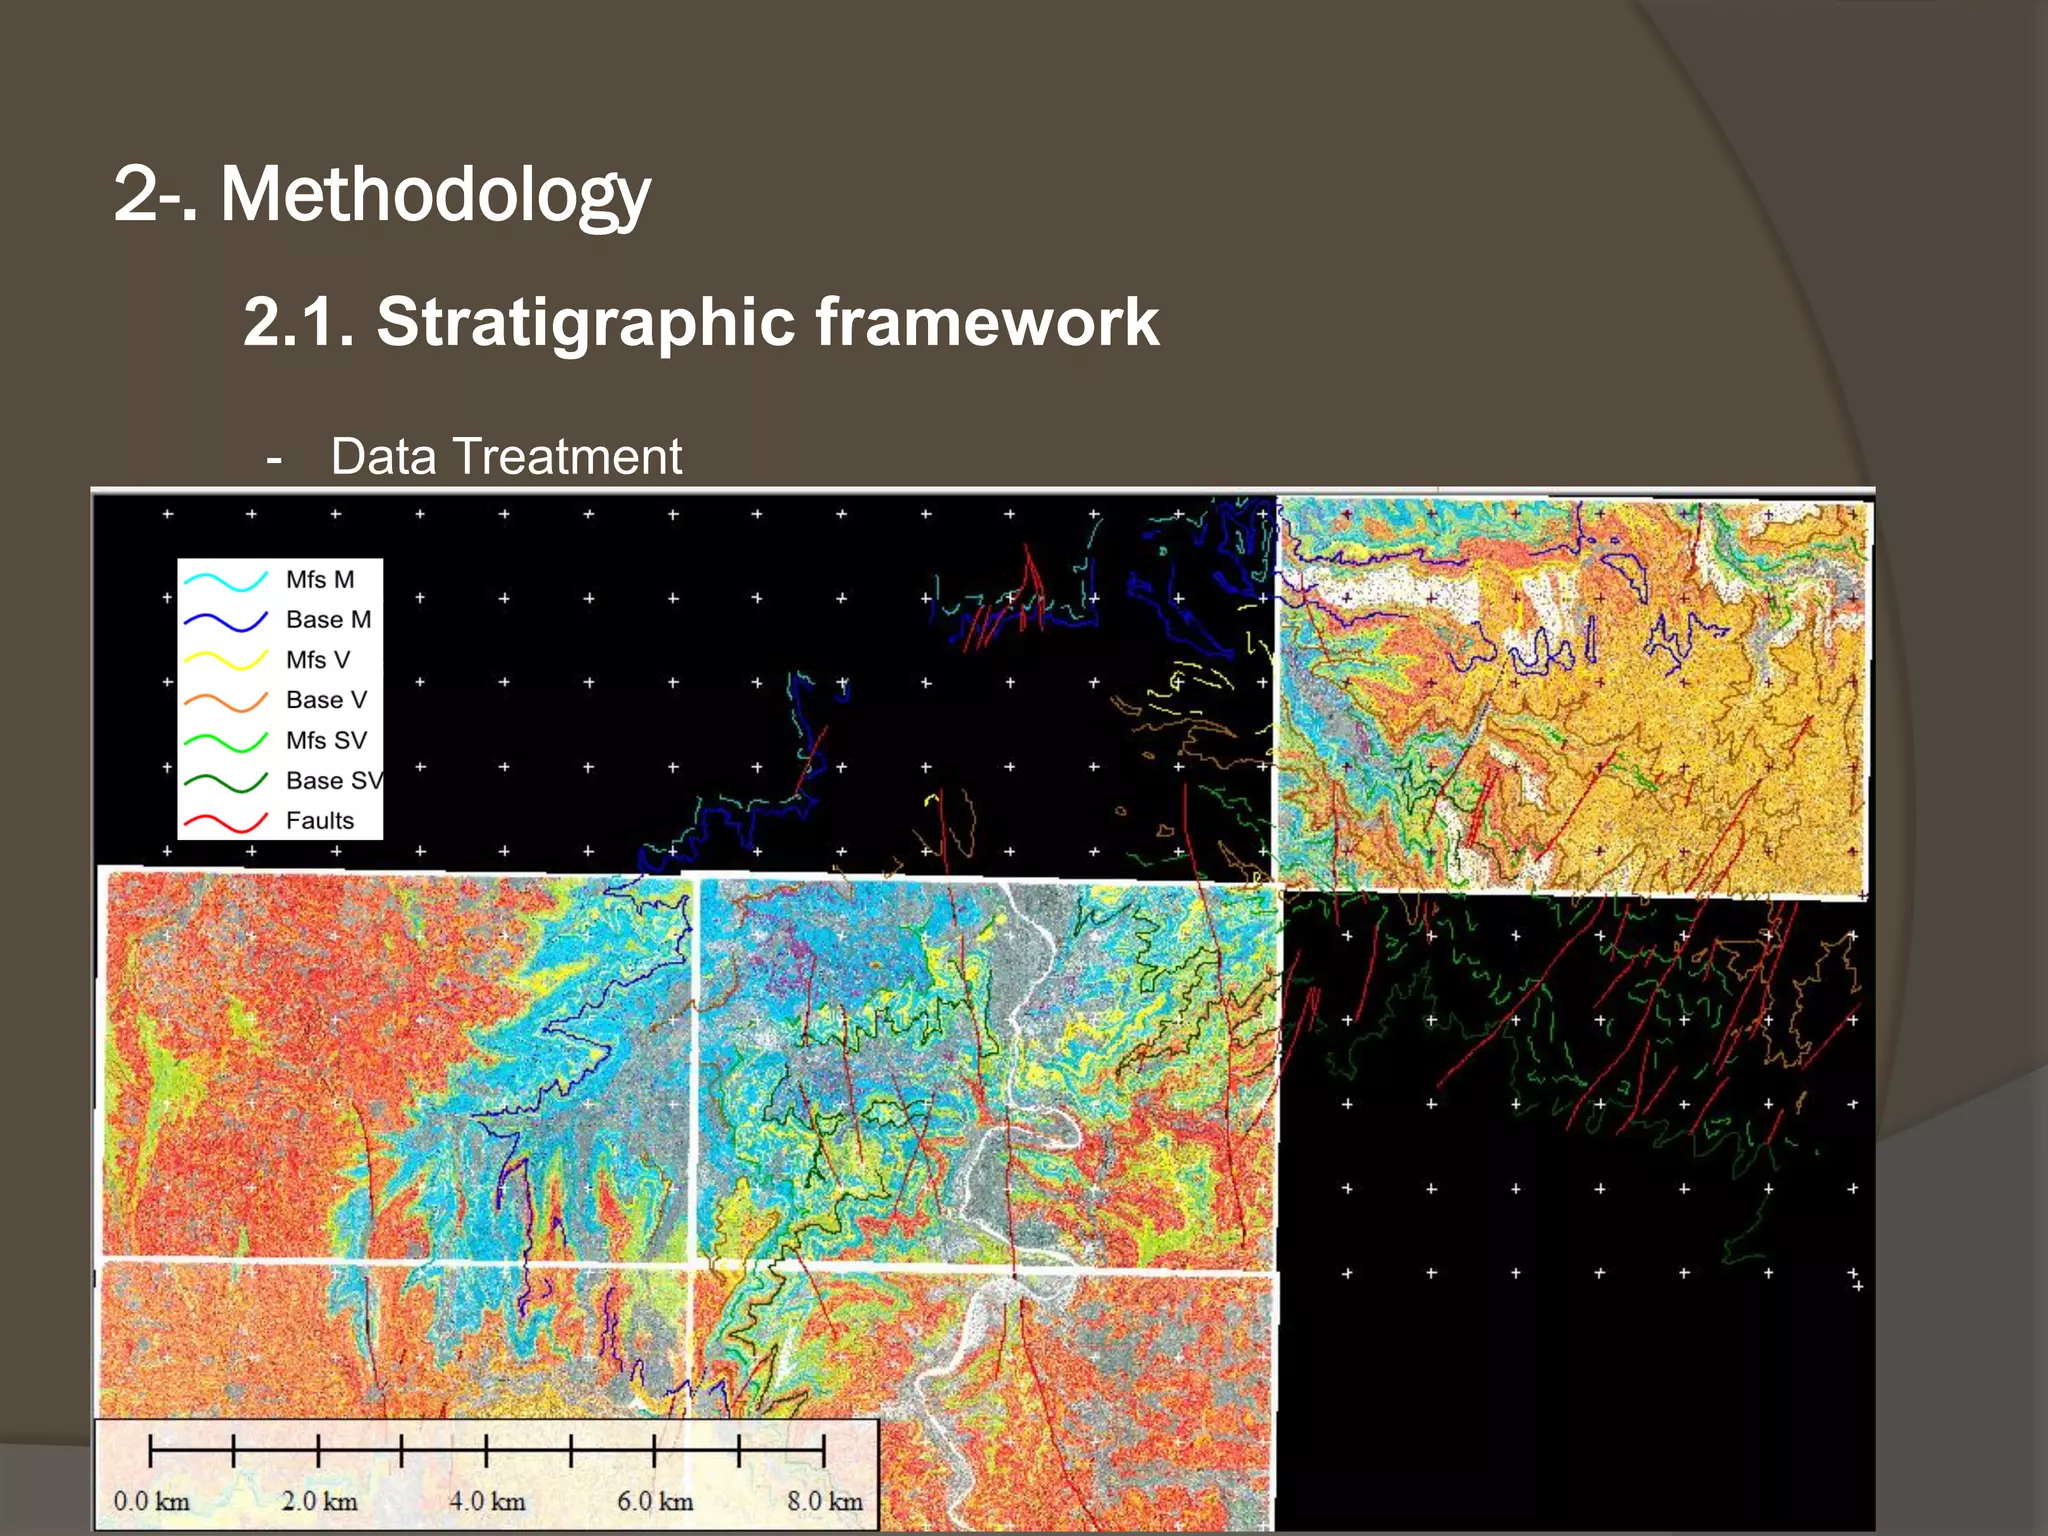
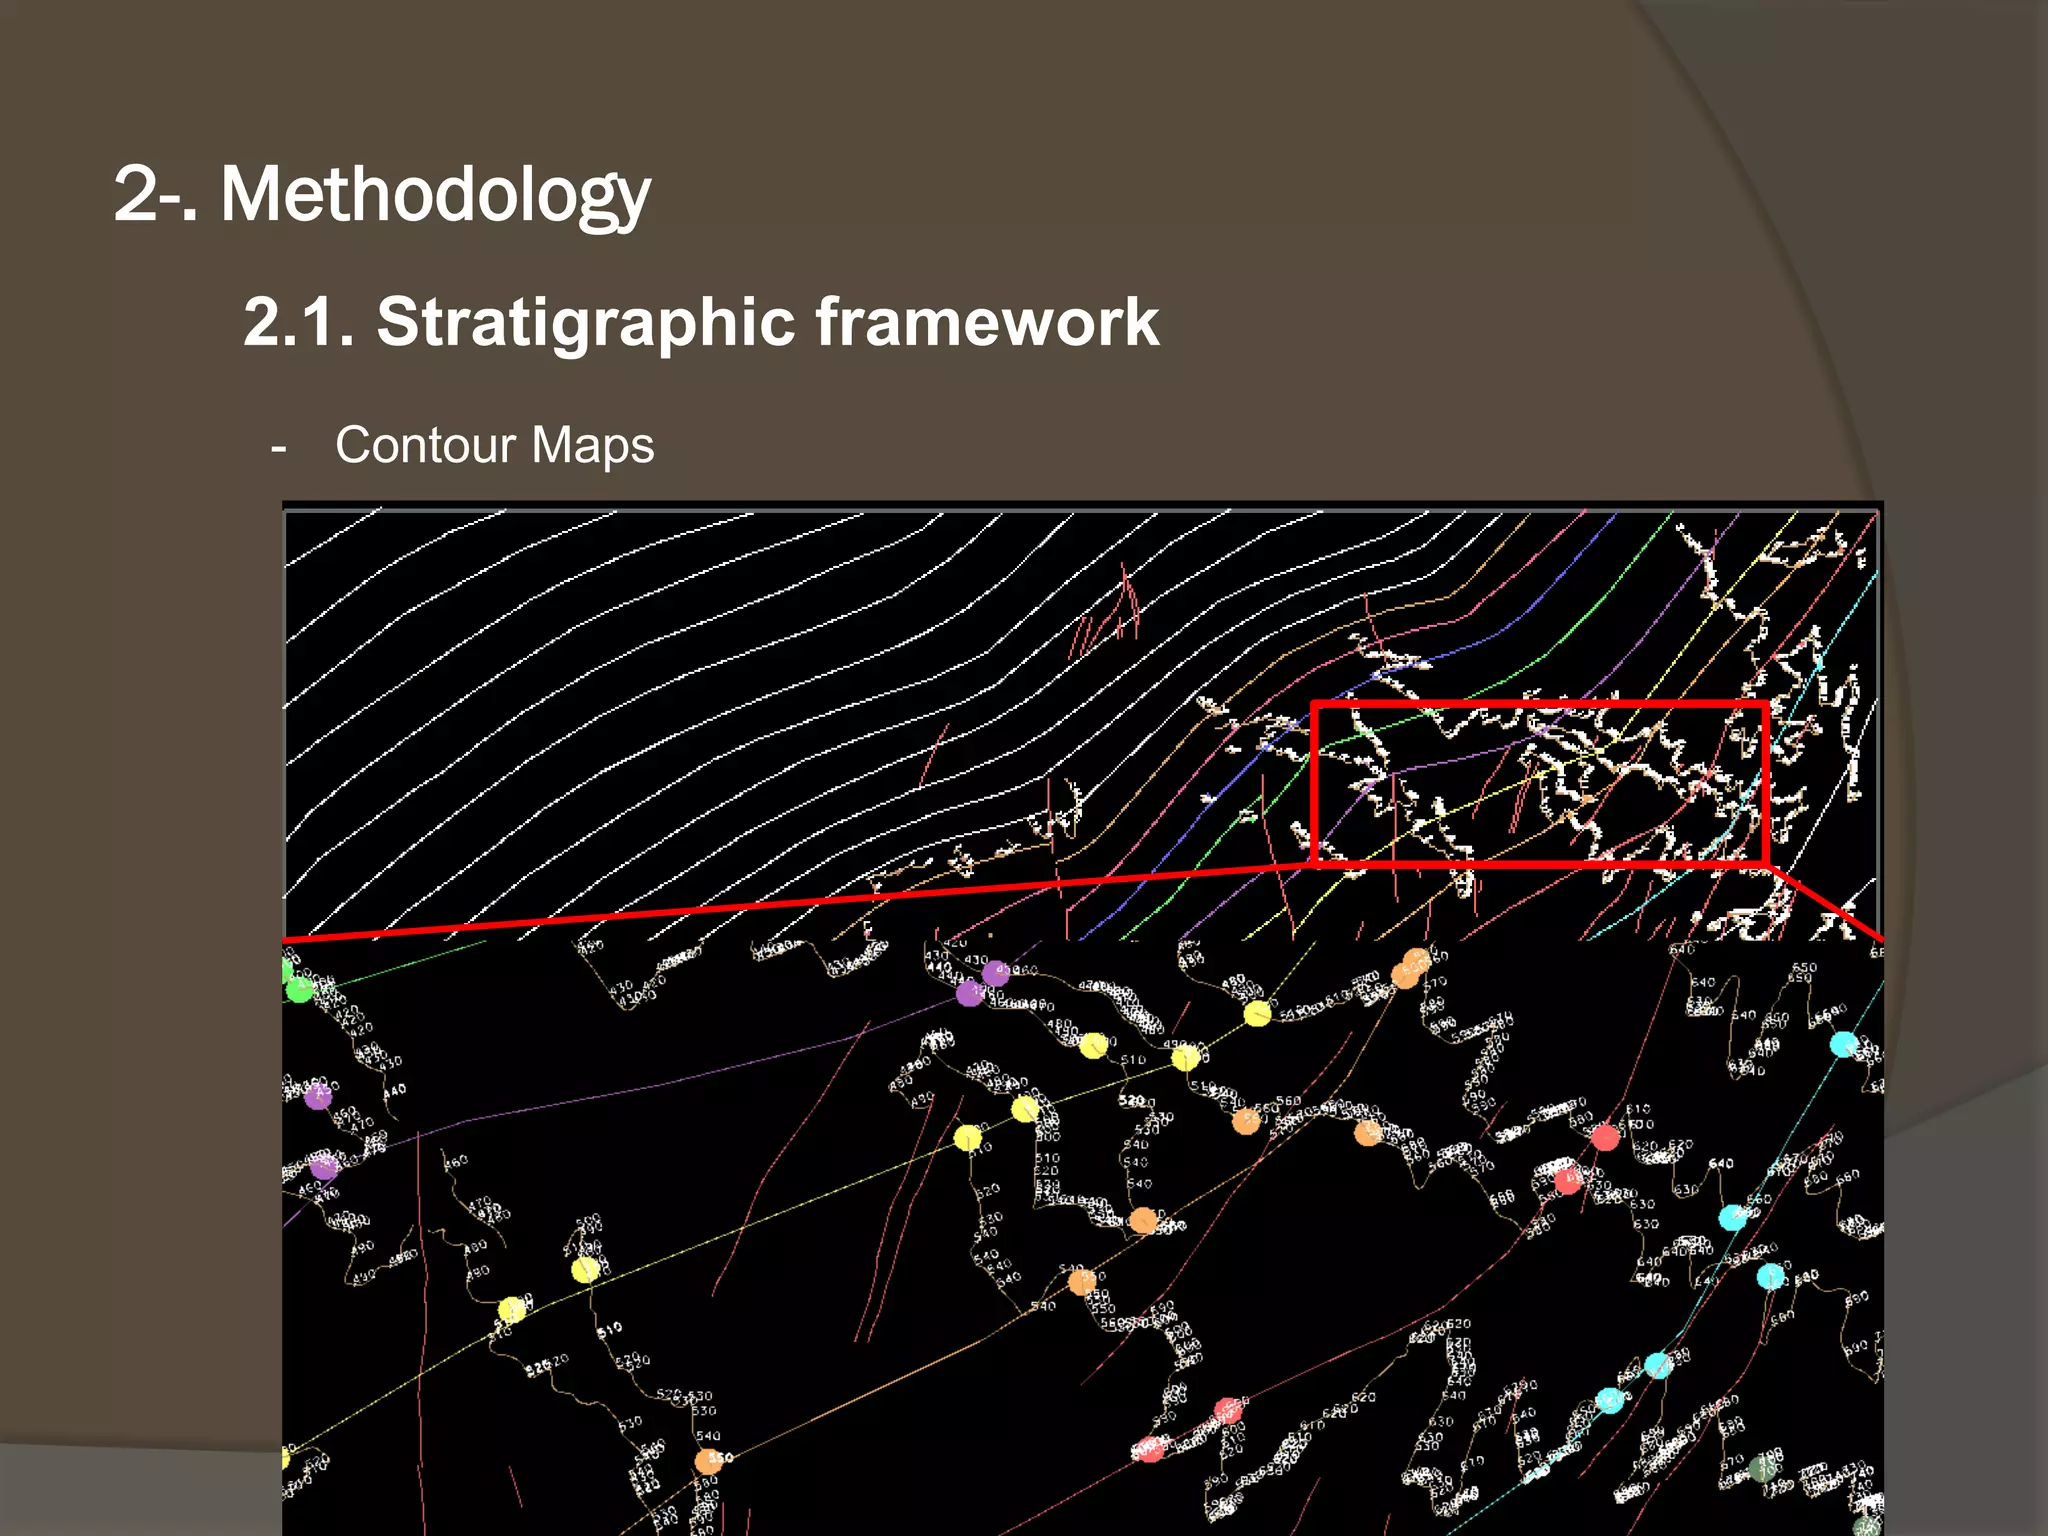
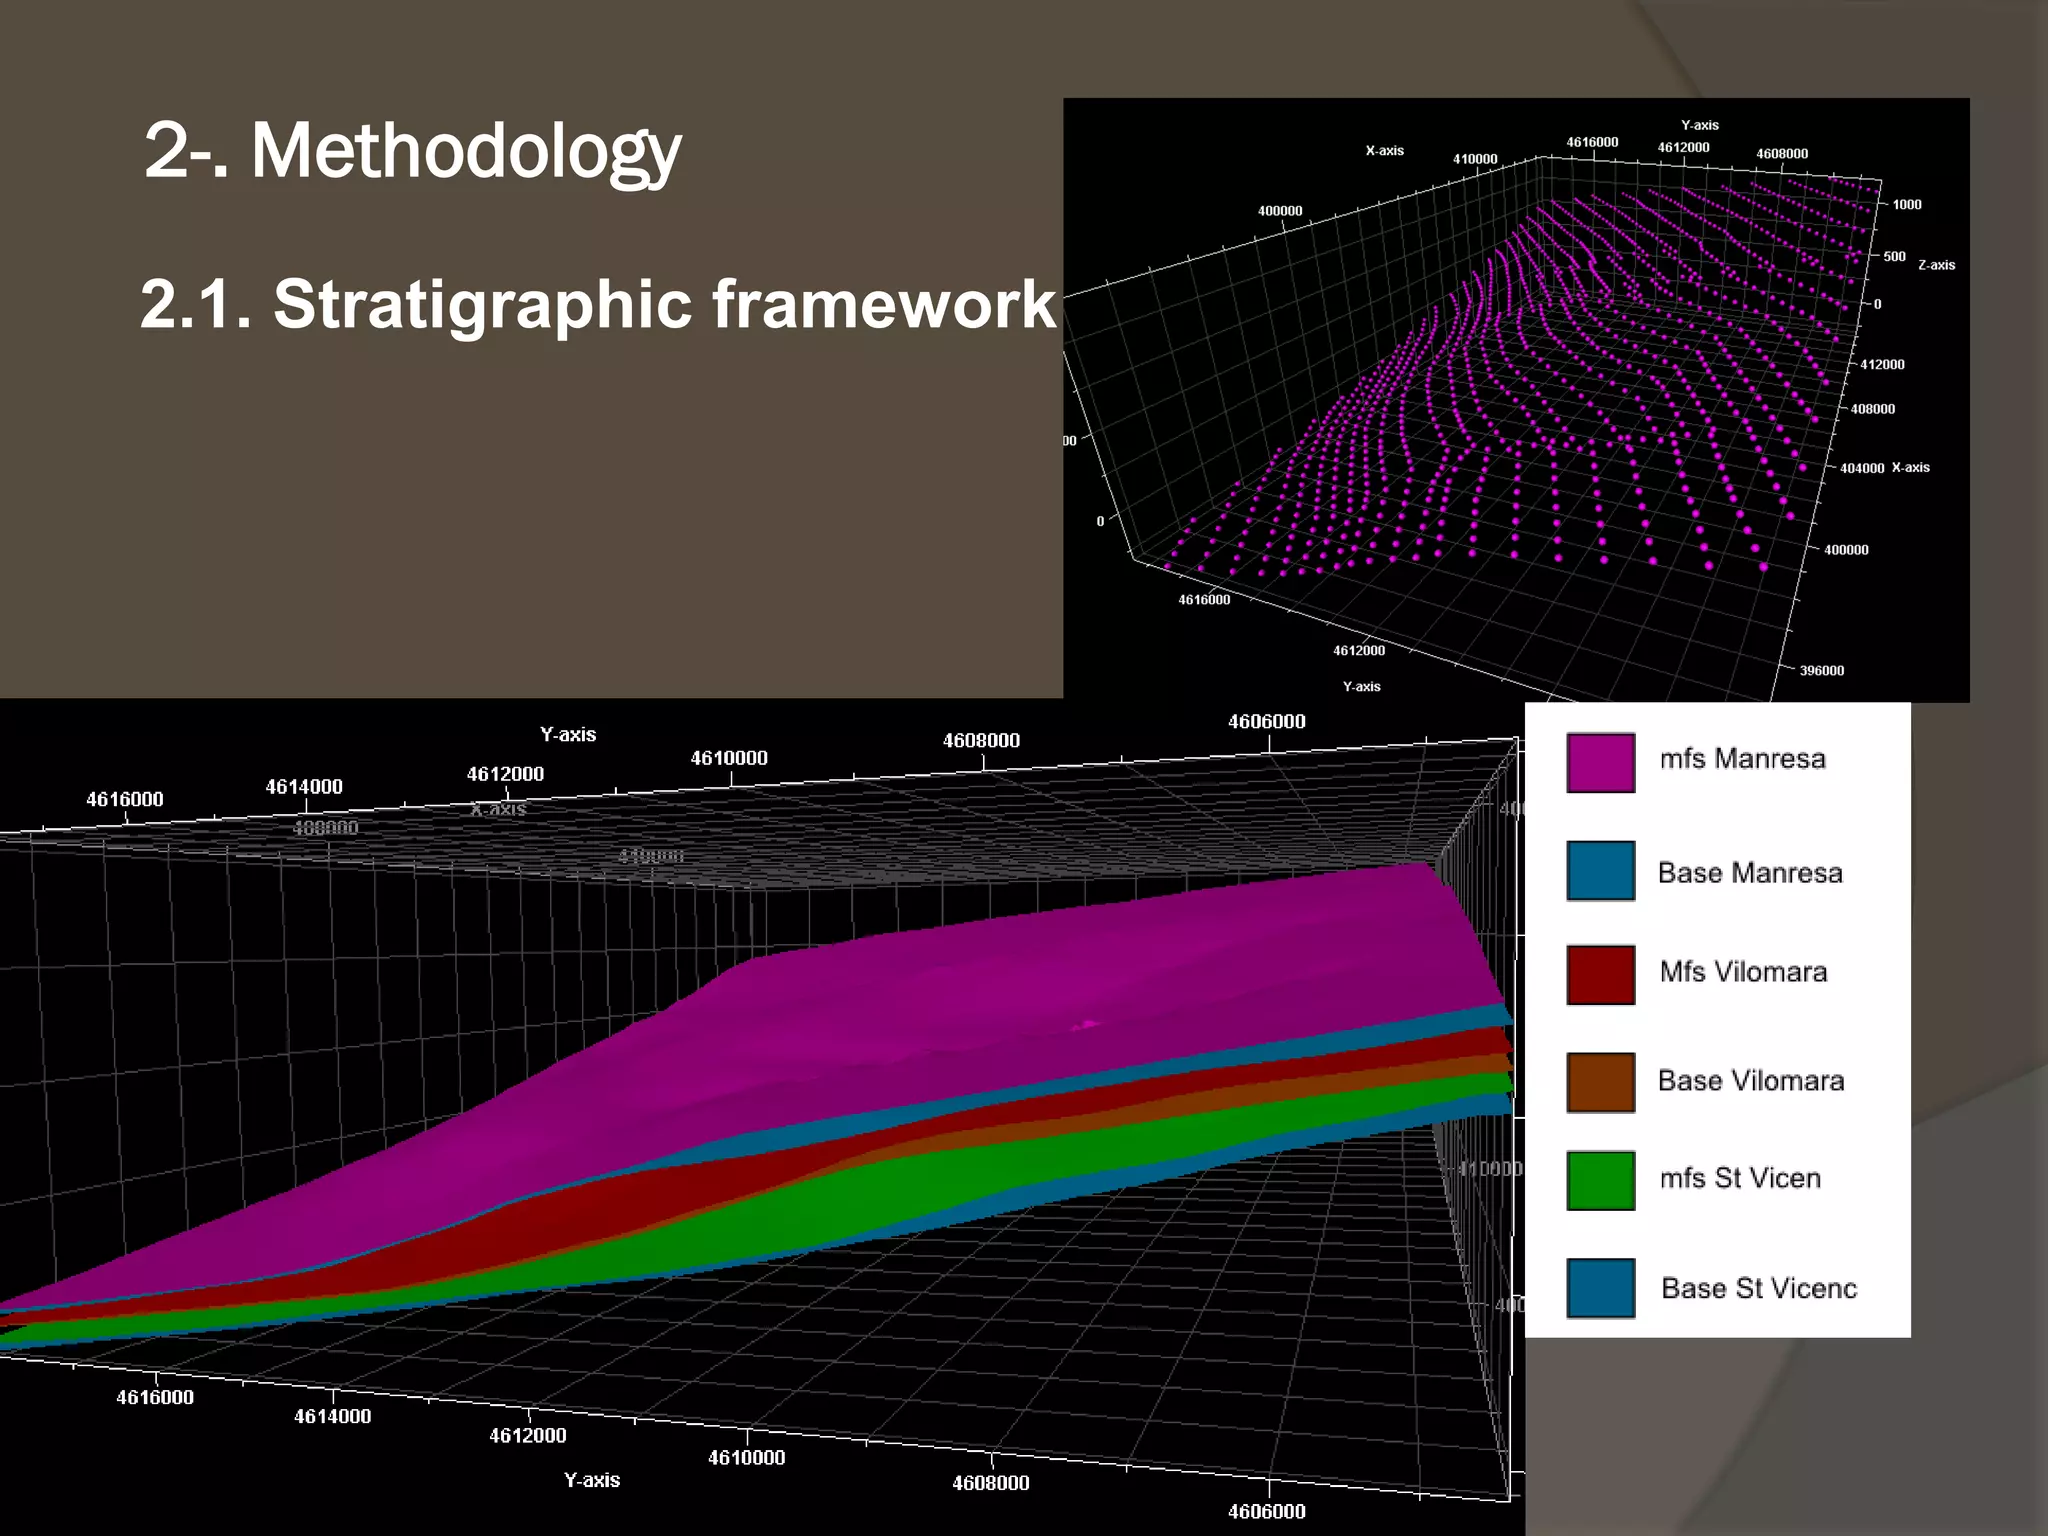
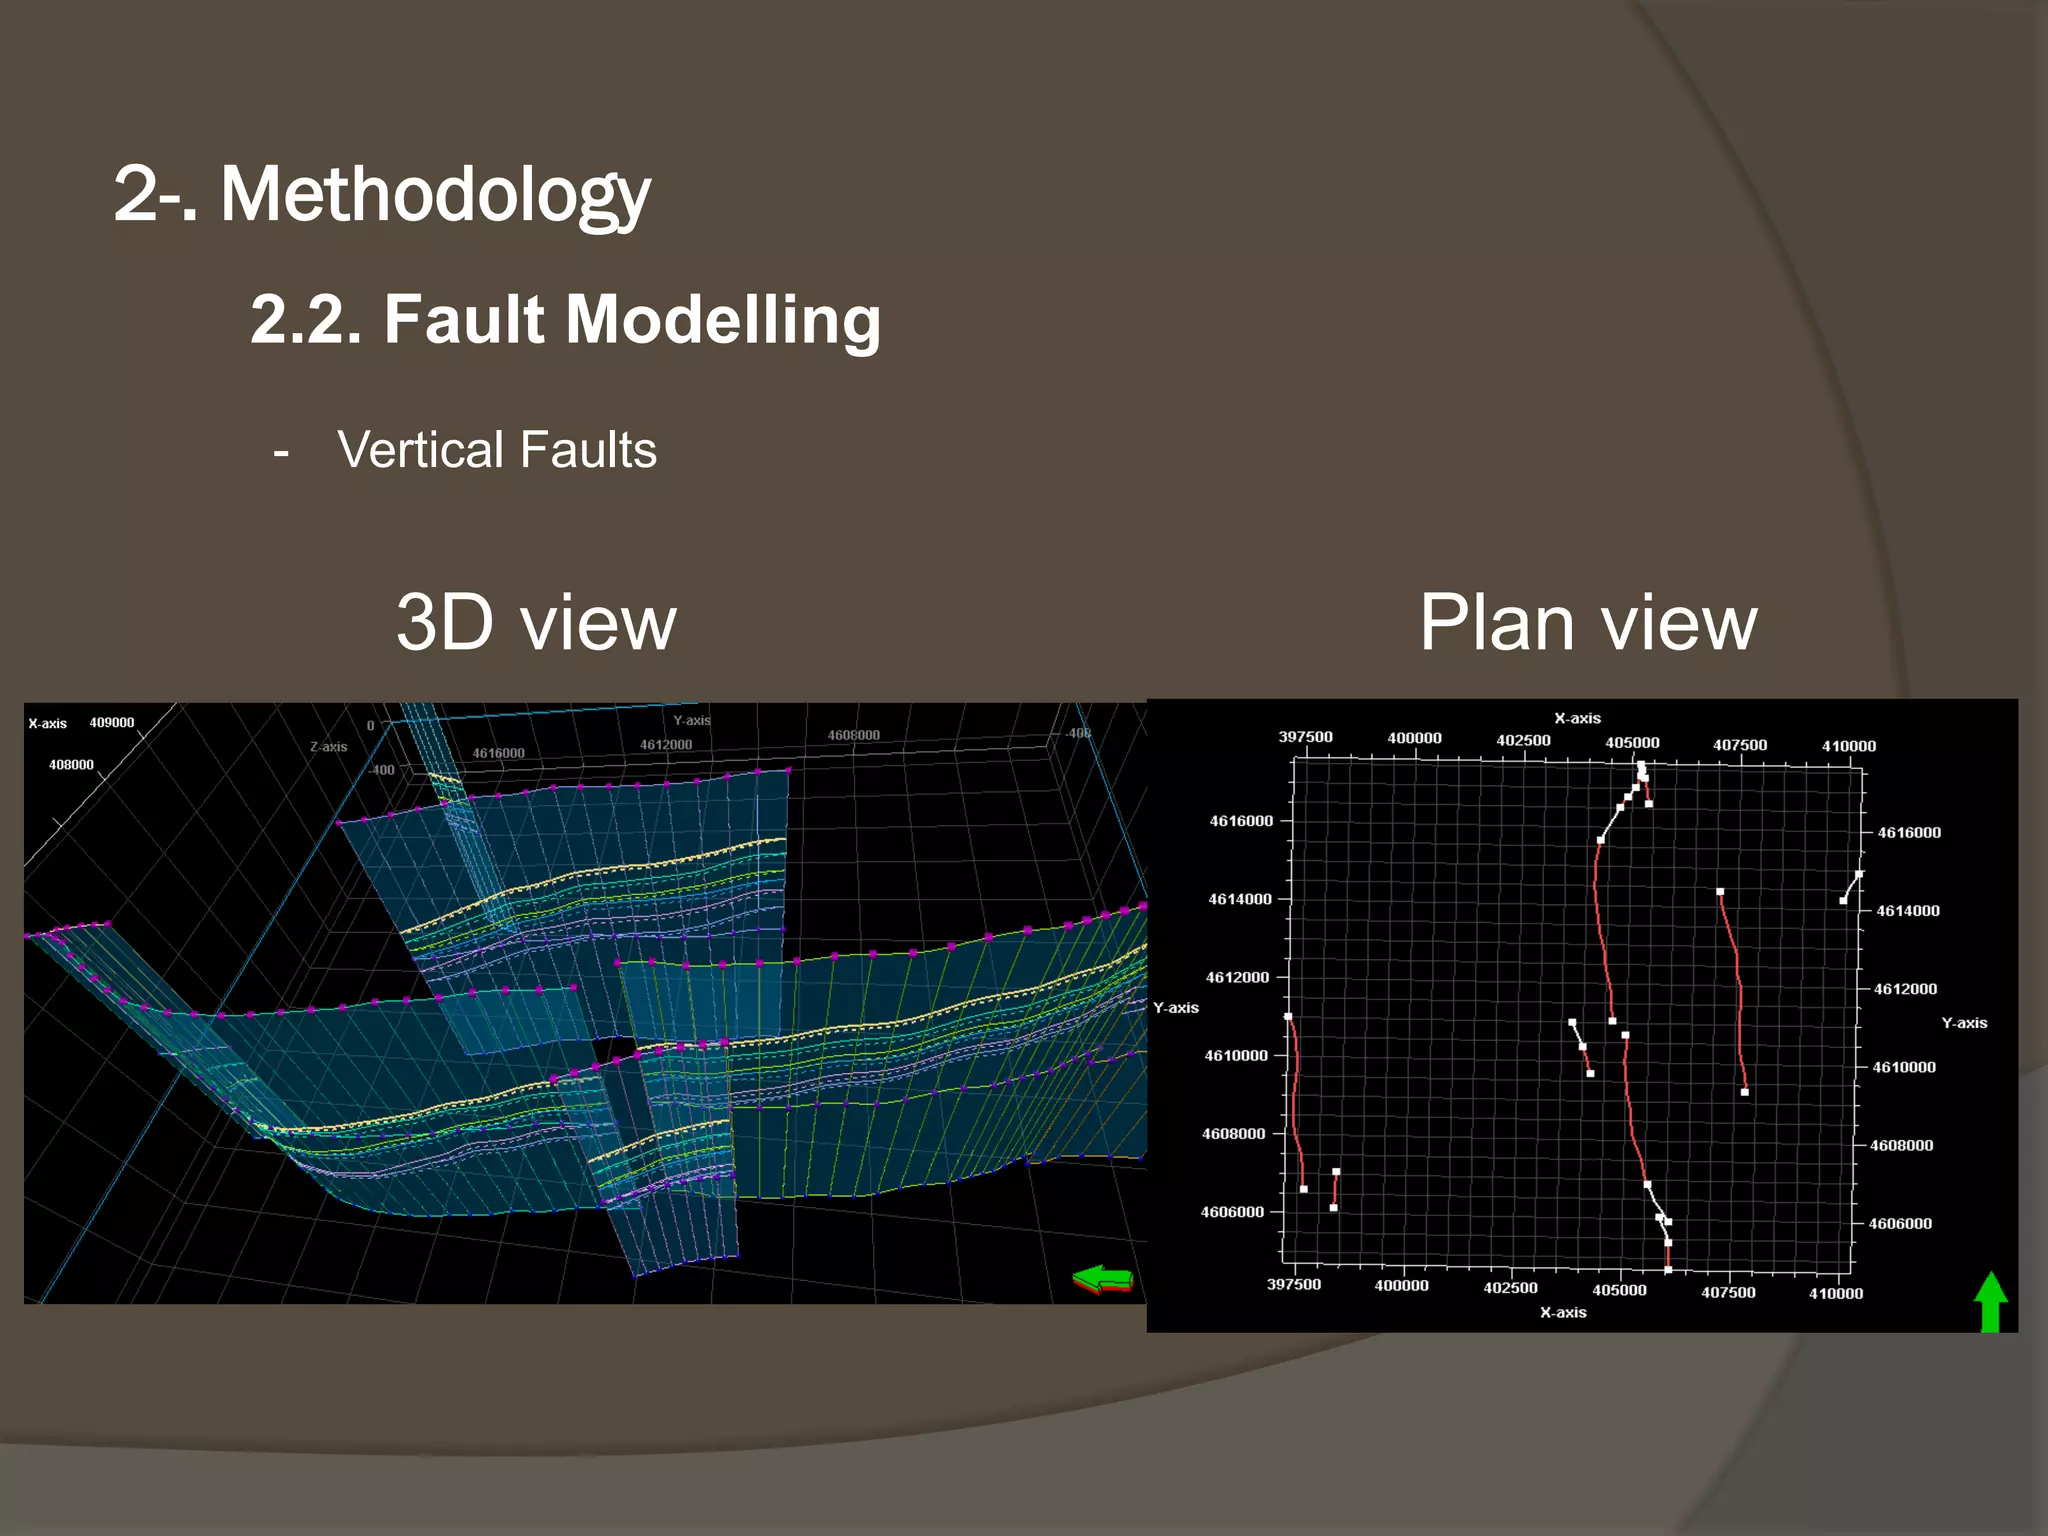
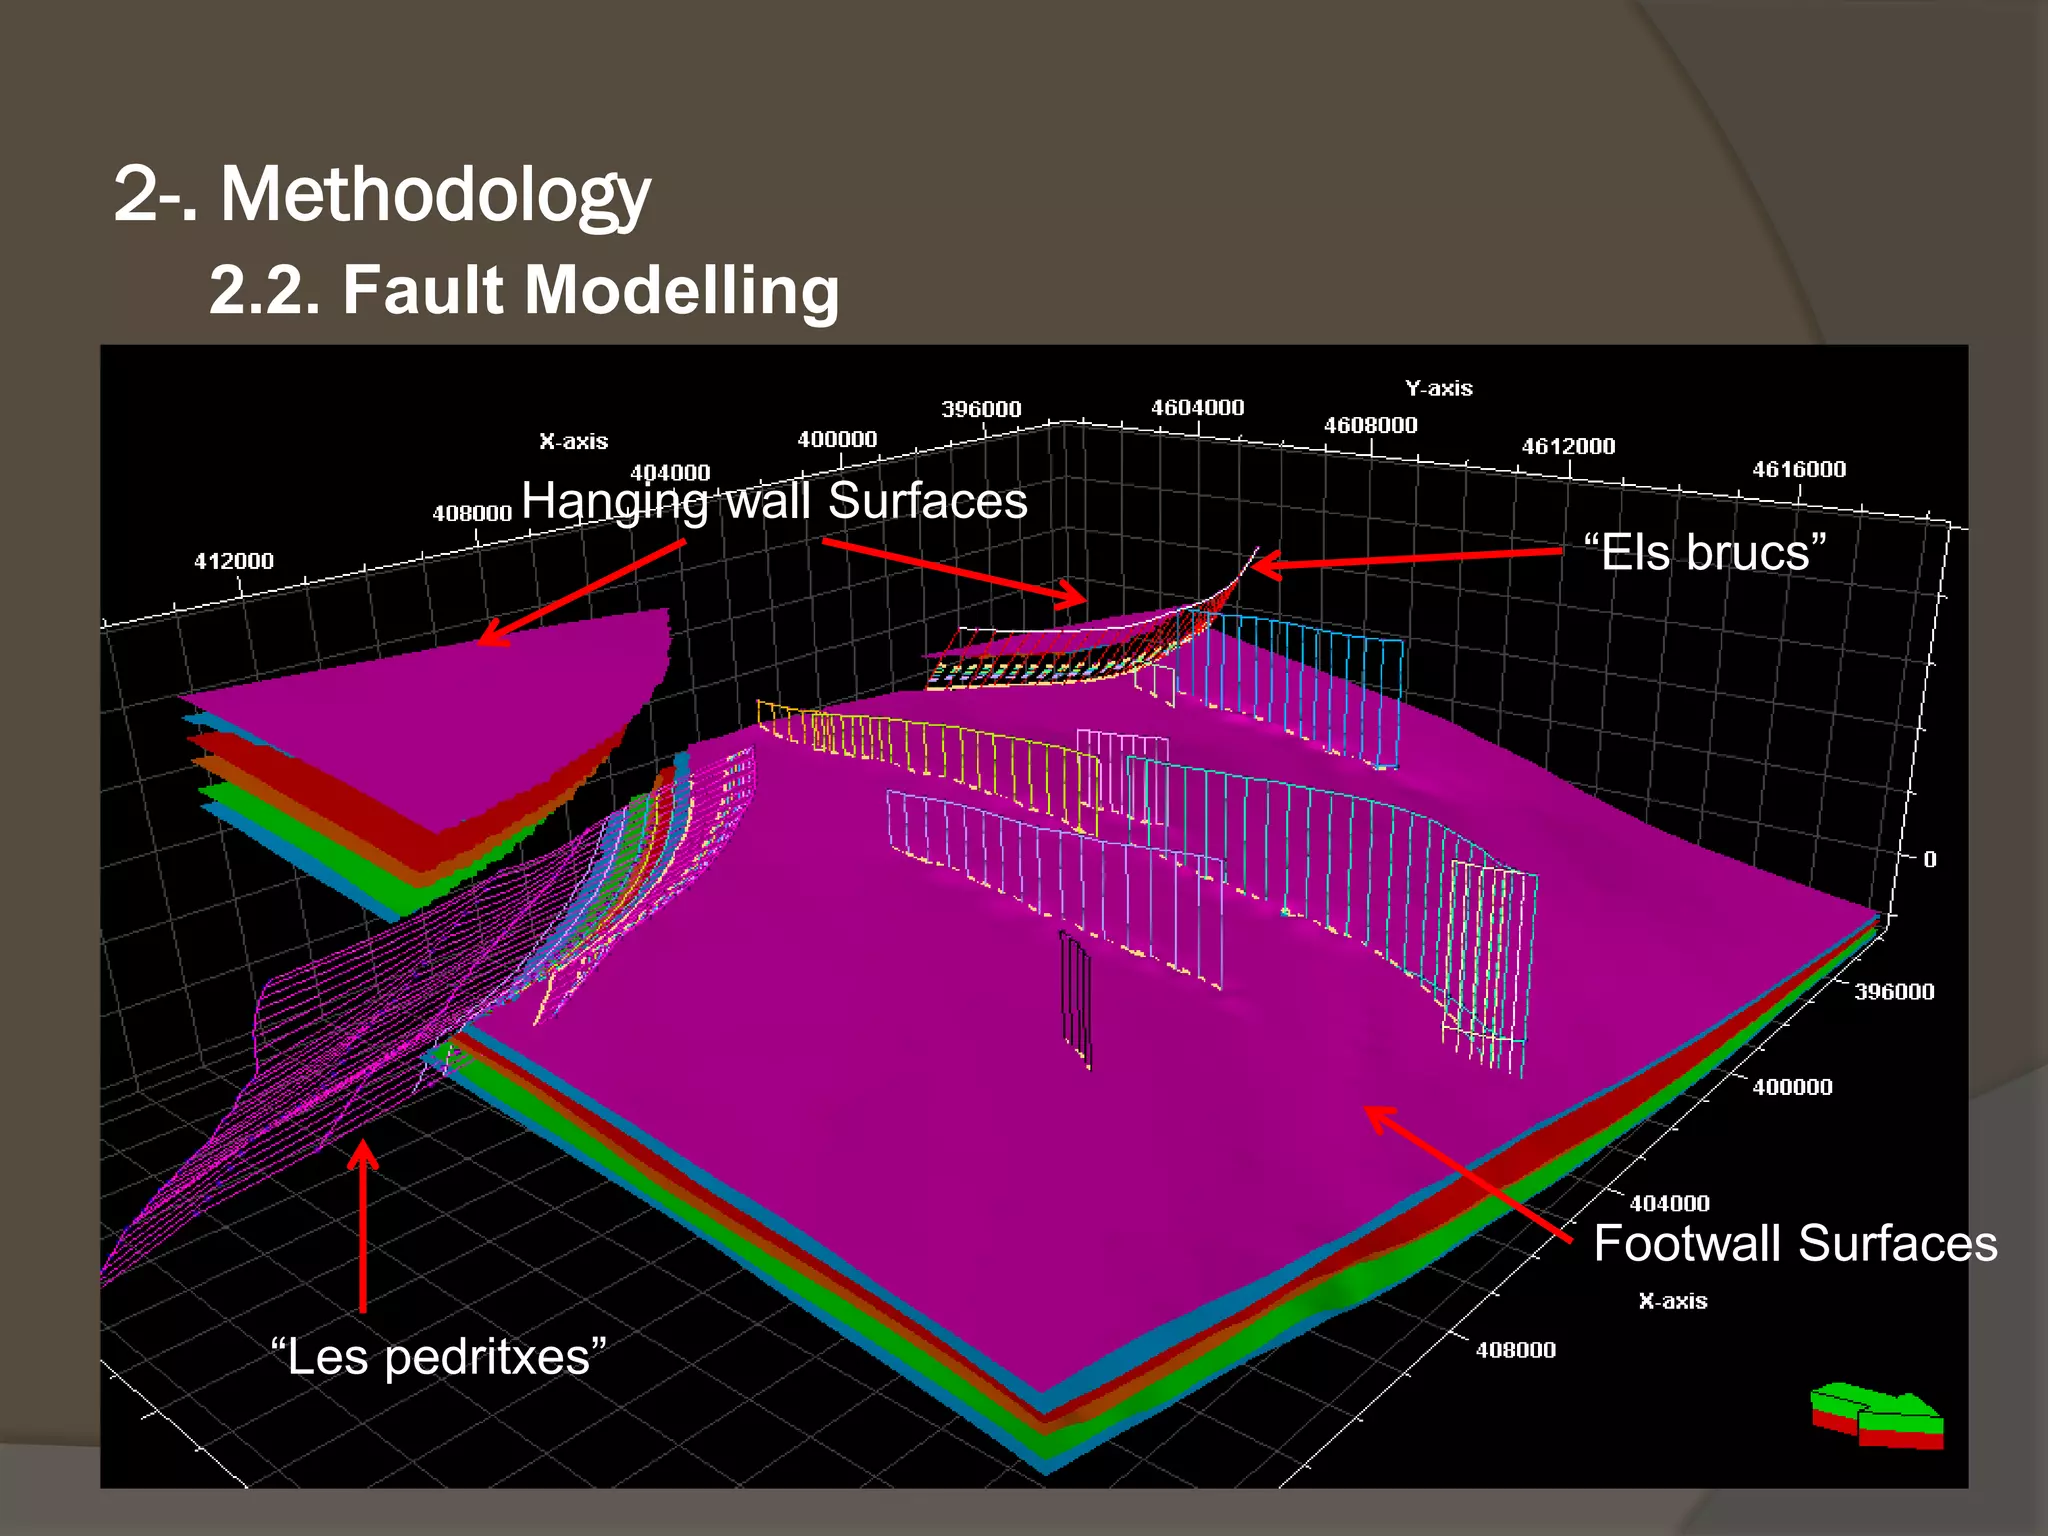
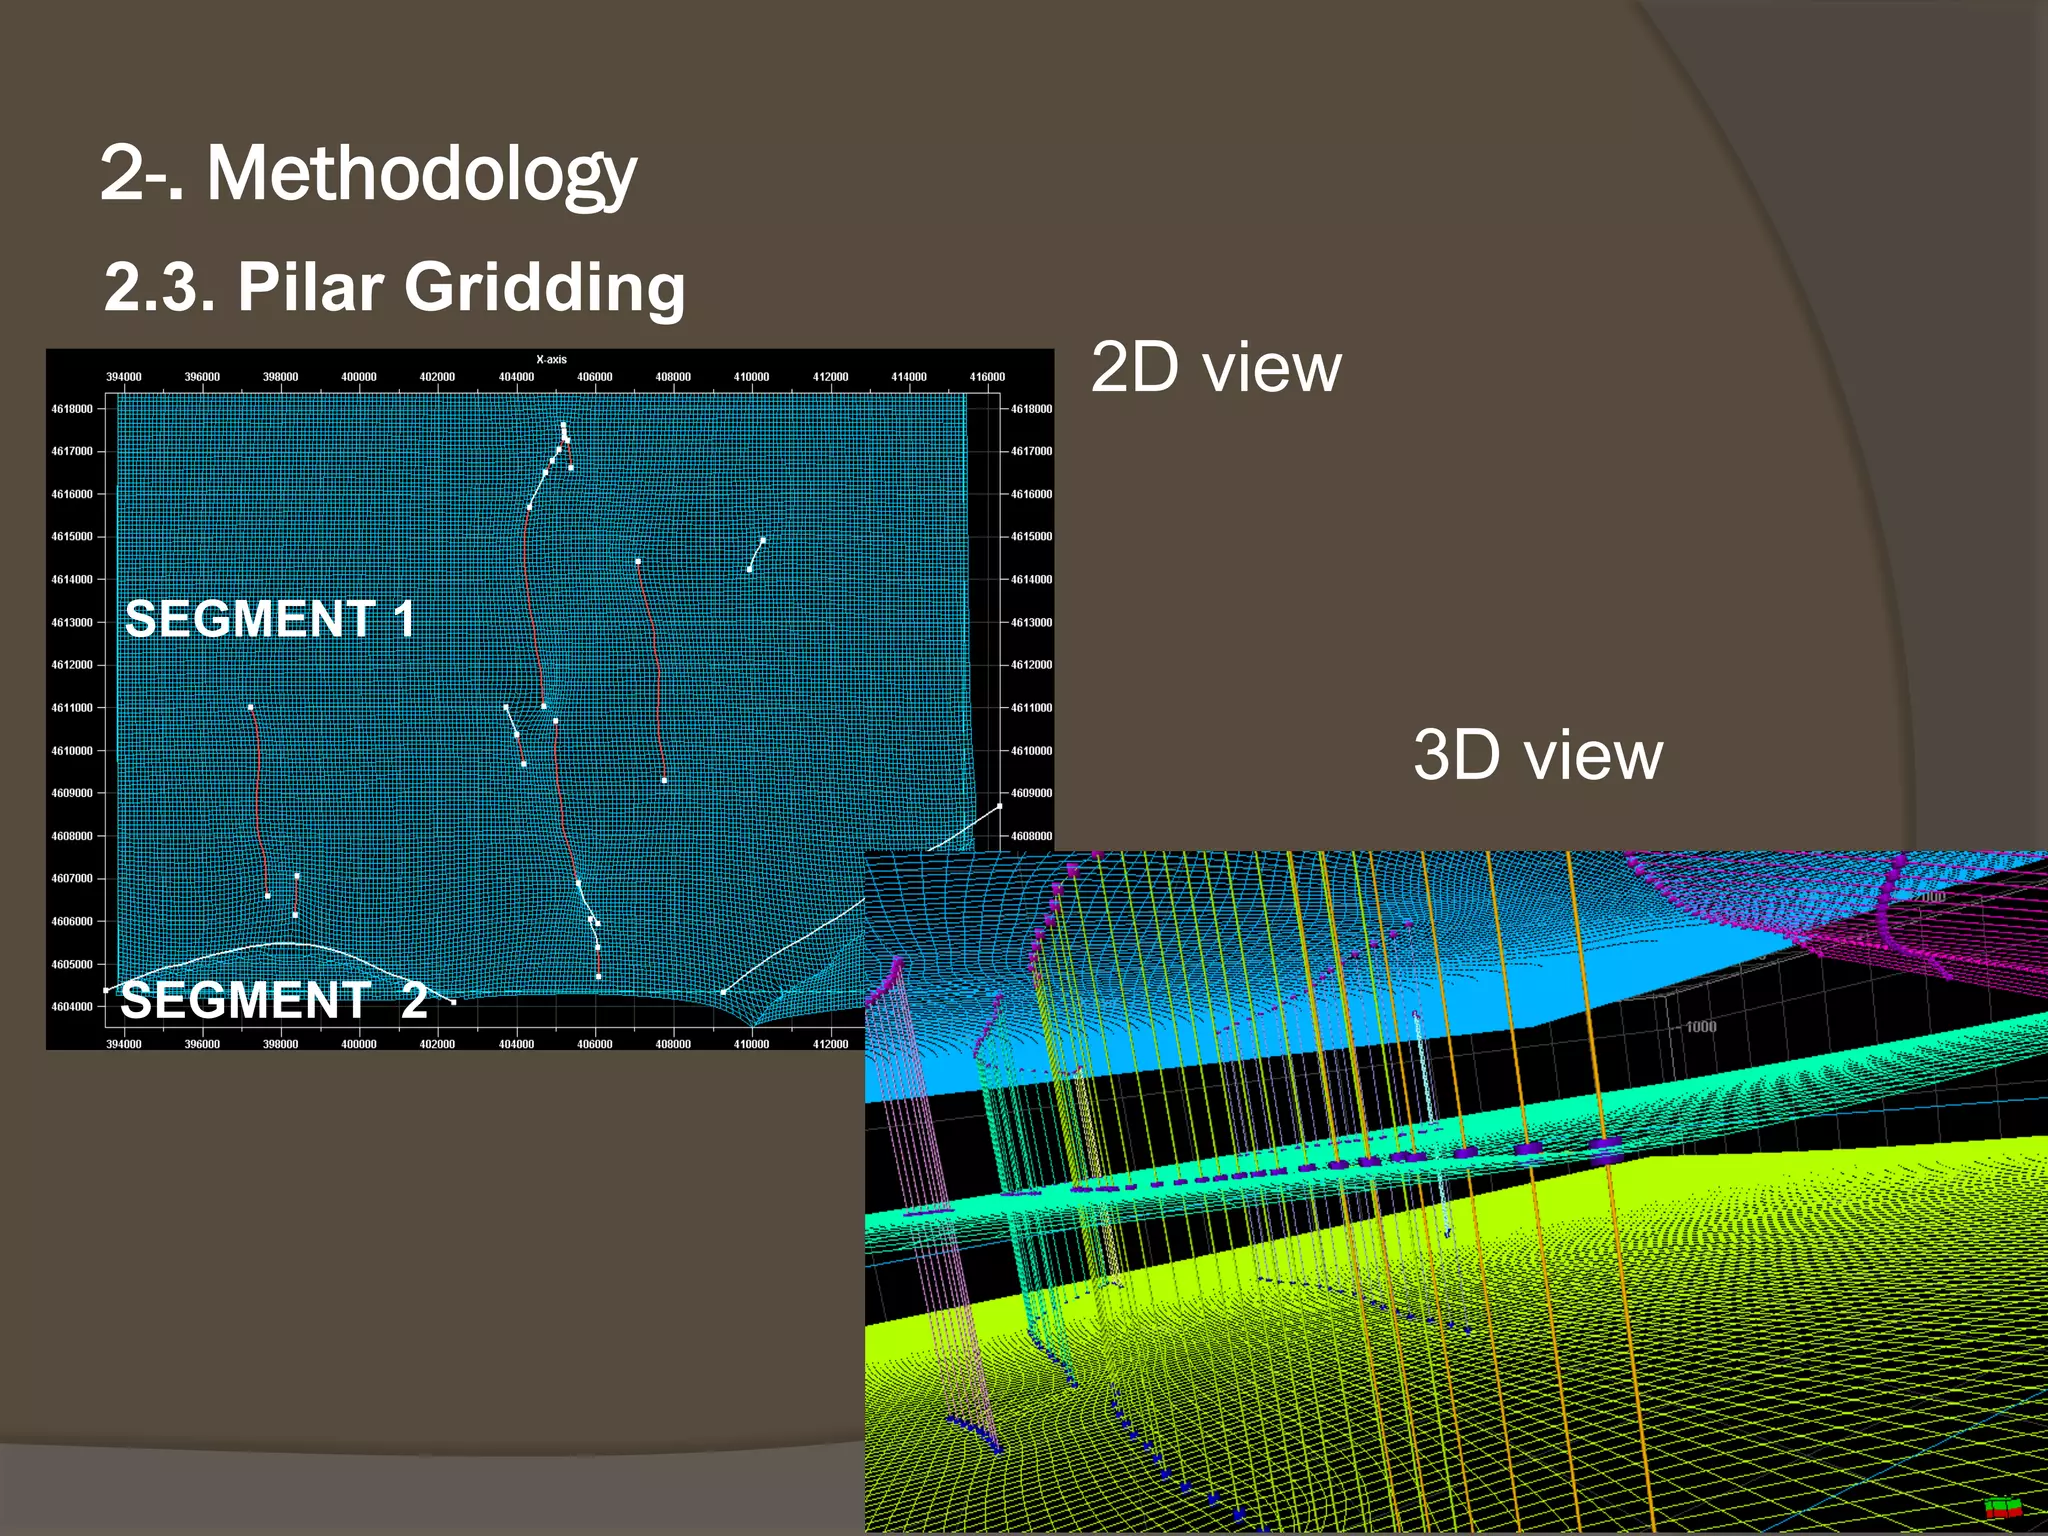
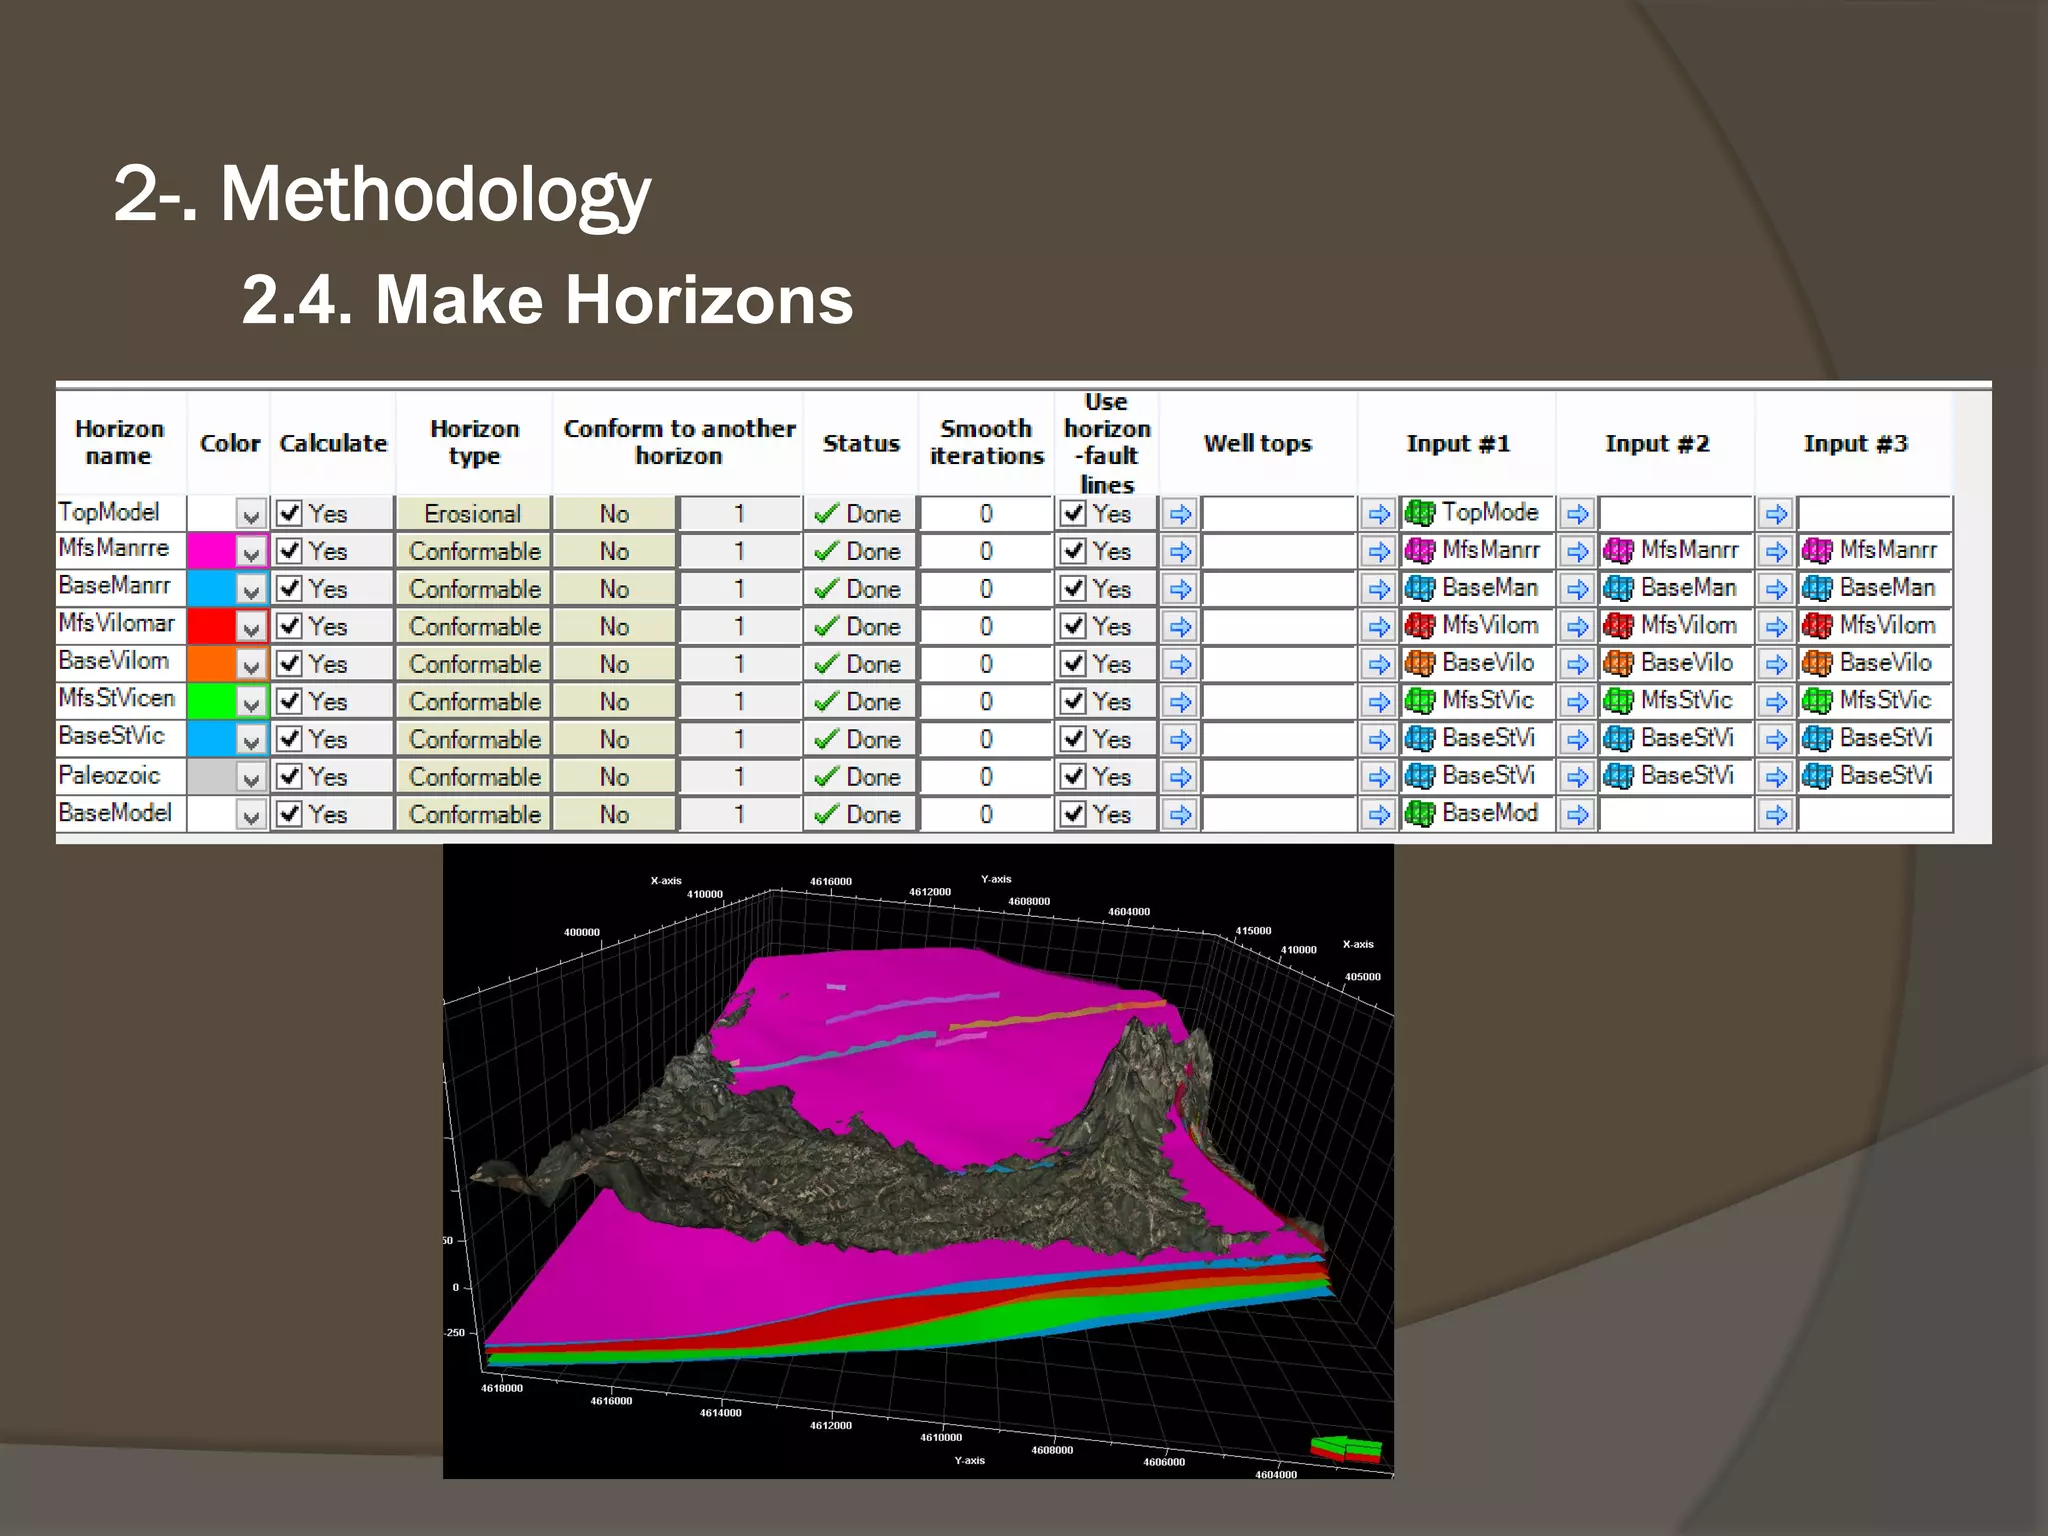
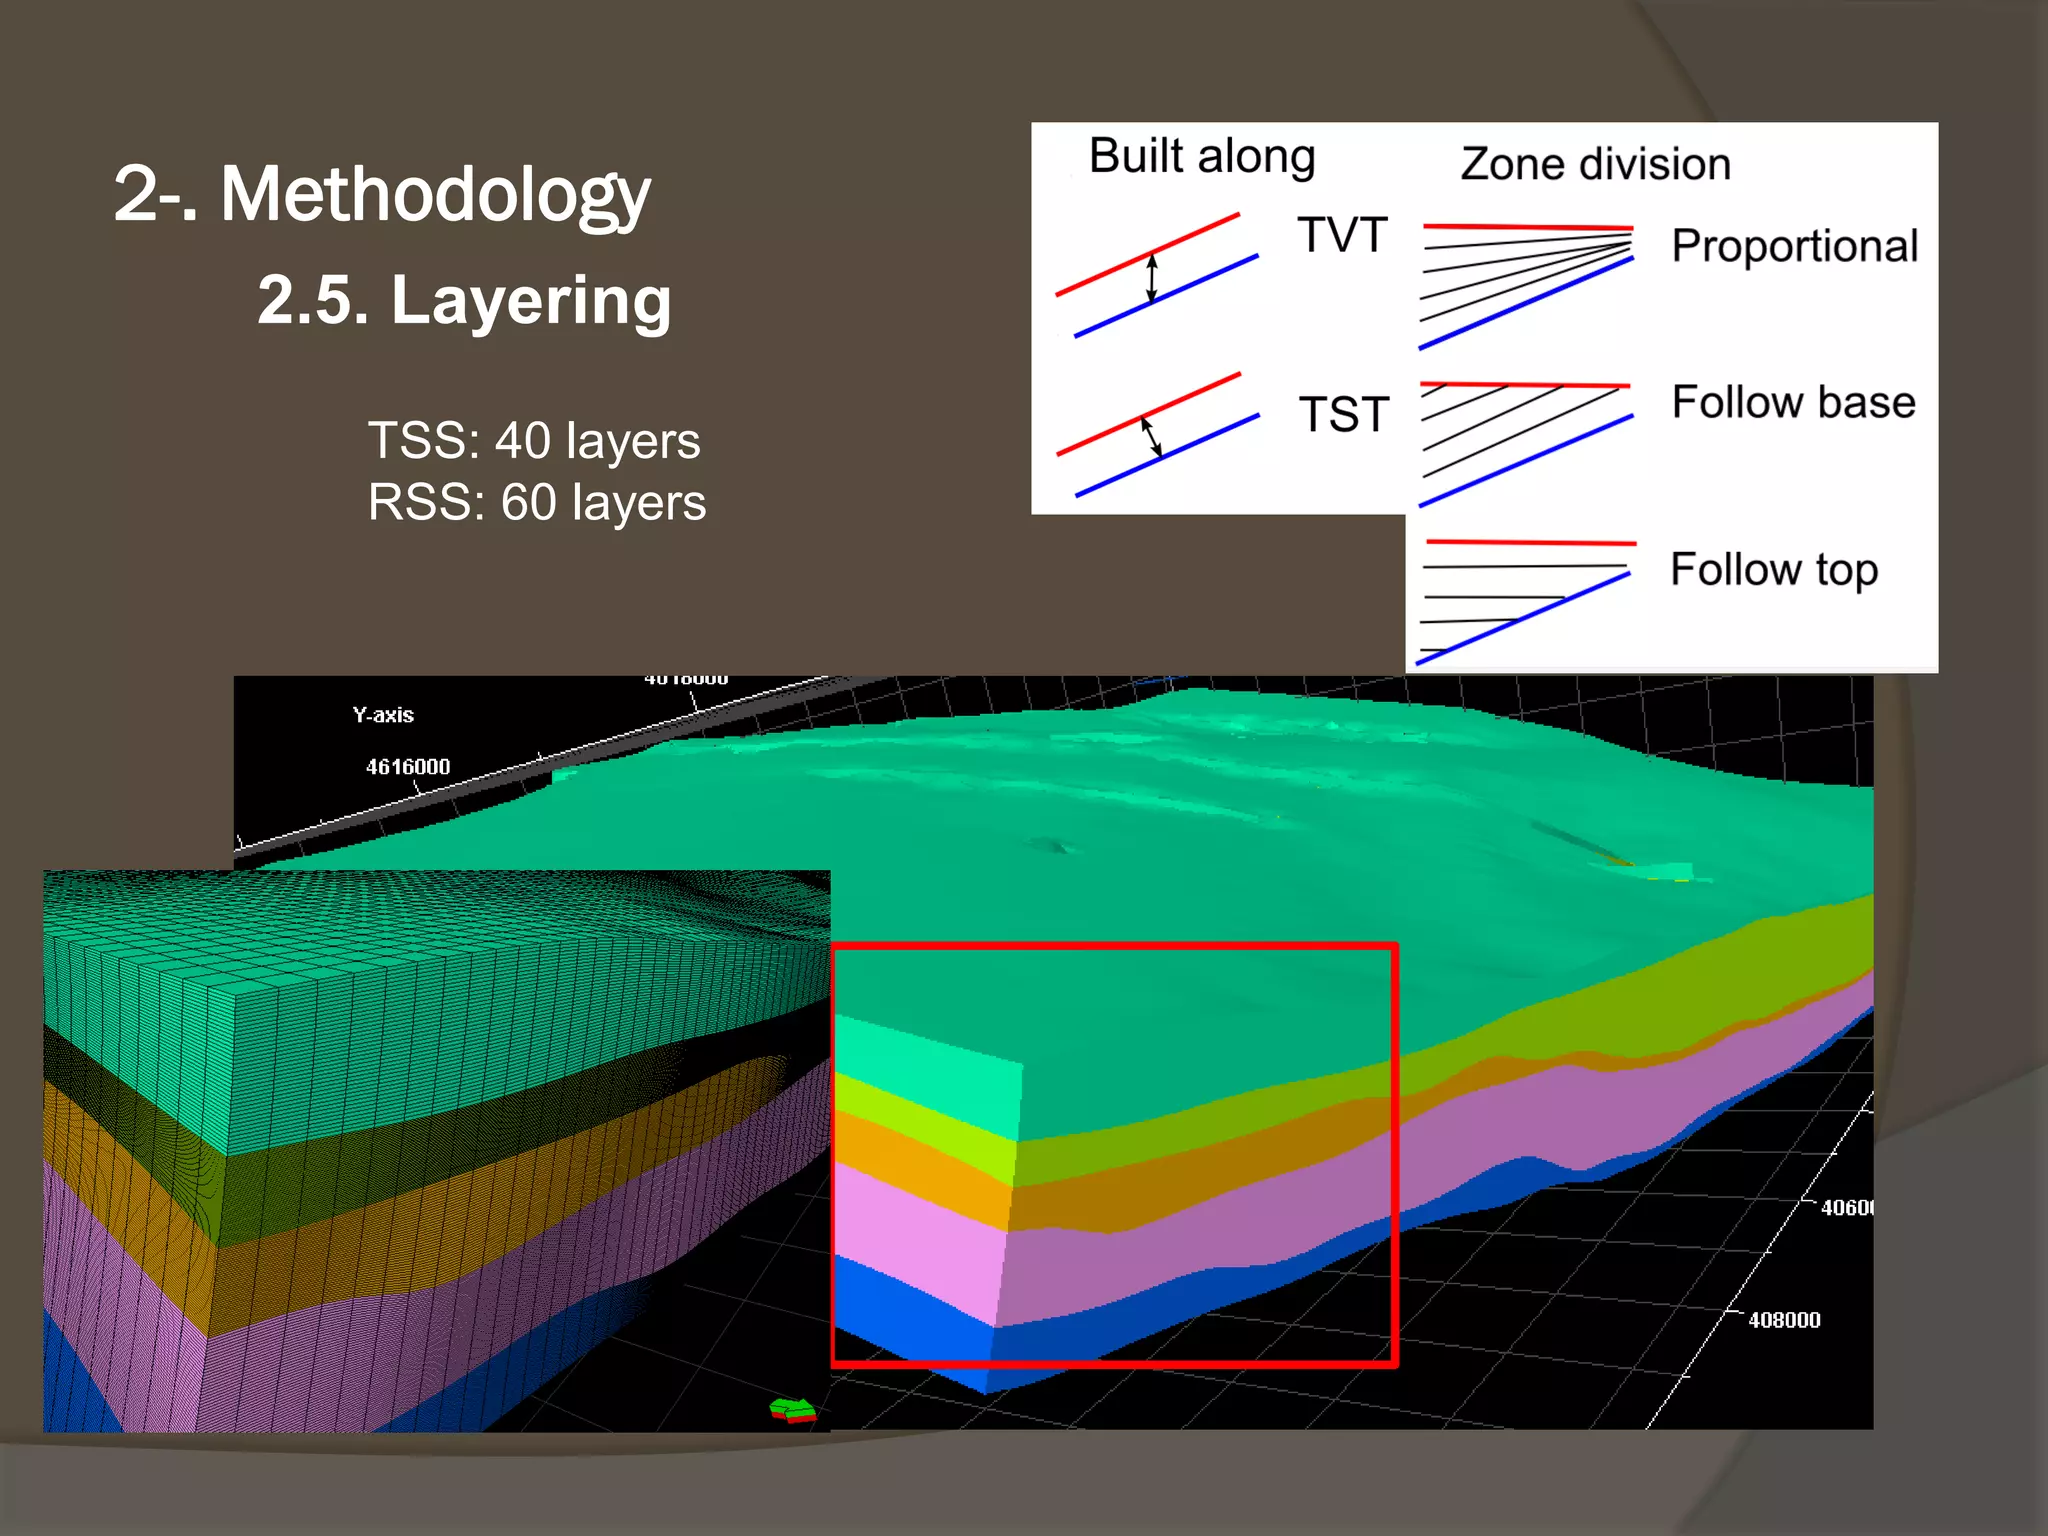
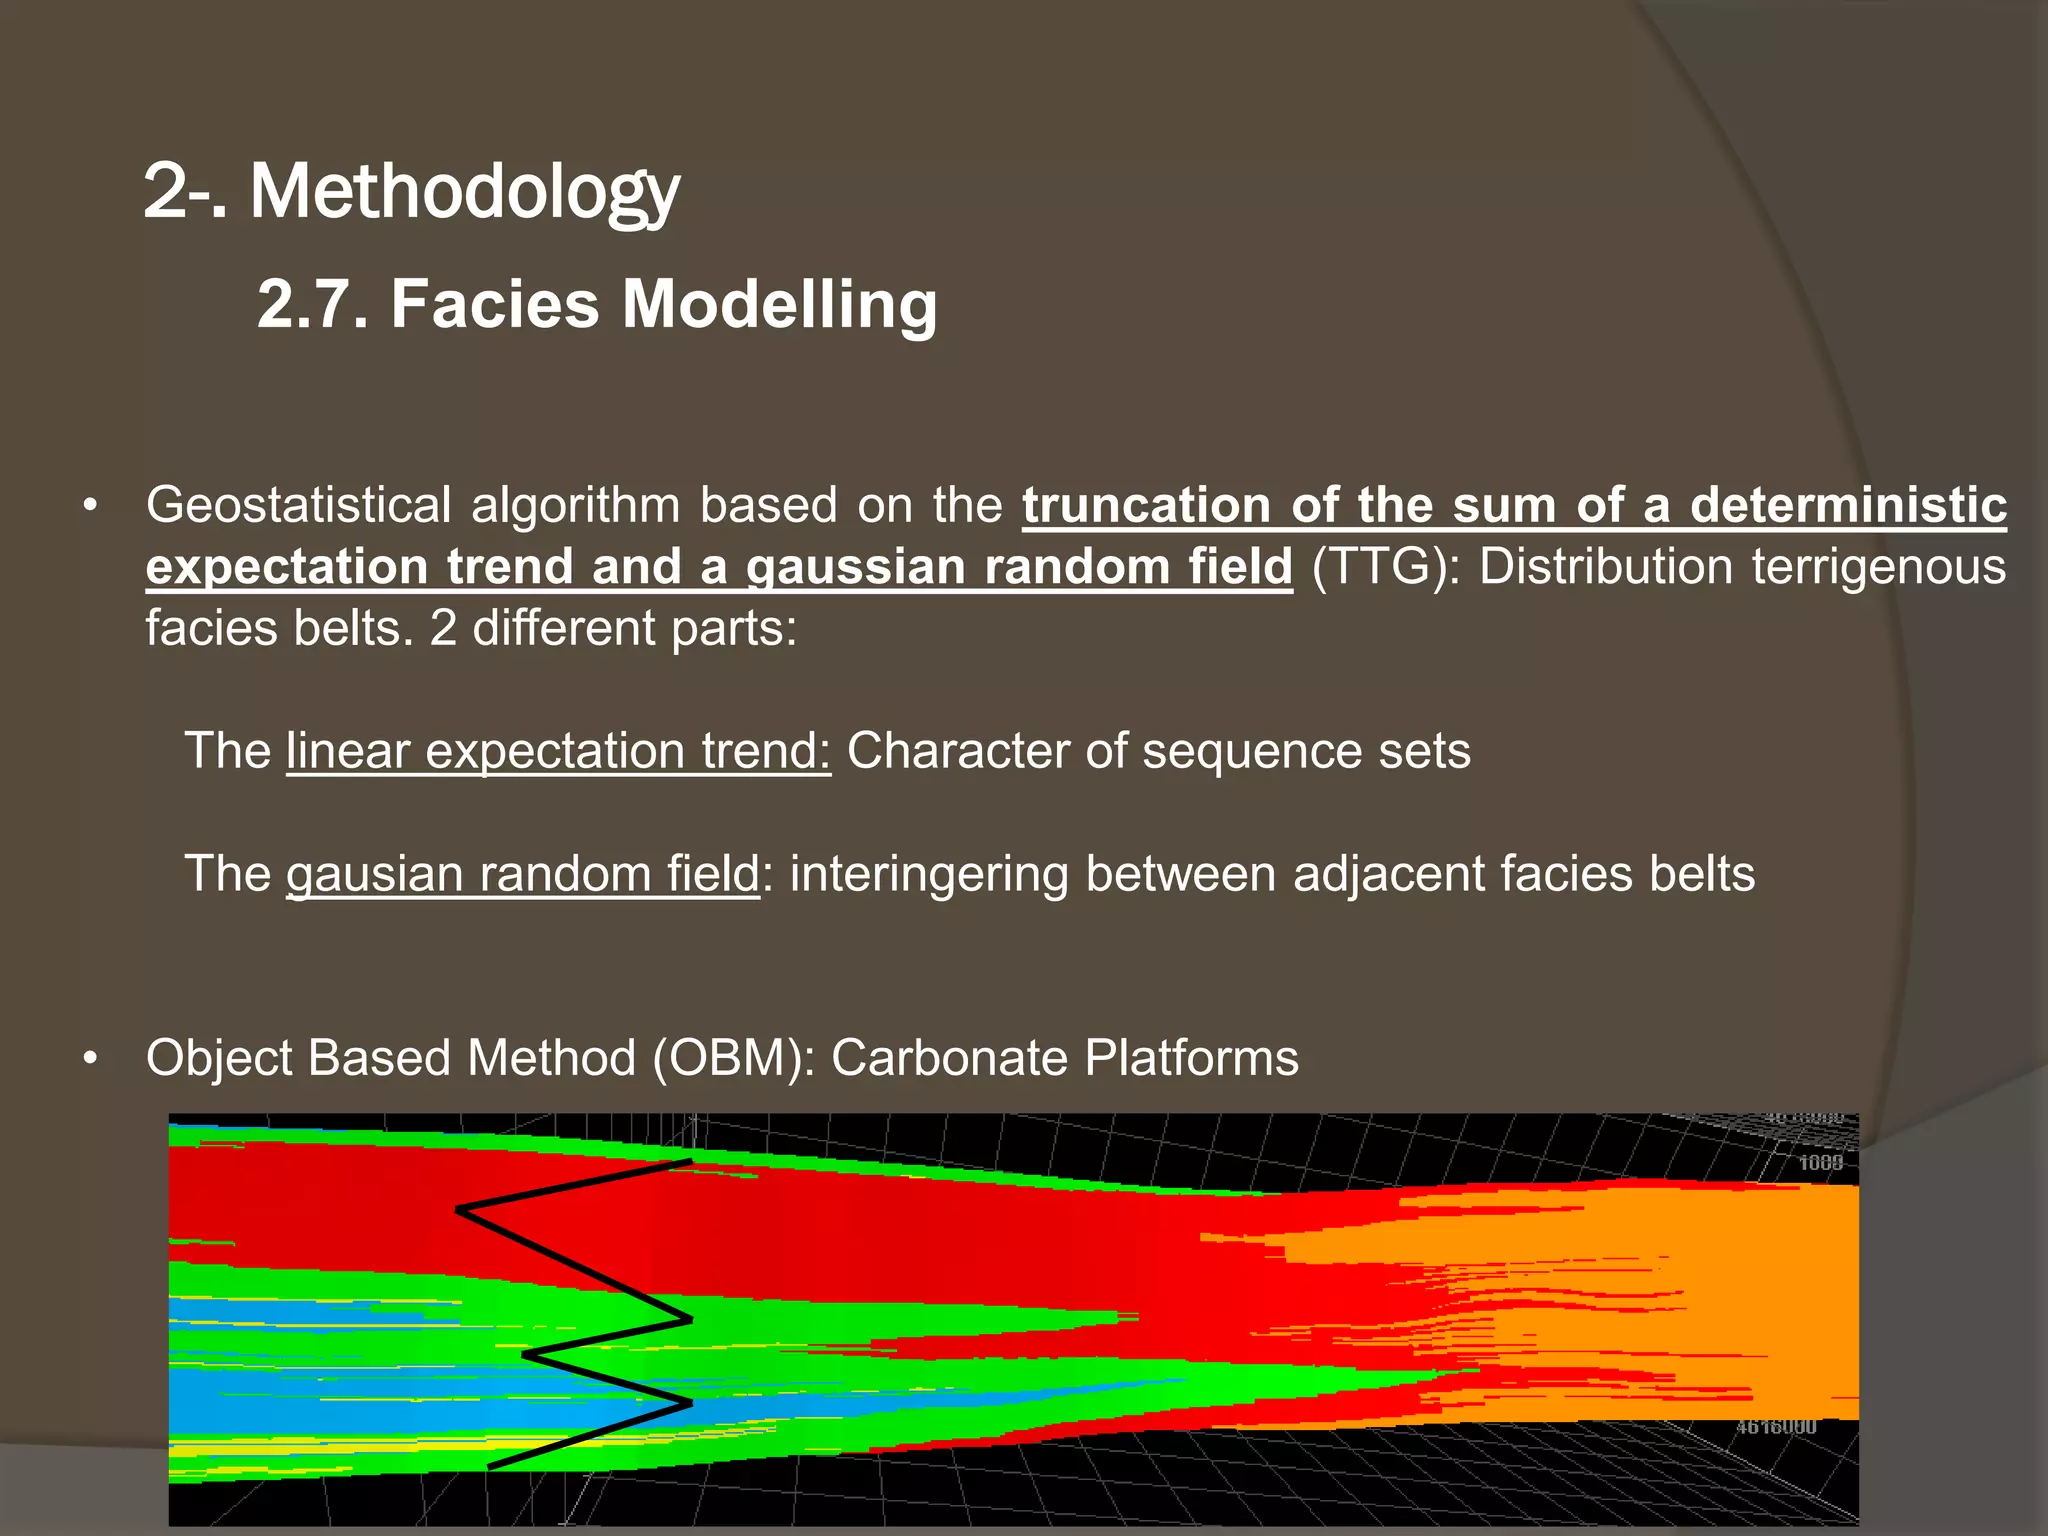
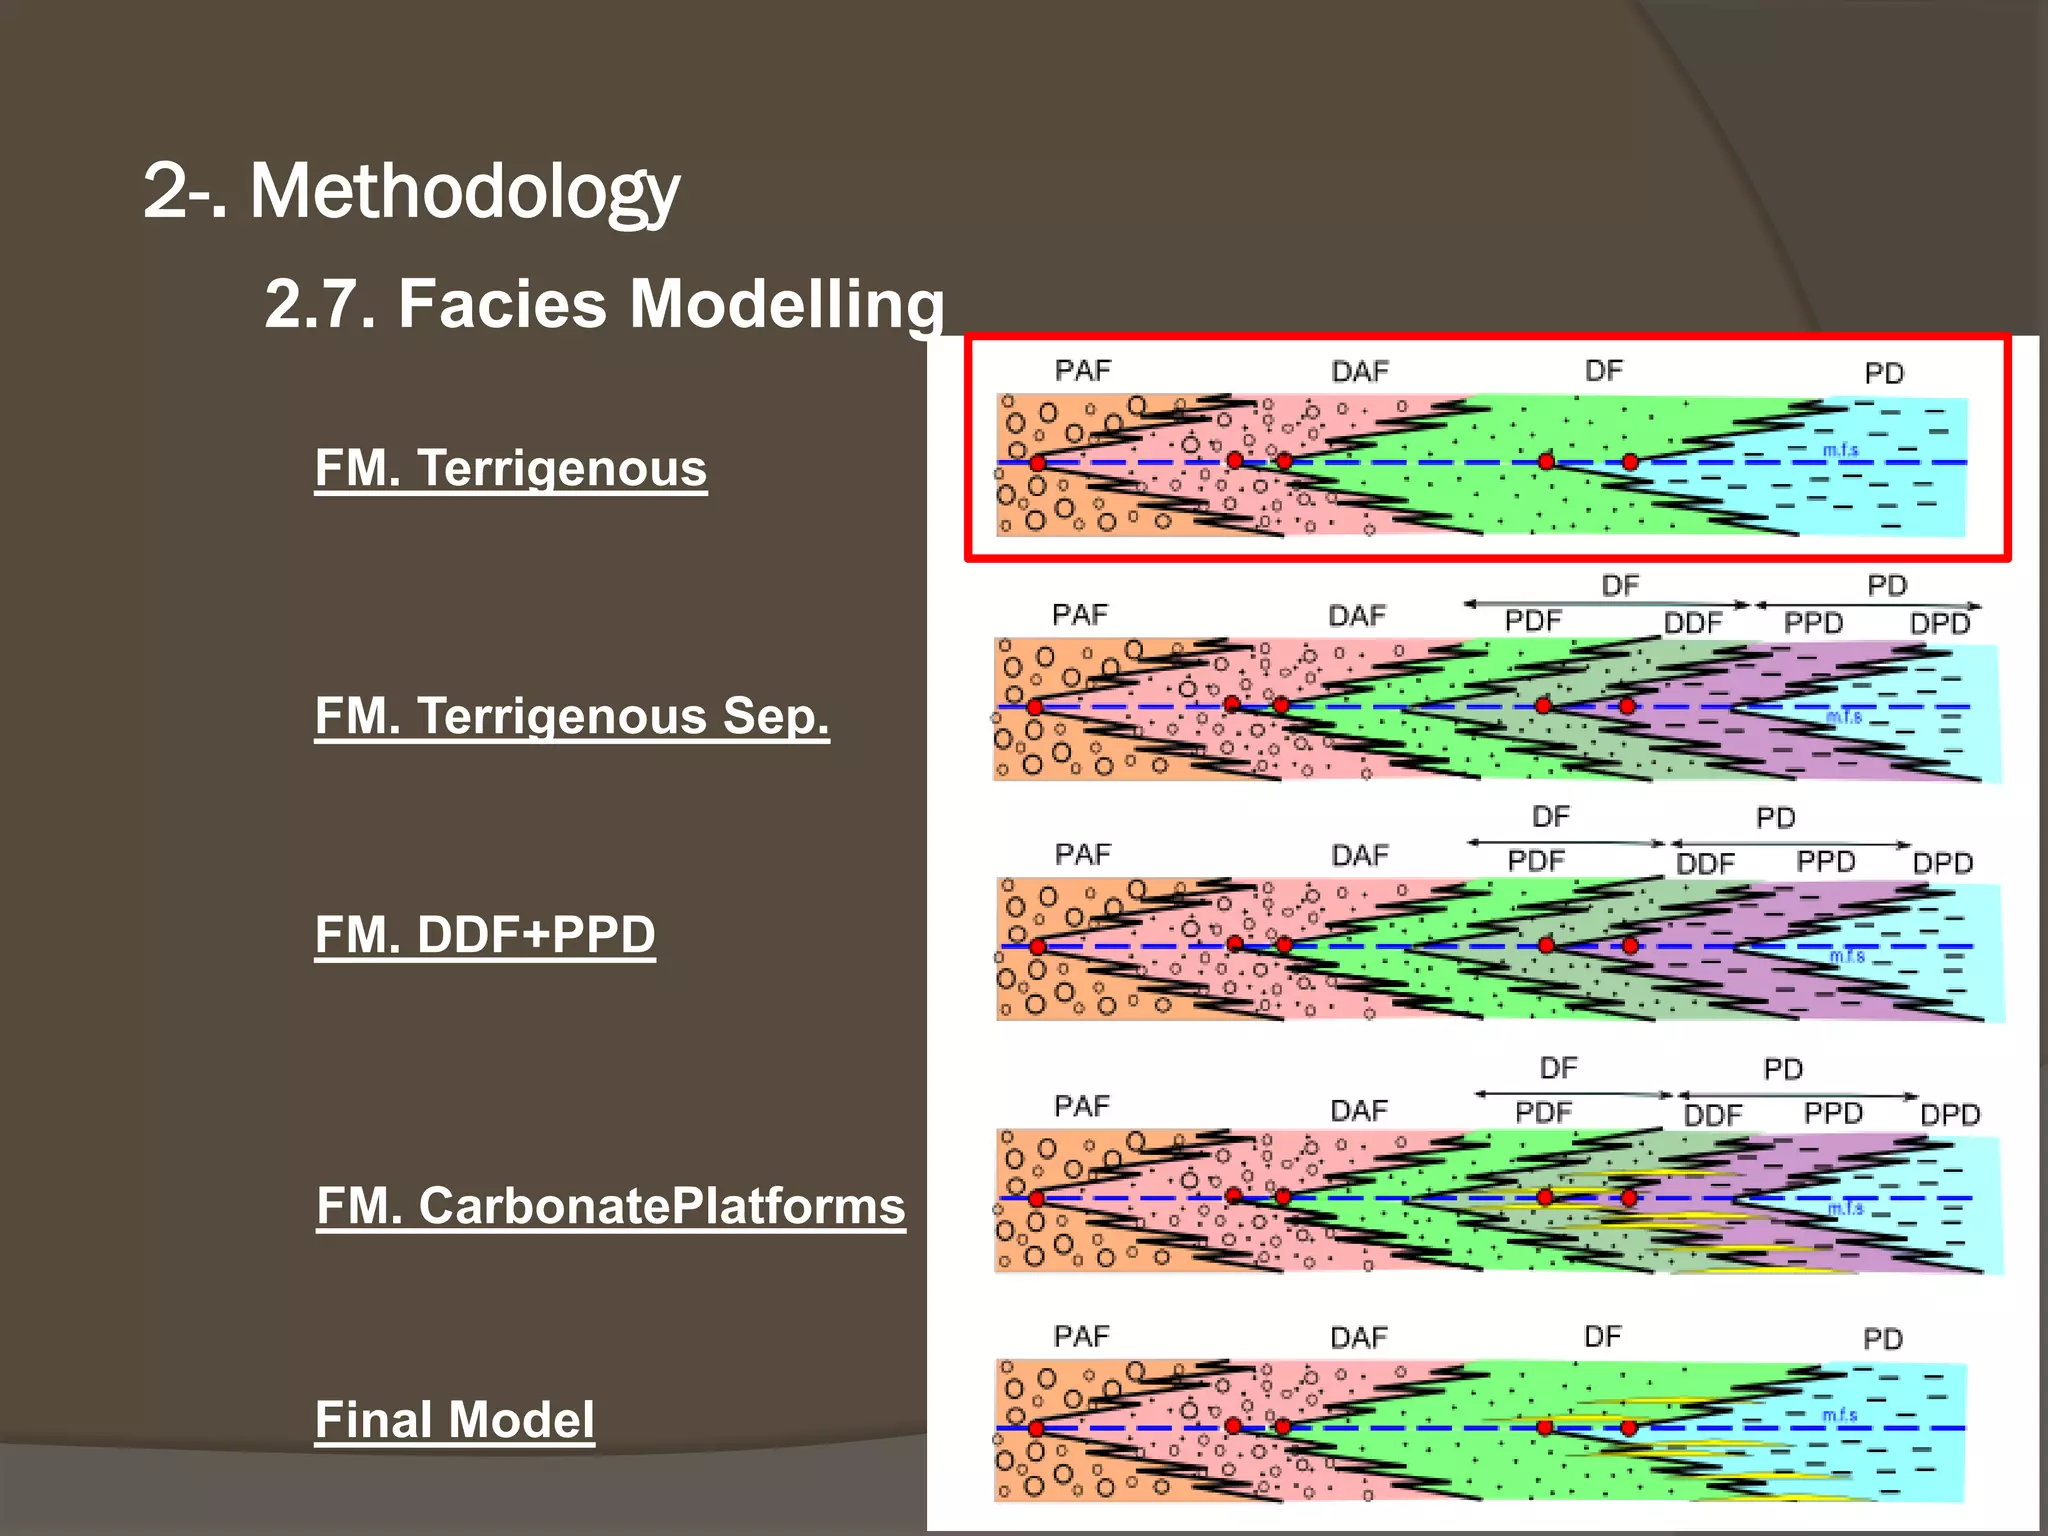
The document is a master's thesis by Marc Diviu Franco on 3D modeling of subsurface geology, focusing on a study area in the Ebro Basin, Spain. It outlines the methodology used in creating facies models, including stratigraphic framework development and fault modeling, while also discussing results and conclusions related to hydrocarbon reservoirs. The study emphasizes the importance of accurate geological modeling for resource management and highlights the application of various statistical methods in understanding geological formations.


![Well Log Interpretation and Petrophysical Analisis in [Autosaved]](https://cdn.slidesharecdn.com/ss_thumbnails/a24a638f-02ab-4332-9396-89ba2cdd02b4-161128031018-thumbnail.jpg?width=640&height=640&fit=bounds)


