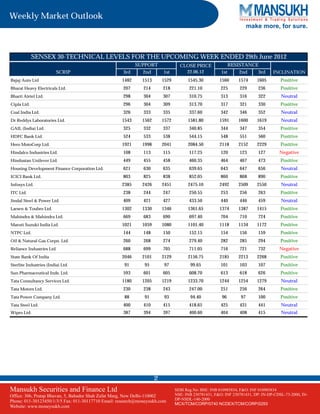
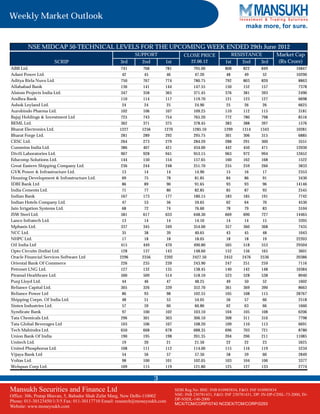
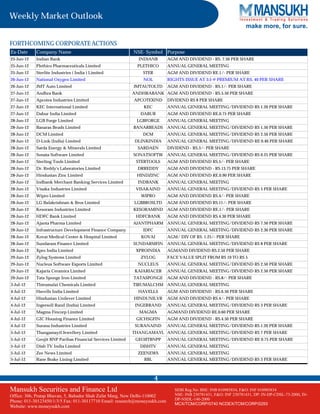
The weekly market outlook document provided a summary of market performance for the week ending June 22, 2012. Some key points:
- Indian stock markets ended the week flat after gaining over 6% in the previous two weeks. Frontline indices saw marginal gains but extended their gaining streak to three weeks.
- Sentiment was dampened after the RBI maintained interest rates, defying expectations of a cut. Inflation also rose slightly to 10.36% in May.
- Technical support and resistance levels were provided for 30 Sensex stocks and 50 Nifty Midcap stocks to gauge the market outlook and inclination for the upcoming week.
The key points from the document are:
1) In the past week, Indian markets gained over 2% despite consolidating in the last 3 sessions, buoyed by hopes that major central banks will enact stimulus measures.
2) The BSE Sensex surged 2.13% for the week while the Nifty gained 2.27%.
3) The RBI maintained its status quo on interest rates, dashing hopes of a stimulus, but markets recovered and moved higher later in the week on global optimism.
The Indian stock markets extended their gains for a sixth straight week as the benchmark indices rose over 1%. Foreign investors have poured $3.6 billion into Indian equities so far this year, outperforming many global markets. The markets gained on positive US jobs data but slipped on India's lower-than-expected GDP growth of 6.9% for fiscal year 2012. Hopes of further aid to Greece helped the markets recover. Key factors to watch this week include India's January inflation data and various major company earnings announcements. The outlook is for a range-bound market between 5,200-5,480 points.
The Indian stock markets continued their upward momentum in the past week, with the Sensex gaining 2.96% to close at 17,234 and the Nifty gaining 3.09% to close at 5,205. Key highlights of the week were the RBI's monetary policy decision to keep interest rates unchanged but cut CRR, and overall bullish sentiment continuing to drive the markets higher. In the coming week, investors will watch out for recommendations on sugar sector deregulation and quarterly earnings results from various companies.
The Indian stock markets surged last week, with the Sensex gaining over 6% and regaining levels of 17,800 and 5,350. Positive developments in Europe regarding a debt deal helped boost sentiment. For the coming week, auto sales, cement dispatch, and export data will be watched. Sugar stocks may see action as sugar export policy is expected. Company results including Maruti, ICICI Bank, and Wipro will also be in focus. Globally, US jobless claims data will be monitored. The markets may see further gains if Nifty breaks above resistance at 5,400-5,410.
The Indian stock market indices extended gains for the second straight week, rising over 2% as domestic economic indicators improved and concerns over the Eurozone debt crisis eased. The Sensex closed at 16,155 and the Nifty at 4,866. Monthly industrial growth was higher than expected at 5.9% in November. Weekly food inflation declined for the tenth straight week. In the coming week, markets will watch results announcements and global economic data for cues.
The Indian equity markets had a strong week, with the key indices gaining around 2-3%. The markets recovered losses from the previous week and broke past psychological resistance levels. Sector performance was mixed, with banking, capital goods and metals performing well while FMCG declined slightly. Looking ahead, the market is awaiting major corporate earnings results and economic data. The trading range for the coming week is expected to be between 4500-4860 points.
The weekly market outlook document provides the following information:
1) Indian stock markets declined for the second consecutive week, with the Sensex and Nifty falling 1.6% and 1.29% respectively, as bears took control of Dalal Street.
2) Volatility is expected to continue in the coming weeks due to upcoming state election results and the union budget.
3) The document provides technical analysis for 30 Sensex stocks and 50 Nifty midcap stocks, identifying support and resistance levels.
Indian stock markets gained for the seventh consecutive week, with the Sensex rising 3.04% and Nifty up 3.75%. Foreign institutional investors contributed to the rise by investing over Rs. 10,000 crore in Indian equities during the week. Several sectors such as auto, banks, capital goods and real estate saw gains over 6%. However, inflation declined to a 2-year low of 6.55% in January, giving the RBI scope to cut interest rates. Volatility is expected in the upcoming week due to F&O contract expiry and various economic data releases.
The Indian stock markets declined sharply last week as global cues turned bearish. The Sensex fell 4.04% to close at 20,157 while the Nifty dropped 3.80% to 6,072. Earnings disappointments from some major companies and weaker industrial production data weighed on investor sentiment. All sectoral indices ended lower, with realty and banking stocks witnessing heavy losses. Global concerns around European debt and expectations of monetary tightening in China also dragged down markets. The volatility index rose over 11% indicating increased uncertainty. The coming week may see further volatility as focus shifts to global developments and domestic inflation numbers.
The weekly market outlook document provides a snapshot of market performance for the week ending April 20th, 2012 and an outlook for the following week:
- Indian stock markets gained over 1.5% for the week, recovering slightly from losses the prior week, aided by the RBI's 50 basis point interest rate cut.
- The auto sector rallied the most, up nearly 6%, while oil & gas declined the most.
- In the coming week, markets will watch the April F&O contracts expiration on the 26th as well as Reliance Industries' earnings. Global economic data from the US will also be monitored.
- Technical indicators show some sectors like auto, metal and healthcare have positive
The document provides a weekly market outlook and summary for the period of October 17th-21st, 2011. It notes that the Indian markets finished the week down over 1.5% with benchmarks losing their holds over psychological levels. Sentiment remains weak due to lack of domestic triggers and discouraging global developments. Key points in the outlook are disappointing earnings reports, double digit weekly food inflation, an upcoming RBI policy announcement, and ranges for the Nifty in the coming week.
The Indian equity markets fell for the second consecutive day due to the RBI's surprise decision to raise interest rates by 50 basis points. The Sensex closed at 18,432, down 0.46% and the Nifty closed at 5,546, down 0.52%. In global markets, Wall Street fell 1-2% due to weak US economic data and debt ceiling talks. Domestically, several companies such as Dabur, GAIL and Lupin reported higher Q1 profits. The rupee closed at 44.06 vs the US dollar. Brent crude oil prices fell 0.69% while gold prices closed flat.
The Indian residential market continues to see substantial levels of new projects entering into the market, which is creating more ‘Investor friendly’ environment, with increase in choice of quality product. Consistent demand for prime residential properties is putting a upward pressure on rentals as well as capital values in almost all the micro markets. As the government is taking initiatives to boost long term demand, transaction volumes are likely to see revival in the coming festive seasons.
The Indian stock market closed lower for the third consecutive day with the BSE Sensex falling 51 points to 18,086 and the NSE Nifty shedding 18 points to close at 5,420. Midcap and smallcap stocks underperformed benchmarks. Global markets closed positive with US indexes rising between 0.65-1.14% on signals of low interest rates and a weaker dollar. Commodity prices were also up with Brent crude oil rising 2.18% and gold up 0.71%. On the corporate front, Bajaj Auto reported a 165% rise in Q4 net profit.
The Indian stock markets declined for the second consecutive week, with the Sensex and Nifty falling 3.2% and 3.1% respectively. Trading was volatile, with the indices falling on 4 of the 5 trading sessions. Weak industrial production data and concerns about the domestic and global economic outlook weighed on investor sentiment. Key factors to watch in the coming week include inflation data, various corporate earnings announcements, the trajectory of the rupee, and economic data from the US. Technical indicators suggest further downside for many scrips if support levels are breached.
The Indian stock markets declined over the past week. The Sensex fell 1.38% and the Nifty fell 1.89% due to concerns over a potential downgrade of India's credit rating and slowing economic growth. Several sectors declined over 3%, with the technology sector outperforming. Looking ahead, the markets may remain lackluster as investors await key economic data releases from India and the US. Support levels of 5130-5150 could trigger further declines in the Nifty if broken.
The document provides a weekly market review for the period ending September 17, 2010. Key points include:
- Indian markets hit 32-month highs and ended the week up over 4%, led by banking stocks which rose nearly 6%.
- The RBI raised interest rates in its mid-quarter policy review to control inflation, hiking repo rates 25 bps to 6% and reverse repo 50 bps to 5%.
- Banking stocks are expected to outperform over the next two years due to strong credit growth. Large private banks are favored due to their competitive positioning in a rising rate environment.
The Indian equity indices ended almost unchanged on July 29, 2011, taking a breather after three straight days of losses. Key sectors like realty, metals and oil & gas saw declines while FMCG, banking and telecom performed positively. Globally, US stocks declined on concerns over political gridlock in resolving debt ceiling issues. In corporate news, Hindustan Unilever received approval to demerge its exports business while TVS Motor and City Union Bank reported profit increases. The rupee closed flat against the US dollar.
The Indian stock markets closed lower on June 16th, with the Sensex down 0.81% and the Nifty down 0.92%, pressured by weakness in global markets and an interest rate hike by the RBI. U.S. stocks rebounded after jobless claims and housing starts data eased economic slowdown concerns. Asian markets were negative with the Nikkei down 1.7% as inflation in India rose. The RBI raised its repo rate by 25 basis points to 7.5% to contain inflation.
Special report by epic research of 14 november 2017Epic Research
Epic Research prepares a special report on a daily basis which provides share market overview to the investors in brief. We aim to serve you best in class financial services at affordable prices.
The key points from the document are:
1) Indian markets ended lower on Monday due to weakness in auto and IT stocks and concerns over debt issues in the US and Europe. The Sensex closed down 0.3% and the Nifty fell 0.25%.
2) Global markets also fell as concerns over solving debt crises in Europe and the US continued. The Dow fell 0.76% and the S&P 500 dropped 0.81%.
3) Brent crude oil declined 0.91% to $116.1 per barrel while gold rose 1.83% and silver increased 6.81% on the day.
The document provides an overview of the Indian and global stock markets, commodity prices, and corporate news from January 21, 2011. Some key points:
- The Indian equity markets ended the week with modest losses as selling in IT, FMCG and telecom stocks was offset by gains in oil & gas and banking. Mid and small cap stocks performed better than frontline stocks.
- Global markets were mixed, with the Dow and S&P 500 up slightly while the Nasdaq fell. Asian markets opened higher the next day.
- Commodity prices were also mixed, with crude oil up slightly while gold and silver fell.
- Several Indian companies reported higher quarterly profits, while others announced
The document provides a weekly market update covering the performance of key stock indices globally and in India. It notes that the Indian stock market declined over 1% for the week as the Sensex fell due to a rating downgrade of SBI and contraction in manufacturing and services PMIs. Macro data on exports, imports and growth forecasts are also mentioned. The outlook section discusses upcoming earnings and economic data releases in India and monetary policies in major countries.
The Indian stock markets ended the last trading session of 2010 on a positive note, with the BSE Sensex closing at 20,509 points, up 0.59% and the NSE Nifty ending at 6,135 points, up 0.54%. Several sectoral indices also closed higher, including the BSE Realty index (+2.4%), BSE Banking index (+1.4%), and BSE Auto index (+1%). Broader indices like the BSE Midcap and Smallcap also saw gains of over 1%. Globally, US markets closed mixed with the Dow up 0.08% while Nasdaq fell 0.41% and S&P 500 closed flat. Several Indian companies also reported
The Indian stock markets extended gains for the second consecutive day led by heavyweights like Reliance Industries and Infosys. The BSE Sensex closed at 18,496, up 0.41% while the Nifty ended at 5,557, up 0.45%. In global markets, US stocks fell for the fifth straight day on concerns over the economic recovery. Asian markets also fell with the Nikkei down 0.3% and Hang Seng down 0.66%. Key sectors like realty and oil & gas performed well in India, gaining over 1% each.
The document is a market report that provides key information on futures and options contracts for various indices and stocks that are set to expire on October 25th, 2012. It includes details such as the current open interest, changes in open interest from the previous day, current support and resistance levels, and closing prices from the previous day for each underlying asset. The report contains this information to help investors and traders make informed decisions about these derivative contracts.
The document is a market report that provides key data on futures and options contracts for various Indian indices and stocks, including changes in open interest and closing prices. It shows that over the past day:
- The Nifty index futures contract saw a rise in open interest of 2.44% and a decrease in closing price of 0.29%.
- Open interest in Bank Nifty futures increased 4.56% while the closing price rose 0.11%.
- Several stock futures contracts saw increases in open interest over 1%, while closing prices for many stocks decreased between 1-2%.
The document is a market report that provides key information on futures and options contracts expiring on May 31, 2012. It includes details such as the underlying asset, open interest, changes in open interest, and current price levels. Specifically, it summarizes data for index futures, stock futures, and individual stocks across various industries.
The document provides a market review for the week ended February 15, 2013. It summarizes performance of global equity markets, bond yields, commodity prices, and currency exchange rates. It also reviews economic data and monetary policies in various regions including Asia, Europe, Americas, and India. Key highlights from the Indian market include a marginal decline in equity indices, mixed economic data, easing bond yields, and a weaker rupee.
- The US Federal Reserve decided to keep interest rates near zero due to concerns about the global economy and low inflation. However, a rate hike of up to 25 basis points is still expected within the next six months.
- In India, there is a chance the RBI will cut rates by 25 basis points on September 29th. However, rate cuts alone may not make much difference without economic reforms.
- Indian steel sector faces problems like low demand, cheap Chinese imports, and excess capacity, while public sector banks would benefit if the steel sector recovers and pays back loans.
The Union Budget for 2012-13 focused on fiscal consolidation through tax measures and limiting subsidies while also emphasizing infrastructure development and inclusive growth. Key points include GDP growth projected at 6.9% for FY12 and 7.35-7.85% for FY13, increased spending on agriculture, education, and healthcare, and measures to attract investment into capital markets and infrastructure sectors. However, the lack of major reforms disappointed markets, which declined on the day of the budget.
The document provides an economic and market update for August 2012, analyzing factors such as global economic conditions, domestic economic growth and inflation trends, performance of key equity and debt markets, and providing an outlook on various sectors and the overall market. It notes recent monetary policy actions by central banks and analyzes their likely impact, while also offering recommendations to investors on portfolio rebalancing and positioning across different asset classes.
Indian markets ended with gain on Friday, for this week Sensex and Nifty were red
slipping marginally by 0.4% each. Major sectors which were down like Realty, IT, Oil &
Gas. Top looser were BHEL (down 7.4%), Tata Power (down 4.6%), NTPC (down
4.4%). The earnings season is well underway & will vie for investors’ attention in the
coming week as well. Technically Nifty may expected to drop from this point or a short
term range bound movement this week; Nifty this week may range 6180-5630.
Global markets declined last week due to concerns over slowing manufacturing growth and uncertainty around the US Federal Reserve's monetary policy. In Asia, Chinese and Hong Kong markets fell on measures to tighten liquidity, while Japan saw rising trade deficits. European markets were mixed with declining PMIs but positive business surveys in Germany. In India, markets declined ahead of the upcoming Union Budget amid expectations of efforts to balance populist measures with fiscal discipline. Bond yields eased but rates remained high due to liquidity issues.
- Global markets retreated this week as weak economic data from the US offset monetary easing by Japan and status quo from the ECB. Commodity prices fell on weak demand and rising US inventories.
- In Asia, Japan's aggressive monetary easing boosted stocks but other markets fell due to tensions in Korea and a bird flu scare in China. Manufacturing indicators rose in many Asian economies.
- European markets declined with high unemployment in the Eurozone and falling composite PMIs. The ECB and BoE kept rates unchanged while Portugal's austerity measures were rejected.
The Indian stock markets declined on Monday led by losses in public sector, realty and metal stocks. The BSE Sensex fell 0.86% and Nifty 50 dropped 0.91%. State Bank of India reported higher profits for the September quarter but its shares fell 3.89%. Asian markets also declined on concerns about the impact of storm Sandy on the US economy and a contraction in the Japanese economy. The Indian markets are expected to have a weak opening on Tuesday ahead of the industrial production data release and following losses in Asia.
- Global markets had a strong week as positive economic data from large economies boosted indices, though some EM/Asian markets weakened.
- In India, frontline equity indices saw small gains supported by large cap earnings, while mid/small caps fell. Bond yields were largely stable ahead of the upcoming RBI policy.
- The Bank of Japan adopted open-ended monetary easing and a new 2% inflation target to boost growth amid weak exports and imports.
The weekly newsletter provides a market wrap of the week's performance of key stock indices. Indian markets gained over 1.5% for the week supported by the ECB's pledge to buy bonds of troubled Eurozone countries. Technically, Nifty is expected to trade in the range of 5150-5500. Key events next week include India's IIP and WPI inflation numbers and the US FOMC meeting where further monetary stimulus is expected.
- Indian markets fell for the fifth straight session to their lowest closing level in 17 weeks as inflation accelerated in April, hurting investor sentiment. Inflation rose to 7.23% in April from 6.89% in March.
- Banking and real estate stocks declined after higher inflation reduced hopes of interest rate cuts. Concerns over slowing economic growth and policy paralysis also weighed on markets.
- However, buying in pharmaceutical, IT, consumer durable and capital goods stocks provided some support. Larsen and Toubro gained after forecasting revenue growth in fiscal 2013.
Ahli bank weekly capital markets newsletter 3rd 7th of march 2019ahli bank
This document contains information on regional and global economic indicators, monetary policies, and financial news. It reports that the OECD has cut its global economic outlook and warned of downside risks from trade tensions. It also discusses weak economic data from the US and Eurozone, the Federal Reserve leaving rates unchanged, the ECB restarting stimulus measures, and monetary policies in Turkey, Saudi Arabia, and other countries. Regional developments mentioned include IMF support for Jordan, Saudi deposits in Jordan's central bank, an expected large Qatari bond issue, Bahrain credit rating affirmed, and potential plans to raise an Islamic tax in Saudi banks.
- Indian stock indices edged lower after comments from the RBI Governor warning of high inflation and a record current account deficit. The Sensex fell 0.12% and Nifty fell 0.10%.
- ONGC reported a 17.5% year-over-year decline in third quarter net profit. Tata Power posted a net loss of Rs 328.9cr in the third quarter compared to a profit a year ago.
- Market breadth was negative with selling pressure on large cap stocks. Foreign institutional investors purchased Rs. 9.96 billion in equities while domestic institutions sold Rs. 9.40 billion.
Equity View:
Markets are moving into earnings season and initial results of few corporate entities seem good enough,
starting with Indusind Bank followed by Infosys. The numbers of these companies were expected to come
out well thus this outcome is not surprising from sectors like Private Sector Banks, IT, FMCG and Pharma
which are expected to perform well. There are few sectors like Capital Goods, Public Sector Banks and old
Infra Companies which can show subdued results. We expect domestic factors like government policies
to drive the market in absence of global cues. IIP data is set to come out today and is expected to be flat;
Inflation is also expected to be higher due to base effect.
Real estate markets have a cycle of around 5 – 7 years thus an off-take seems distant, however buying
could initiate after 2 – 3 years. A rate cut acts as a catalyst but it cannot help in a sudden pick-up of
demand.
There is always a trend and a counter trend in the movement of an asset class. We need to see the long
term trend. In commodities there is bearish long term trend so counter trend is bullish and thus,
currently we are seeing a counter trend in this asset. Similarly, if we have a bullish long term trend for
equity markets then from time to time there would be correction which is also happening now and this is
known as counter trend. The incremental savings of the government can either be used in the form of an
investment, subsidies or 7th Pay commission arrears. This definitely leads to correction in equity markets
but it doesn’t lead to bearish phase. If everyone is hopeful about the turnaround of Indian story and
economic revival then no one exits completely from the stock markets. Larger expectations are that
investments will certainly pick up and we all are hopeful about it.
News:
DOMESTIC MACRO:
Indirect tax collection rose 35.8% to over Rs. 3.24 lakh crore in the first half of the current fiscal.
Indirect tax collection in the period from April to September in the last fiscal stood at about Rs.
2.38 lakh crore.
The International Monetary Fund (IMF) in its latest World Economic Outlook has lowered India’s
growth forecast for FY16 to 7.3% from its July forecast of 7.5%. Growth is expected to bounce back
to 7.5% in 2016-17 on the back of reforms, pick-up in investments and lower commodity prices.
The Reserve Bank of India (RBI) will be increasing the investment limit for Foreign Portfolio
Investors (FPIs) in Government Securities to Rs. 1,79,500 crore by January 1 from the existing Rs.
1,53,500 crore.
The Cabinet approves a Railway Ministry proposal to pay bonus equivalent to 78 days’ pay, with a wage
ceiling of Rs 3500 a month.
The document provides an outlook and analysis of the Indian stock market for August 2021 from Kotak Securities. Some key points:
- The Nifty index was flat in July despite volatility, with markets focusing on corporate earnings. Select sectors like metals and IT performed well while autos and banks lagged.
- Globally, major central banks like the US Fed and ECB maintained accommodative monetary policies. However, inflation concerns emerged.
- In India, reforms by the government are expected to continue supporting economic recovery, though risks remain from a potential third COVID wave and rising commodity prices.
- The document recommends several stocks as investment ideas and provides rationale and recent earnings updates for each. It maintains an overall positive
Government’s release of Rs 86.55 billion to certain
banks for preferential allotment of shares, hopes of more reform
measures by the government in the upcoming Budget, and
sustained inflows from the foreign institutional investors (FIIs)
augured well for the local indices.
Read the full document to know more.
The key points from the document are:
1) Indian markets ended lower by 1.21% extending losses for another day, amid concerns over the US debt ceiling negotiations.
2) Food inflation in India declined to a 20 month low of 7.33% for the week ended July 16th, however the Finance Minister said the figures do not show a definitive trend and inflationary pressures remain.
3) Asian markets also declined on concerns over the US debt impasse, with the Nikkei and Hang Seng ending lower. The document expects further weakness in Indian markets in line with Asian cues.
We believe that the divergence between Value and Growth stocks continues to prevail, & that volatility is a factor which is inherent in equity as an asset class.
The document provides an economic update and investment outlook for February 2012. It notes that while the recent rise in global risk asset prices in January was a welcome change from late 2011, fundamentals have not significantly improved. Hence, the rally may be subject to reversal on any macroeconomic issues. The newsletter recommends long term debt, mid cap equities, and infrastructure companies as attractive investment avenues given their valuations and expected growth, with horizons of 1 to 2 years. It provides a snapshot of key economic indicators and markets.
The document provides quarterly financial results for PNB, UCO Bank, and City Union Bank. For PNB, revenue saw a marginal increase for the quarter ended September 2013 while profit declined 52.56%. UCO Bank reported a 5.92% rise in revenue and a remarkable 285.88% increase in net profit for the quarter. City Union Bank's revenue grew 20.48% while net profit growth was modest at 4.89% for the quarter.
The revenue and profits of India Cements declined in the quarter ended September 2013 compared to the same period last year. The net loss for the quarter was Rs. 225.30 million versus a net profit of Rs. 490.80 million last year. Operating profit also decreased from Rs. 2082.30 million to Rs. 1119.00 million.
In contrast, Tech Mahindra saw significant growth in the September 2013 quarter over the corresponding period last year. Total revenue increased 175.64% to Rs. 41562.40 million. Net profit rose sharply by 298.83% to Rs. 6386.40 million. Operating profit also grew from Rs. 2352.80 million to Rs. 8989
The revenue of Indraprastha Gas zoomed 18.11% for the quarter ended September 2013 compared to the same period last year. However, the Net Profit registered a slight decline of 6.51%. Glaxo Consumer Healthcare witnessed an 18.23% growth in revenue but Net Profit grew only 14.3% for the quarter. BHEL's sales declined 14.93% for the quarter while Net Profit fell sharply by 64.22% compared to the corresponding quarter of the previous year. Operating profit also decreased for BHEL.
This document provides key support and resistance levels for various stock indexes and individual stocks along with their open interest, change in open interest, and closing price information as of November 5, 2013. It lists Nifty, Bank Nifty, CNXIT, and various individual stock futures with their lot size, open interest, change in open interest, support levels 1 and 2 (S1 and S2), resistance levels 1 and 2 (R1 and R2), and closing price on November 5.
- Nifty futures closed at 6298.80 on Tuesday, at a premium of 45.65 points over the spot closing of 6253.15. Nifty December 2013 futures ended at a premium of 92.05 points over the spot closing.
- The put call ratio for Nifty options was 1.31, indicating higher open interest in put options. The put call ratio for Bank Nifty options was 0.97.
- For the upcoming session, the market seems bullish. However, 6317 and 6343 could act as crucial resistance levels, while 6210 and 6170 may serve as near-term support levels.
- The document provides key support and resistance levels for various stocks and indices based on their open interest as of October 30, 2013, the day before expiry. It notes the change in open interest and closing price for each underlying from the previous day. Support levels 1 and 2 (S1, S2) and resistance levels 1 and 2 (R1, R2) are given.
- Open interest increased for Nifty futures but decreased for Bank Nifty and CNXIT futures. Several individual stocks saw significant decreases in open interest, including Adani Power, Hindalco, HDIL, and JSW Steel, while open interest grew for IndusInd Bank, HDFC, and Kotak Bank.
-
The Nifty futures closed at 6,255, up 0.5% from the previous day's close. Trading volumes declined across most derivative products. Put call ratios for both Nifty and Bank Nifty options were above 1, indicating greater open interest for put options. The report provides closing prices and open interest figures for various stocks. It also outlines the most actively traded call and put options, and recommends a bearish options strategy for Nifty.
This document provides key support and resistance levels for futures contracts of various stocks trading on Indian exchanges, based on their open interest and closing price on October 29, 2013. It lists over 50 stocks, along with their lot size, open interest, change in open interest from the previous day, support and resistance levels, and closing price. The expiry date for the contracts is October 31, 2013.
The document is a daily derivative report that provides the following key information:
- Nifty futures closed at 6231.10, a premium of 10.20 points over the spot closing of 6220.90. Open interest on Nifty October futures contracted by 1.3 million units to 12.82 million units.
- Several stock futures like Tata Steel, Yes Bank, DLF, and ICICI Bank traded at discounts to their spot closing prices.
- Put call ratios for Nifty and Bank Nifty options were 1.66 and 1.27 respectively, indicating higher put open interest.
- Total futures and options turnover increased 94.24% compared to the previous day, with gains
This document provides key support and resistance levels for various stock futures contracts expiring on October 31, 2013. It lists underlying stocks, their lot size, open interest, change in open interest, percentage change in open interest and closing price from October 28, 2013. It also provides support levels S1 and S2 and resistance levels R1 and R2 for each stock future contract based on technical analysis.
This document provides key support and resistance levels for various stock indexes and futures as of October 25, 2013. It lists underlying assets, their lot size, open interest, changes in open interest, support and resistance levels, and closing prices from the previous day. The expiry date for the futures contracts is October 31, 2013. It contains this information for indexes like Nifty, Bank Nifty, CNXIT and over 50 stock futures.
The document is a daily derivatives report that provides key information on the NIFTY futures market. Some of the key details included in the summary are:
- NIFTY futures closed at 6,141, down 19.45 points (0.32%) from the previous day's close.
- Total futures and options volume declined 21.02% compared to the previous day.
- The put call ratio for Nifty and Bank Nifty options was 1.45 and 1.08 respectively, indicating higher put open interest.
- Most active stock futures like DLF, ITC, Yes Bank and Tata Steel were trading at premiums between 0.25-2.90 points compared to their spot prices
- Nifty futures closed at 6177.00 on Thursday, at a premium of 12.65 points over the spot closing of 6164.35. Nifty November 2013 futures ended at 6227.05, at a premium of 62.70 points over the spot closing.
- Trading volumes increased for index futures (10.78%), index options (10.21%) and decreased for stock futures (-6.60%) and stock options (-11.76%).
- Key support and resistance levels for Nifty are seen at 6105/6032 and 6235/6280 respectively.
This document provides a summary of futures trading data for various stocks and indices for the expiry date of 31st October 2013. It lists the underlying asset, lot size, open interest, change in open interest, support and resistance levels, and closing price from 23rd October 2013. Key details include an overall increase in open interest for Nifty futures of 6.54% and Bank Nifty futures of 4.06%, while open interest decreased for CNXIT futures by 7.9%. Support and resistance levels are provided to indicate possible price movement ranges.
Nifty futures closed lower at 6,178.35 points, down 0.39% from the previous day's close. Trading volumes increased across all derivative segments. Put call ratios for both Nifty and Bank Nifty options were above 1, indicating greater open interest in put options. Most active calls and puts were seen in the 6,100-6,300 strike price range for the October 31 expiry. The report provides an outlook for Nifty, noting key resistance and support levels. It also includes a sample options strategy for Nifty and a tracker of previous strategies.
Nifty futures closed lower at 6,178.35 points, down 0.39% from the previous day's close. Trading volumes increased across all derivative segments. Put call ratios for both Nifty and Bank Nifty options indicate a bearish sentiment. Most active calls and puts were seen in the 6,100-6,300 strike prices for the October 31 expiry. The report provides an outlook for Nifty, noting key resistance and support levels. It also includes the most and least active stocks by change in open interest. Strategies tracked show profits booked from positions in Nifty futures and options.
This document provides key support and resistance levels for various stock indexes and futures as of October 22, 2013. It lists underlying assets, their lot sizes, open interest levels and changes, and support and resistance price levels. The expiry date for futures contracts is October 31, 2013. Overall, open interest increased for many indexes and stocks compared to the previous day.
- The document provides key support and resistance levels for various stocks and indices in the futures and options market. It lists the underlying, lot size, open interest, change in open interest, closing price and support and resistance levels for each stock.
- The highest changes in open interest were seen in Federal Bank (44.72%), IDFC (10.08%), and Cairn India (10.99%) while the largest falls were in HDFCBank (-2.22%) and LIC Housing Finance (-1.49%).
- The expiry date for the futures and options contracts is 31st October 2013.
- The Nifty futures closed at 6236.00 on Monday, a premium of 31.05 points over the spot closing of 6,204.95.
- Put call ratios for Nifty and Bank Nifty options were 1.59 and 1.06 respectively, indicating higher put open interest.
- Total futures and options turnover decreased by 17.43% on Monday compared to the previous day, with index options seeing the largest fall of 19.52%.
More from Mansukh Investment & Trading Solutions (20)
OJP data from firms like Vicinity Jobs have emerged as a complement to traditional sources of labour demand data, such as the Job Vacancy and Wages Survey (JVWS). Ibrahim Abuallail, PhD Candidate, University of Ottawa, presented research relating to bias in OJPs and a proposed approach to effectively adjust OJP data to complement existing official data (such as from the JVWS) and improve the measurement of labour demand.
Monthly Market Risk Update: June 2024 [SlideShare]Commonwealth
Markets rallied in May, with all three major U.S. equity indices up for the month, said Sam Millette, director of fixed income, in his latest Market Risk Update.
For more market updates, subscribe to The Independent Market Observer at https://blog.commonwealth.com/independent-market-observer.
Confirmation of Payee (CoP) is a vital security measure adopted by financial institutions and payment service providers. Its core purpose is to confirm that the recipient’s name matches the information provided by the sender during a banking transaction, ensuring that funds are transferred to the correct payment account.
Confirmation of Payee was built to tackle the increasing numbers of APP Fraud and in the landscape of UK banking, the spectre of APP fraud looms large. In 2022, over £1.2 billion was stolen by fraudsters through authorised and unauthorised fraud, equivalent to more than £2,300 every minute. This statistic emphasises the urgent need for robust security measures like CoP. While over £1.2 billion was stolen through fraud in 2022, there was an eight per cent reduction compared to 2021 which highlights the positive outcomes obtained from the implementation of Confirmation of Payee. The number of fraud cases across the UK also decreased by four per cent to nearly three million cases during the same period; latest statistics from UK Finance.
In essence, Confirmation of Payee plays a pivotal role in digital banking, guaranteeing the flawless execution of banking transactions. It stands as a guardian against fraud and misallocation, demonstrating the commitment of financial institutions to safeguard their clients’ assets. The next time you engage in a banking transaction, remember the invaluable role of CoP in ensuring the security of your financial interests.
For more details, you can visit https://technoxander.com.
University of North Carolina at Charlotte degree offer diploma Transcripttscdzuip
办理美国UNCC毕业证书制作北卡大学夏洛特分校假文凭定制Q微168899991做UNCC留信网教留服认证海牙认证改UNCC成绩单GPA做UNCC假学位证假文凭高仿毕业证GRE代考如何申请北卡罗莱纳大学夏洛特分校University of North Carolina at Charlotte degree offer diploma Transcript
Economic Risk Factor Update: June 2024 [SlideShare]Commonwealth
May’s reports showed signs of continued economic growth, said Sam Millette, director, fixed income, in his latest Economic Risk Factor Update.
For more market updates, subscribe to The Independent Market Observer at https://blog.commonwealth.com/independent-market-observer.
An accounting information system (AIS) refers to tools and systems designed for the collection and display of accounting information so accountants and executives can make informed decisions.
South Dakota State University degree offer diploma Transcriptynfqplhm
办理美国SDSU毕业证书制作南达科他州立大学假文凭定制Q微168899991做SDSU留信网教留服认证海牙认证改SDSU成绩单GPA做SDSU假学位证假文凭高仿毕业证GRE代考如何申请南达科他州立大学South Dakota State University degree offer diploma Transcript
Dr. Alyce Su Cover Story - China's Investment Leadermsthrill
In World Expo 2010 Shanghai – the most visited Expo in the World History
https://www.britannica.com/event/Expo-Shanghai-2010
China’s official organizer of the Expo, CCPIT (China Council for the Promotion of International Trade https://en.ccpit.org/) has chosen Dr. Alyce Su as the Cover Person with Cover Story, in the Expo’s official magazine distributed throughout the Expo, showcasing China’s New Generation of Leaders to the World.
Mutual Fund Taxation – How Mutual Funds Are Taxeddhvikdiva
Divadhvik explains Mutual Fund Taxation clearly: Equity funds held over a year are taxed at 10% for gains over ₹1 lakh, while short-term gains are taxed at 15%. Debt funds held over three years are taxed at 20% post-indexation. Short-term gains are taxed as per your income slab.
1. Weekly Market Outlook 23 June 2012
make more, for sure.
SNAPSHOT
DATA MATRIX FOR THE WEEK
After accumulating over six percent gains in last two weeks, stock markets in India snapped a volatile
18th June 2012 - 22nd June 2012 week on a flat note. Though the frontline equity indices could negotiate only marginal gains, however
they went on to extend the gaining streak for the third straight week. The markets closed in the positive
territory for three straight sessions during the five session week however the declines on first and last days
Weekly Markets
of the week undid almost all the good work. It turned out to be a disappointing start for the week as the
Sensex 16,973 0.14% frontline equity indices settled with huge losses of about one and half a percent on Monday. Sentiments'
got spooked after RBI maintained a status quo on key interest rates, choosing to keep its focus on reining in
Nifty 5,146 0.14% inflationary pressure on economy rather than stimulating economic momentum. The central bank's move
defied wider market expectations of a cut in key interest rates by 25 basis points. Meanwhile, a separate
Gold(US$/oz) 1,572.9 -3.37%
data highlighted that India's consumer price inflation moved up marginally to 10.36% in May on account
Re/US$ 57.12 3.13% of increase in prices of vegetables, edible oils and milk. The downside in domestic markets also was
capped due to sharp fall in Brent crude prices which fell below $90 for the first time since December 2011,
Dow 12,641 -0.99% and marking a 28% decline over roughly three months.
Nasdaq 2,892 0.67% 2500 Volume* & Volatility Index (Nifty - June 2012) 30
FX Res (US$ Bn) 289.396 0.70% 2000 25
20
1500
Net FII / DII Equity Activity (Rs Cr) 15
1000
10
Upto 22.06.12 FIIs DIIs 500 5
Total June 2012 608.3 925.0 0 0
Total 2012 35,421 -19,347 11-Jun 12-Jun 13-Jun 14-Jun 15-Jun 18-Jun 19-Jun 20-Jun 21-Jun 22-Jun
*NSE
Cash Volume (Rs bn) F & O Volume (Rs bn) Volatility Index %
Weekly Sector Movement
Sectors Close %
Auto 9,338 1.35
Bankex 11,561 -0.22
CD 6,175 0.87
CG 9,738 2.21
FMCG 4,875 0.75
Healthcare 6,710 1.97
IT 5,664 -1.77
Metal 10,345 -0.48
Oil & Gas 7,895 0.90 BSE Sensex gained 22.68 points or 0.13% to 16972.51 during the week ended June 22, 2012. The BSE Mid-
cap index was up by 51.71 points or 0.87% to 6010.21 and the Small-cap index up by 56.06 points or 0.88%
PSU 7,090 1.33 to 6407.50. The S&P CNX Nifty rose by 7.00 points or 0.14% to 5146.05. On the NSE, Bank Nifty down
Realty 1,631 0.49 26.45 points or 0.26% to 10038.35, CNX IT down 105.90 points or 1.73% to 6028.55 while CNX mid- cap up
101.05 points or 1.44% to 7133.35 and CNX Nifty Junior up 59.00 points or 0.61% to 9780.70.
WEEK AHEAD
Volatility is expected to be at the fore for the markets in the coming week as Traders will roll-over their position with expiry of June F&O contracts on
Thursday, June 28, 2012. In addition to this RBI governor came out with major policy announcements on June 25. Meanwhile, Telecom stocks may
remain in limelight as Department of Telecomm (DOT) may move a Cabinet note on spectrum pricing policy next week. Additionally, PSU OMCs too
would be on investor's radar, after Brent crude dipping sub $90/ per barrel level, touched the 18 month low level in the week gone by. Meanwhile, the
progress of monsoon rains too will be closely tracked by the markets as inflation decline will depend on better monsoon. On the global front, investor's
would be eyeing the release of key economic data from US starting from Durable Goods Orders data on June 27,2012, followed by GDP and Jobless
Claims Data on June 28,2012 and finally the Personal Income and Outlays data on June 29,2012. Therefore we are expecting quite a positive scenario in
the upcoming week though 5280-5310 could be the key resistance zone. On the flip side any negative outcome from central bank would create some panic
among traders however 4900 may be the key level to watch in case of any sharp slide. HAPPY TRADING...
Please refer to important disclosures at the end of this report For Private circulation Only For Our Clients Only
1
Mansukh Securities and Finance Ltd SEBI Reg.No: BSE: INB 010985834, F&O: INF 010985834
Office: 306, Pratap Bhavan, 5, Bahadur Shah Zafar Marg, New Delhi-110002 NSE: INB 230781431, F&O: INF 230781431, DP: IN-DP-CDSL-73-2000, IN-
DP-NSDL-140-2000
Phone: 011-30123450/1/3/5 Fax: 011-30117710 Email: research@moneysukh.com
MCX/TCM/CORP/0740 NCDEX/TCM/CORP/0293
Website: www.moneysukh.com
4. Weekly Market Outlook
make more, for sure.
FORTHCOMING CORPORATE ACTIONS
Ex-Date Company Name NSE- Symbol Purpose
25-Jun-12 Indian Bank INDIANB AGM AND DIVIDEND - RS. 7.50 PER SHARE
25-Jun-12 Plethico Pharmaceuticals Limited PLETHICO ANNUAL GENERAL MEETING
25-Jun-12 Sterlite Industries ( India ) Limited STER AGM AND DIVIDEND RE.1/- PER SHARE
26-Jun-12 National Oxygen Limited NOL RIGHTS ISSUE AT 3:5 @ PREMIUM AT RS. 40 PER SHARE
26-Jun-12 JMT Auto Limited JMTAUTOLTD AGM AND DIVIDEND - RS.1/- PER SHARE
27-Jun-12 Andhra Bank ANDHRABANK AGM AND DIVIDEND - RS.5.50 PER SHARE
27-Jun-12 Apcotex Industries Limited APCOTEXIND DIVIDEND RS 8 PER SHARE
27-Jun-12 KEC International Limited KEC ANNUAL GENERAL MEETING/DIVIDEND RS 1.20 PER SHARE
27-Jun-12 Dabur India Limited DABUR AGM AND DIVIDEND RE.0.75 PER SHARE
28-Jun-12 LGB Forge Limited LGBFORGE ANNUAL GENERAL MEETING
28-Jun-12 Banaras Beads Limited BANARBEADS ANNUAL GENERAL MEETING/DIVIDEND RS 1.50 PER SHARE
28-Jun-12 DCM Limited DCM ANNUAL GENERAL MEETING/DIVIDEND RS 2.50 PER SHARE
28-Jun-12 D-Link (India) Limited DLINKINDIA ANNUAL GENERAL MEETING/DIVIDEND RE 0.40 PER SHARE
28-Jun-12 Sarda Energy & Minerals Limited SARDAEN DIVIDEND - RS.3/- PER SHARE
28-Jun-12 Sonata Software Limited SONATSOFTW ANNUAL GENERAL MEETING/DIVIDEND RS 0.25 PER SHARE
28-Jun-12 Sterling Tools Limited STERTOOLS AGM AND DIVIDEND RS.5/- PER SHARE
28-Jun-12 Dr. Reddy's Laboratories Limited DRREDDY AGM AND DIVIDEND - RS.13.75 PER SHARE
28-Jun-12 Hindustan Zinc Limited HINDZINC AGM AND DIVIDEND RE.0.90 PER SHARE
28-Jun-12 Indbank Merchant Banking Services Limited INDBANK ANNUAL GENERAL MEETING
28-Jun-12 Visaka Industries Limited VISAKAIND ANNUAL GENERAL MEETING/DIVIDEND RS 5 PER SHARE
28-Jun-12 Wipro Limited WIPRO AGM AND DIVIDEND RS.4/- PER SHARE
28-Jun-12 LG Balakrishnan & Bros Limited LGBBROSLTD AGM AND DIVIDEND RS.11/- PER SHARE
28-Jun-12 Kesoram Industries Limited KESORAMIND AGM AND DIVIDEND RE.1/- PER SHARE
28-Jun-12 HDFC Bank Limited HDFCBANK AGM AND DIVIDEND RS.4.30 PER SHARE
28-Jun-12 Ajanta Pharma Limited AJANTPHARM ANNUAL GENERAL MEETING/DIVIDEND RS 7.50 PER SHARE
28-Jun-12 Infrastructure Development Finance Company IDFC ANNUAL GENERAL MEETING/DIVIDEND RS 2.30 PER SHARE
28-Jun-12 Kovai Medical Center & Hospital Limited KOVAI AGM/ DIV OF RS. 1.25/- PER SHARE
28-Jun-12 Sundaram Finance Limited SUNDARMFIN ANNUAL GENERAL MEETING/DIVIDEND RS 8 PER SHARE
28-Jun-12 Xpro India Limited XPROINDIA AGMAND DIVIDEND RS.2.50 PER SHARE
29-Jun-12 Zylog Systems Limited ZYLOG FACE VALUE SPLIT FROM RS 10 TO RS 5
29-Jun-12 Nucleus Software Exports Limited NUCLEUS ANNUAL GENERAL MEETING/DIVIDEND RS 2.50 PER SHARE
29-Jun-12 Kajaria Ceramics Limited KAJARIACER ANNUAL GENERAL MEETING/DIVIDEND RS 2.50 PER SHARE
29-Jun-12 Tata Sponge Iron Limited TATASPONGE AGM AND DIVIDEND - RS.8/- PER SHARE
3-Jul-12 Thirumalai Chemicals Limited TIRUMALCHM ANNUAL GENERAL MEETING
4-Jul-12 Havells India Limited HAVELLS AGM AND DIVIDEND - RS.6.50 PER SHARE
4-Jul-12 Hindustan Unilever Limited HINDUNILVR AGM AND DIVIDEND RS.4/- PER SHARE
4-Jul-12 Ingersoll Rand (India) Limited INGERRAND ANNUAL GENERAL MEETING/DIVIDEND RS 3 PER SHARE
4-Jul-12 Magma Fincorp Limited MAGMA AGMAND DIVIDEND RE.0.60 PER SHARE
4-Jul-12 GIC Housing Finance Limited GICHSGFIN AGM AND DIVIDEND - RS.4.50 PER SHARE
4-Jul-12 Surana Industries Limited SURANAIND ANNUAL GENERAL MEETING/DIVIDEND RS 1.20 PER SHARE
5-Jul-12 Thangamayil Jewellery Limited THANGAMAYL ANNUAL GENERAL MEETING/DIVIDEND RS 7 PER SHARE
5-Jul-12 Geojit BNP Paribas Financial Services Limited GEOJITBNPP ANNUAL GENERAL MEETING/DIVIDEND RE 0.75 PER SHARE
5-Jul-12 Dish TV India Limited DISHTV ANNUAL GENERAL MEETING
5-Jul-12 Zee News Limited ZEENEWS ANNUAL GENERAL MEETING
5-Jul-12 Rane Brake Lining Limited RBL ANNUAL GENERAL MEETING/DIVIDEND RS 3 PER SHARE
4
Mansukh Securities and Finance Ltd SEBI Reg.No: BSE: INB 010985834, F&O: INF 010985834
Office: 306, Pratap Bhavan, 5, Bahadur Shah Zafar Marg, New Delhi-110002 NSE: INB 230781431, F&O: INF 230781431, DP: IN-DP-CDSL-73-2000, IN-
DP-NSDL-140-2000
Phone: 011-30123450/1/3/5 Fax: 011-30117710 Email: research@moneysukh.com
MCX/TCM/CORP/0740 NCDEX/TCM/CORP/0293
Website: www.moneysukh.com
5. Weekly Market Outlook
make more, for sure.
EQUITY CALLS PERFORMANCE FOR THE WEEK ENDED 22nd June 2012
Total No. of Calls Profitable Calls Positional/Hold Exit/Stop Loss Success Rate
30 19 0 11 63.33%
NAME DESIGNATION E-MAIL
Varun Gupta Head - Research varungupta@moneysukh.com
Pashupati Nath Jha Research Analyst pashupatinathjha@moneysukh.com
Vikram Singh Research Analyst vikram_research@moneysukh.com
This report is for the personal information of the authorized recipient and does not construe to be any investment, legal or taxation advice to you. Mansukh
Securities and Finance Ltd (hereinafter referred as MSFL) is not soliciting any action based on it. This report is not for public distribution and has been
furnished to you solely for your information and should not be reproduced or redistributed to any person in any form.
The report is based upon information that we consider reliable, but we do not represent that it is accurate or complete. MSFL or any of its affiliates or
employees shall not be in any way responsible for any loss or damage that may arise to any person from any inadvertent error in the information contained
in this report. MSFL or any of its affiliates or employees do not provide, at any time, any express or implied warranty of any kind, regarding any matter
pertaining to this report, including without limitation the implied warranties of merchantability, fitness for a particular purpose, and non-infringement.
The recipients of this report should rely on their own investigations.
MSFL and/or its affiliates and/or employees may have interests/positions, financial or otherwise in the securities mentioned in this report. This
information is subject to change without any prior notice. MSFL reserves the right to make modifications and alterations to this statement as may be
required from time to time. Nevertheless, MSFL is committed to providing independent and transparent recommendations to its clients, and would be
happy to provide information in response to specific client queries.
5
Mansukh Securities and Finance Ltd SEBI Regn No. BSE: INB010985834 / NSE: INB230781431
SEBI Reg.No: BSE: INB 010985834, F&O: INF 010985834
Office: 306, Pratap Bhavan, 5, Bahadur Shah Zafar Marg, New Delhi-110002 NSE: INB 230781431, F&O: INF 230781431, DP: IN-DP-CDSL-73-2000, IN-
PMS Regn No. INP000002387
DP-NSDL-140-2000
Phone: 011-30123450/1/3/5 Fax: 011-30117710 Email: research@moneysukh.com
MCX/TCM/CORP/0740 NCDEX/TCM/CORP/0293
Website: www.moneysukh.com