The weekly market outlook document provides the following information:
1) Indian stock markets declined for the second consecutive week, with the Sensex and Nifty falling 1.6% and 1.29% respectively, as bears took control of Dalal Street.
2) Volatility is expected to continue in the coming weeks due to upcoming state election results and the union budget.
3) The document provides technical analysis for 30 Sensex stocks and 50 Nifty midcap stocks, identifying support and resistance levels.
Indian stock markets gained for the seventh consecutive week, with the Sensex rising 3.04% and Nifty up 3.75%. Foreign institutional investors contributed to the rise by investing over Rs. 10,000 crore in Indian equities during the week. Several sectors such as auto, banks, capital goods and real estate saw gains over 6%. However, inflation declined to a 2-year low of 6.55% in January, giving the RBI scope to cut interest rates. Volatility is expected in the upcoming week due to F&O contract expiry and various economic data releases.
The Indian stock markets extended their gains for a sixth straight week as the benchmark indices rose over 1%. Foreign investors have poured $3.6 billion into Indian equities so far this year, outperforming many global markets. The markets gained on positive US jobs data but slipped on India's lower-than-expected GDP growth of 6.9% for fiscal year 2012. Hopes of further aid to Greece helped the markets recover. Key factors to watch this week include India's January inflation data and various major company earnings announcements. The outlook is for a range-bound market between 5,200-5,480 points.
The weekly market outlook document provided a summary of market performance for the week ending June 22, 2012. Some key points:
- Indian stock markets ended the week flat after gaining over 6% in the previous two weeks. Frontline indices saw marginal gains but extended their gaining streak to three weeks.
- Sentiment was dampened after the RBI maintained interest rates, defying expectations of a cut. Inflation also rose slightly to 10.36% in May.
- Technical support and resistance levels were provided for 30 Sensex stocks and 50 Nifty Midcap stocks to gauge the market outlook and inclination for the upcoming week.
The Indian stock markets continued their upward momentum in the past week, with the Sensex gaining 2.96% to close at 17,234 and the Nifty gaining 3.09% to close at 5,205. Key highlights of the week were the RBI's monetary policy decision to keep interest rates unchanged but cut CRR, and overall bullish sentiment continuing to drive the markets higher. In the coming week, investors will watch out for recommendations on sugar sector deregulation and quarterly earnings results from various companies.
The Indian stock market indices extended gains for the second straight week, rising over 2% as domestic economic indicators improved and concerns over the Eurozone debt crisis eased. The Sensex closed at 16,155 and the Nifty at 4,866. Monthly industrial growth was higher than expected at 5.9% in November. Weekly food inflation declined for the tenth straight week. In the coming week, markets will watch results announcements and global economic data for cues.
The weekly market outlook document provides a snapshot of market performance for the week ending April 20th, 2012 and an outlook for the following week:
- Indian stock markets gained over 1.5% for the week, recovering slightly from losses the prior week, aided by the RBI's 50 basis point interest rate cut.
- The auto sector rallied the most, up nearly 6%, while oil & gas declined the most.
- In the coming week, markets will watch the April F&O contracts expiration on the 26th as well as Reliance Industries' earnings. Global economic data from the US will also be monitored.
- Technical indicators show some sectors like auto, metal and healthcare have positive
The Indian stock markets declined over the past week. The Sensex fell 1.38% and the Nifty fell 1.89% due to concerns over a potential downgrade of India's credit rating and slowing economic growth. Several sectors declined over 3%, with the technology sector outperforming. Looking ahead, the markets may remain lackluster as investors await key economic data releases from India and the US. Support levels of 5130-5150 could trigger further declines in the Nifty if broken.
The Indian equity markets had a strong week, with the key indices gaining around 2-3%. The markets recovered losses from the previous week and broke past psychological resistance levels. Sector performance was mixed, with banking, capital goods and metals performing well while FMCG declined slightly. Looking ahead, the market is awaiting major corporate earnings results and economic data. The trading range for the coming week is expected to be between 4500-4860 points.
The key points from the document are:
1) In the past week, Indian markets gained over 2% despite consolidating in the last 3 sessions, buoyed by hopes that major central banks will enact stimulus measures.
2) The BSE Sensex surged 2.13% for the week while the Nifty gained 2.27%.
3) The RBI maintained its status quo on interest rates, dashing hopes of a stimulus, but markets recovered and moved higher later in the week on global optimism.
The Indian stock markets declined for the second consecutive week, with the Sensex and Nifty falling 3.2% and 3.1% respectively. Trading was volatile, with the indices falling on 4 of the 5 trading sessions. Weak industrial production data and concerns about the domestic and global economic outlook weighed on investor sentiment. Key factors to watch in the coming week include inflation data, various corporate earnings announcements, the trajectory of the rupee, and economic data from the US. Technical indicators suggest further downside for many scrips if support levels are breached.
The Indian stock markets declined sharply last week as global cues turned bearish. The Sensex fell 4.04% to close at 20,157 while the Nifty dropped 3.80% to 6,072. Earnings disappointments from some major companies and weaker industrial production data weighed on investor sentiment. All sectoral indices ended lower, with realty and banking stocks witnessing heavy losses. Global concerns around European debt and expectations of monetary tightening in China also dragged down markets. The volatility index rose over 11% indicating increased uncertainty. The coming week may see further volatility as focus shifts to global developments and domestic inflation numbers.
The mutual fund industry in India saw a 1.5% decrease in assets under management in June 2012 due to large outflows from liquid funds. The overall industry witnessed outflows of Rs. 23,969 crore during the month. Indian equity markets closed higher at the end of June as global markets rallied after European leaders took action to address banking issues. Government bond yields declined over the month as liquidity improved in the banking system.
The Indian stock market indices ended higher extending gains to a third straight session, with the Sensex gaining 0.39% to close at 18,274 and the Nifty gaining 0.46% to close at 5,481. Key sectors like oil & gas, banking and autos saw gains while capital goods, realty and IT saw losses. Globally, US stocks retreated from recent highs as retail sales increased less than expected in January. Asian markets opened mixed with the Nikkei up 0.4% while the Hang Seng was down 0.2%.
The Indian stock markets surged last week, with the Sensex gaining over 6% and regaining levels of 17,800 and 5,350. Positive developments in Europe regarding a debt deal helped boost sentiment. For the coming week, auto sales, cement dispatch, and export data will be watched. Sugar stocks may see action as sugar export policy is expected. Company results including Maruti, ICICI Bank, and Wipro will also be in focus. Globally, US jobless claims data will be monitored. The markets may see further gains if Nifty breaks above resistance at 5,400-5,410.
The Indian stock markets ended flat on Friday after three straight days of gains, as investors took a pause from the post-budget rally. The BSE Sensex closed at 18,486, barely changed from the previous day, while the Nifty ended flat at 5,538. US stocks declined on Friday erasing some of the big gains from earlier in the week due to concerns over rising oil prices. Asian markets started the week lower with Nikkei down 1.3% and Hang Seng declining marginally.
The Indian markets ended higher after the Union Budget was presented, gaining 0.69% (Sensex) and 0.56% (Nifty). Though the Budget did not meet all expectations, it was welcomed by markets. Globally, US stocks advanced and Asian markets opened positively. Key proposals in the Budget included introducing GST and increasing Plan expenditure. Commodity prices were mostly flat with gold up 0.01% while the rupee closed lower against the dollar.
The Indian stock markets declined slightly on June 2nd due to losses in global markets. The BSE Sensex fell 115 points to 18,494 and the NSE Nifty fell 42 points to 5,550. Most sectors declined except FMCG and consumer durables. Globally, US stocks retreated after data showed slower job growth while Asian markets opened mixed. Investors await details from Reliance Industries' AGM on their forays into power, telecom and financial services.
The document provides market data and commentary for Indian and global markets on July 14, 2011. Some key points:
- Indian markets ended slightly higher, with the Sensex up 0.12% and Nifty up 0.26%, as inflation did not accelerate as feared. However, a late selloff erased gains.
- US stocks fell as the Fed chairman said he won't immediately stimulate the economy, which was downgraded to a negative outlook. Asian markets were mixed.
- Bajaj Auto reported a 20.48% rise in quarterly profit. TCS' quarterly profit rose 26.7% while revenue increased 31.4%. Inflation rose to 9.44% in June
The Indian stock markets ended lower for the second straight day due to weak global cues and some disappointing corporate results. The BSE Sensex closed at 18,436, down 0.36% while the NSE Nifty ended at 5,542, lower by 0.46%. On the global front, European markets rallied as officials detailed a new aid plan for Greece. The Dow Jones and S&P 500 indexes in the US closed higher by over 1%. Key corporate and economic news included a 13% rise in net profit for Hero Honda, a 38% increase for YES Bank, and a fall in annual food inflation to 7.58%.
Special report by epic research of 14 november 2017Epic Research
Epic Research prepares a special report on a daily basis which provides share market overview to the investors in brief. We aim to serve you best in class financial services at affordable prices.
The document provides a weekly market update covering the performance of key stock indices globally and in India. It notes that the Indian stock market declined over 1% for the week as the Sensex fell due to a rating downgrade of SBI and contraction in manufacturing and services PMIs. Macro data on exports, imports and growth forecasts are also mentioned. The outlook section discusses upcoming earnings and economic data releases in India and monetary policies in major countries.
The key Indian equity indices closed higher for a second day in a row, with the BSE Sensex up 0.57% and the NSE Nifty up 0.58%. Global markets fell, with the S&P 500 down 2.3% and manufacturing data fueling concerns about slowing global economic growth. Domestically, mixed economic data strengthened beliefs the RBI may not take an aggressive monetary policy stance. Corporate news included Godrej acquiring a hair care company, Lupin partnering on cell line technology, and Maruti reporting a sales increase.
The Indian equity markets fell for the second consecutive day due to the RBI's surprise decision to raise interest rates by 50 basis points. The Sensex closed at 18,432, down 0.46% and the Nifty closed at 5,546, down 0.52%. In global markets, Wall Street fell 1-2% due to weak US economic data and debt ceiling talks. Domestically, several companies such as Dabur, GAIL and Lupin reported higher Q1 profits. The rupee closed at 44.06 vs the US dollar. Brent crude oil prices fell 0.69% while gold prices closed flat.
The Indian stock markets ended modestly higher on February 2, 2011, snapping a five-day losing streak. The BSE Sensex gained 0.38% to close at 18,090 and the NSE Nifty rose 0.27% to end at 5,432. Most other Asian markets also rose, while US markets were mixed. Corporate earnings news was mixed, with Bharti Airtel reporting a large drop in profits but Bajaj Auto seeing an 18% rise in January sales. Bond yields and currency rates were mostly flat.
The Indian stock markets ended lower on January 27, 2011, with the BSE Sensex falling 285 points to close at 18,684 and the NSE Nifty losing 83 points to end at 5,604. Most sectoral indices also closed in the red, with metals losing nearly 2% and realty declining over 3%. Corporate earnings were mixed, with HDFC Bank and Lupin reporting profit growth while JSW Steel's profit declined. Global markets were mixed as well, with US indices closing slightly higher while Asian markets opened mixed. Commodity prices declined with crude oil falling nearly 2% while gold and silver closed lower and flat respectively. The rupee closed higher against the dollar.
The document provides a summary of key support and resistance levels for various stock and index futures contracts trading on the Indian commodity exchange as of October 25, 2011. It lists the open interest, changes in open interest, support and resistance levels, and previous day's close for various contracts expiring on November 24, 2011 in 3 sentences or less.
Nifty Aug 5000 call added 4.78 lakh shares in OI, up 7.92% and 5100 call added 0.13 lakh shares in OI, up 0.29%. On the put side nifty Aug 4900 put added 4.55 lakh shares in OI, up 12.63% and 4800 put added 4.85 lakh in OI, up 9.74%. The put-call ratio of stock option decreases from 0.61 to 0.47 while put-call ratio of index option decreases from 1.04 to0.91. On the whole the put call ratio was at 0.89. .
- The document is a market report that provides key data on futures and options contracts expiring on April 26, 2012 for various stock indexes and individual stocks.
- It includes data such as the open interest, changes in open interest, support and resistance levels, and previous day's close for each underlying asset.
- The report aims to give readers an overview of market activity and expectations for the near-term direction of various stocks and indexes.
- The document is an analysis of futures and options data from January 5th, 2012 with an expiry date of January 25th, 2012.
- It provides information such as open interest, changes in open interest, changes in closing price for various stocks and indices.
- The stocks and indices include Nifty, Bank Nifty, CNXIT, 3IINFOTECH, ABAN, ABB, and many others across various sectors. Metrics like lot size, open interest, support and resistance levels are provided.
- The document is a summary of key support and resistance levels as well as changes in open interest and closing prices for various stock and index futures contracts expiring on August 25th, 2011.
- It shows that open interest increased over 11% for Nifty futures but decreased for Bank Nifty, Minifity and CNXIT futures. Closing prices increased for most contracts except for minor decreases in Bank Nifty and CNXIT.
- Individual stock futures saw a mix of increases and decreases in both open interest and closing prices compared to the previous day.
- The document provides key data on futures and options contracts expiring on September 29, 2011, including open interest, changes in open interest, and closing prices for various indices and stocks.
- Data is given for indexes like Nifty, Bank Nifty, and stocks from various sectors like banking, auto, pharmaceuticals, infrastructure etc.
- For each contract, details like lot size, open interest as of September 13, 2011, change in open interest, change in closing price and support and resistance levels are listed.
The penultimate week of the year 2011 brought some sigh of relief for the Indian benchmark indices as they finally managed to halt the declining streak of two previous weeks and amassed around one and half a percentage points in the period. Despite settling only twice in the green zone out the five sessions trading week,the key gauges negotiated a positive finish by the end. However, the broader markets failed to match the fervor with which their larger peers traded and underperformed them, suffering losses of around one and half a percent. The week was characterized by high amount of volatility as the frontline indices traded in a broad range and even tried hard to sail beyond the 15,900 (Sensex) and 4,750 (Nifty) levels but it seemed like the bears had the last say as they stalled the resurgence of the benchmarks and took profits off the table. Market participants also rejoiced as government released weekly inflation data which showed that India's food inflation plunged to a near four-year low to 1.81% for the week ended December 10 from 4.35% in the previous week.
Indian markets ended with gain on Friday, for this week Sensex and Nifty were red
slipping marginally by 0.4% each. Major sectors which were down like Realty, IT, Oil &
Gas. Top looser were BHEL (down 7.4%), Tata Power (down 4.6%), NTPC (down
4.4%). The earnings season is well underway & will vie for investors’ attention in the
coming week as well. Technically Nifty may expected to drop from this point or a short
term range bound movement this week; Nifty this week may range 6180-5630.
The document provides a weekly market outlook and summary for the period of October 17th-21st, 2011. It notes that the Indian markets finished the week down over 1.5% with benchmarks losing their holds over psychological levels. Sentiment remains weak due to lack of domestic triggers and discouraging global developments. Key points in the outlook are disappointing earnings reports, double digit weekly food inflation, an upcoming RBI policy announcement, and ranges for the Nifty in the coming week.
The key Indian stock market benchmarks attained two-month closing highs after moving in a tight range throughout the day. Index heavyweight Reliance Industries surged in a late rally. IT and realty stocks fell but public sector banks, auto and consumer durables stocks rose. Some small cap stocks surged strongly. The Sensex rose 58.97 points to close at 17578, up from the day's low but off the day's high. The market was volatile with gains being trimmed multiple times during the session.
The Nifty and Sensex indices closed up for the week, gaining 1.04% and 1.05% respectively. Major sectors like realty and oil & gas performed well. Top gainers during the week included HDIL, Unitech, and Cairn India. Technically, the Nifty may see a short-term range-bound movement around 6150-5690 levels this week. Risks to India's macroeconomic stability have increased due to economic slowdown, high inflation, and fiscal and current account deficits.
The Indian stock markets ended nearly unchanged on December 28, 2010 with the BSE Sensex closing just 4 points lower at 20,025. The broader Nifty index also eased by 2 points to 5,996. Most sectoral indices like FMCG, healthcare and technology saw modest gains while oil & gas, autos and PSU stocks declined. Globally, US markets closed slightly higher ahead of the New Year holidays while Asian markets opened mixed. Corporate news included Kingfisher Airlines launching new domestic flights, Punj Lloyd winning construction contracts, and MindTree incurring costs related to restructuring its wireless business.
The document provides a market review for the week ended February 15, 2013. It summarizes performance of global equity markets, bond yields, commodity prices, and currency exchange rates. It also reviews economic data and monetary policies in various regions including Asia, Europe, Americas, and India. Key highlights from the Indian market include a marginal decline in equity indices, mixed economic data, easing bond yields, and a weaker rupee.
The Union Budget for 2012-13 focused on fiscal consolidation through tax measures and limiting subsidies while also emphasizing infrastructure development and inclusive growth. Key points include GDP growth projected at 6.9% for FY12 and 7.35-7.85% for FY13, increased spending on agriculture, education, and healthcare, and measures to attract investment into capital markets and infrastructure sectors. However, the lack of major reforms disappointed markets, which declined on the day of the budget.
- Indian markets fell for a second consecutive session as investors booked profits after S&P cut India's outlook and as traders rolled over positions to the May 2012 series.
- Foreign investors remained net sellers for the third consecutive day and the month of April, while domestic institutional investors were net buyers.
- Bank stocks declined after S&P revised the outlook of 11 Indian banks/financial institutions to negative.
- Asian markets opened mixed while the Indian market is expected to have a flat to positive opening.
The weekly newsletter provides a summary of the Indian equity market performance for the past week. Key points include:
- The Nifty and Sensex indices gained marginally between 0.1-0.2% for the week.
- The government announced a relief package for the debt-ridden power sector and stuck to its borrowing target.
- Most Asian markets declined over the week while the US market closed its best third quarter since 2010.
- On technical analysis, the Nifty is expected to consolidate but remain in a bull run, ranging between 5530-5880.
The Indian stock markets declined on Monday led by losses in public sector, realty and metal stocks. The BSE Sensex fell 0.86% and Nifty 50 dropped 0.91%. State Bank of India reported higher profits for the September quarter but its shares fell 3.89%. Asian markets also declined on concerns about the impact of storm Sandy on the US economy and a contraction in the Japanese economy. The Indian markets are expected to have a weak opening on Tuesday ahead of the industrial production data release and following losses in Asia.
The Indian stock market indices declined for the week ending October 7, 2011, with the Sensex falling 1.34% and the Nifty falling 1.11%. Concerns over the financial situation in Europe contributed to the decline. Some data points from the week: India's weekly food inflation rose to 9.41%, foreign direct investment inflows surged 127.8% to $2.83 billion in August, and the trade deficit widened to $14.04 billion in August. Looking ahead, investors will watch the IIP data and company earnings reports for clues on the market direction.
The Indian stock market indices declined for the week ending October 7, 2011, with the Sensex falling 1.34% and the Nifty falling 1.11%. Concerns over the financial situation in Europe contributed to the decline. Some data points from the week include India's weekly food inflation rising to 9.41% and foreign direct investment inflows surging 127.8% in August compared to the previous year. Looking ahead, investors will monitor industrial production data and company earnings reports for clues on the market's direction.
Global markets declined last week due to concerns over slowing manufacturing growth and uncertainty around the US Federal Reserve's monetary policy. In Asia, Chinese and Hong Kong markets fell on measures to tighten liquidity, while Japan saw rising trade deficits. European markets were mixed with declining PMIs but positive business surveys in Germany. In India, markets declined ahead of the upcoming Union Budget amid expectations of efforts to balance populist measures with fiscal discipline. Bond yields eased but rates remained high due to liquidity issues.
- Global markets retreated this week as weak economic data from the US offset monetary easing by Japan and status quo from the ECB. Commodity prices fell on weak demand and rising US inventories.
- In Asia, Japan's aggressive monetary easing boosted stocks but other markets fell due to tensions in Korea and a bird flu scare in China. Manufacturing indicators rose in many Asian economies.
- European markets declined with high unemployment in the Eurozone and falling composite PMIs. The ECB and BoE kept rates unchanged while Portugal's austerity measures were rejected.
The document provides Frontline's Q4 2012 results and outlook. It discusses several transactions in Q4 including terminating some vessels and early termination of TC contracts on two OBO carriers. It reported a net loss of $16.9 million for Q4 2012 and $82.8 million for full year 2012. Frontline also provides an overview of its fleet size and average time charter rates and coverage for 2013-2014. The company estimates its cash cost breakeven rates for VLCCs and Suezmax tankers for the remainder of 2013.
The document provides an economic and market update for August 2012, analyzing factors such as global economic conditions, domestic economic growth and inflation trends, performance of key equity and debt markets, and providing an outlook on various sectors and the overall market. It notes recent monetary policy actions by central banks and analyzes their likely impact, while also offering recommendations to investors on portfolio rebalancing and positioning across different asset classes.
The Indian equity markets declined over the past week. The Nifty lost 1.97% and the Sensex fell 2%. Key sectors like banks, pharma, cement, and finance all ended lower. Technically, the Nifty may see a short-term range-bound movement around 5300-5740. Globally, US and European markets declined with the S&P 500 and Dow Jones both down around 3%. Asian markets also ended lower for the week on bearish trends.
The document provides an economic and market outlook for 2012, predicting that growth will bottom out in the first quarter of 2012 at 6% for India while inflation averages around 7%, and that monetary policy in India will start easing on the back of slowing growth and easing inflation. Globally, the outlook expects no recession in the US with growth around 2% and a tricky situation in Europe, while select emerging markets and exposure to crude oil, the US dollar, and select equities are recommended for investment.
The document provides quarterly financial results for PNB, UCO Bank, and City Union Bank. For PNB, revenue saw a marginal increase for the quarter ended September 2013 while profit declined 52.56%. UCO Bank reported a 5.92% rise in revenue and a remarkable 285.88% increase in net profit for the quarter. City Union Bank's revenue grew 20.48% while net profit growth was modest at 4.89% for the quarter.
The revenue and profits of India Cements declined in the quarter ended September 2013 compared to the same period last year. The net loss for the quarter was Rs. 225.30 million versus a net profit of Rs. 490.80 million last year. Operating profit also decreased from Rs. 2082.30 million to Rs. 1119.00 million.
In contrast, Tech Mahindra saw significant growth in the September 2013 quarter over the corresponding period last year. Total revenue increased 175.64% to Rs. 41562.40 million. Net profit rose sharply by 298.83% to Rs. 6386.40 million. Operating profit also grew from Rs. 2352.80 million to Rs. 8989
The revenue of Indraprastha Gas zoomed 18.11% for the quarter ended September 2013 compared to the same period last year. However, the Net Profit registered a slight decline of 6.51%. Glaxo Consumer Healthcare witnessed an 18.23% growth in revenue but Net Profit grew only 14.3% for the quarter. BHEL's sales declined 14.93% for the quarter while Net Profit fell sharply by 64.22% compared to the corresponding quarter of the previous year. Operating profit also decreased for BHEL.
This document provides key support and resistance levels for various stock indexes and individual stocks along with their open interest, change in open interest, and closing price information as of November 5, 2013. It lists Nifty, Bank Nifty, CNXIT, and various individual stock futures with their lot size, open interest, change in open interest, support levels 1 and 2 (S1 and S2), resistance levels 1 and 2 (R1 and R2), and closing price on November 5.
- Nifty futures closed at 6298.80 on Tuesday, at a premium of 45.65 points over the spot closing of 6253.15. Nifty December 2013 futures ended at a premium of 92.05 points over the spot closing.
- The put call ratio for Nifty options was 1.31, indicating higher open interest in put options. The put call ratio for Bank Nifty options was 0.97.
- For the upcoming session, the market seems bullish. However, 6317 and 6343 could act as crucial resistance levels, while 6210 and 6170 may serve as near-term support levels.
- The document provides key support and resistance levels for various stocks and indices based on their open interest as of October 30, 2013, the day before expiry. It notes the change in open interest and closing price for each underlying from the previous day. Support levels 1 and 2 (S1, S2) and resistance levels 1 and 2 (R1, R2) are given.
- Open interest increased for Nifty futures but decreased for Bank Nifty and CNXIT futures. Several individual stocks saw significant decreases in open interest, including Adani Power, Hindalco, HDIL, and JSW Steel, while open interest grew for IndusInd Bank, HDFC, and Kotak Bank.
-
The Nifty futures closed at 6,255, up 0.5% from the previous day's close. Trading volumes declined across most derivative products. Put call ratios for both Nifty and Bank Nifty options were above 1, indicating greater open interest for put options. The report provides closing prices and open interest figures for various stocks. It also outlines the most actively traded call and put options, and recommends a bearish options strategy for Nifty.
This document provides key support and resistance levels for futures contracts of various stocks trading on Indian exchanges, based on their open interest and closing price on October 29, 2013. It lists over 50 stocks, along with their lot size, open interest, change in open interest from the previous day, support and resistance levels, and closing price. The expiry date for the contracts is October 31, 2013.
The document is a daily derivative report that provides the following key information:
- Nifty futures closed at 6231.10, a premium of 10.20 points over the spot closing of 6220.90. Open interest on Nifty October futures contracted by 1.3 million units to 12.82 million units.
- Several stock futures like Tata Steel, Yes Bank, DLF, and ICICI Bank traded at discounts to their spot closing prices.
- Put call ratios for Nifty and Bank Nifty options were 1.66 and 1.27 respectively, indicating higher put open interest.
- Total futures and options turnover increased 94.24% compared to the previous day, with gains
This document provides key support and resistance levels for various stock futures contracts expiring on October 31, 2013. It lists underlying stocks, their lot size, open interest, change in open interest, percentage change in open interest and closing price from October 28, 2013. It also provides support levels S1 and S2 and resistance levels R1 and R2 for each stock future contract based on technical analysis.
This document provides key support and resistance levels for various stock indexes and futures as of October 25, 2013. It lists underlying assets, their lot size, open interest, changes in open interest, support and resistance levels, and closing prices from the previous day. The expiry date for the futures contracts is October 31, 2013. It contains this information for indexes like Nifty, Bank Nifty, CNXIT and over 50 stock futures.
The document is a daily derivatives report that provides key information on the NIFTY futures market. Some of the key details included in the summary are:
- NIFTY futures closed at 6,141, down 19.45 points (0.32%) from the previous day's close.
- Total futures and options volume declined 21.02% compared to the previous day.
- The put call ratio for Nifty and Bank Nifty options was 1.45 and 1.08 respectively, indicating higher put open interest.
- Most active stock futures like DLF, ITC, Yes Bank and Tata Steel were trading at premiums between 0.25-2.90 points compared to their spot prices
- Nifty futures closed at 6177.00 on Thursday, at a premium of 12.65 points over the spot closing of 6164.35. Nifty November 2013 futures ended at 6227.05, at a premium of 62.70 points over the spot closing.
- Trading volumes increased for index futures (10.78%), index options (10.21%) and decreased for stock futures (-6.60%) and stock options (-11.76%).
- Key support and resistance levels for Nifty are seen at 6105/6032 and 6235/6280 respectively.
This document provides a summary of futures trading data for various stocks and indices for the expiry date of 31st October 2013. It lists the underlying asset, lot size, open interest, change in open interest, support and resistance levels, and closing price from 23rd October 2013. Key details include an overall increase in open interest for Nifty futures of 6.54% and Bank Nifty futures of 4.06%, while open interest decreased for CNXIT futures by 7.9%. Support and resistance levels are provided to indicate possible price movement ranges.
Nifty futures closed lower at 6,178.35 points, down 0.39% from the previous day's close. Trading volumes increased across all derivative segments. Put call ratios for both Nifty and Bank Nifty options were above 1, indicating greater open interest in put options. Most active calls and puts were seen in the 6,100-6,300 strike price range for the October 31 expiry. The report provides an outlook for Nifty, noting key resistance and support levels. It also includes a sample options strategy for Nifty and a tracker of previous strategies.
Nifty futures closed lower at 6,178.35 points, down 0.39% from the previous day's close. Trading volumes increased across all derivative segments. Put call ratios for both Nifty and Bank Nifty options indicate a bearish sentiment. Most active calls and puts were seen in the 6,100-6,300 strike prices for the October 31 expiry. The report provides an outlook for Nifty, noting key resistance and support levels. It also includes the most and least active stocks by change in open interest. Strategies tracked show profits booked from positions in Nifty futures and options.
This document provides key support and resistance levels for various stock indexes and futures as of October 22, 2013. It lists underlying assets, their lot sizes, open interest levels and changes, and support and resistance price levels. The expiry date for futures contracts is October 31, 2013. Overall, open interest increased for many indexes and stocks compared to the previous day.
- The document provides key support and resistance levels for various stocks and indices in the futures and options market. It lists the underlying, lot size, open interest, change in open interest, closing price and support and resistance levels for each stock.
- The highest changes in open interest were seen in Federal Bank (44.72%), IDFC (10.08%), and Cairn India (10.99%) while the largest falls were in HDFCBank (-2.22%) and LIC Housing Finance (-1.49%).
- The expiry date for the futures and options contracts is 31st October 2013.
- The Nifty futures closed at 6236.00 on Monday, a premium of 31.05 points over the spot closing of 6,204.95.
- Put call ratios for Nifty and Bank Nifty options were 1.59 and 1.06 respectively, indicating higher put open interest.
- Total futures and options turnover decreased by 17.43% on Monday compared to the previous day, with index options seeing the largest fall of 19.52%.
More from Mansukh Investment & Trading Solutions (20)
[To download this presentation, visit:
https://www.oeconsulting.com.sg/training-presentations]
This PowerPoint compilation offers a comprehensive overview of 20 leading innovation management frameworks and methodologies, selected for their broad applicability across various industries and organizational contexts. These frameworks are valuable resources for a wide range of users, including business professionals, educators, and consultants.
Each framework is presented with visually engaging diagrams and templates, ensuring the content is both informative and appealing. While this compilation is thorough, please note that the slides are intended as supplementary resources and may not be sufficient for standalone instructional purposes.
This compilation is ideal for anyone looking to enhance their understanding of innovation management and drive meaningful change within their organization. Whether you aim to improve product development processes, enhance customer experiences, or drive digital transformation, these frameworks offer valuable insights and tools to help you achieve your goals.
INCLUDED FRAMEWORKS/MODELS:
1. Stanford’s Design Thinking
2. IDEO’s Human-Centered Design
3. Strategyzer’s Business Model Innovation
4. Lean Startup Methodology
5. Agile Innovation Framework
6. Doblin’s Ten Types of Innovation
7. McKinsey’s Three Horizons of Growth
8. Customer Journey Map
9. Christensen’s Disruptive Innovation Theory
10. Blue Ocean Strategy
11. Strategyn’s Jobs-To-Be-Done (JTBD) Framework with Job Map
12. Design Sprint Framework
13. The Double Diamond
14. Lean Six Sigma DMAIC
15. TRIZ Problem-Solving Framework
16. Edward de Bono’s Six Thinking Hats
17. Stage-Gate Model
18. Toyota’s Six Steps of Kaizen
19. Microsoft’s Digital Transformation Framework
20. Design for Six Sigma (DFSS)
To download this presentation, visit:
https://www.oeconsulting.com.sg/training-presentations
Call8328958814 satta matka Kalyan result satta guessing➑➌➋➑➒➎➑➑➊➍
Satta Matka Kalyan Main Mumbai Fastest Results
Satta Matka ❋ Sattamatka ❋ New Mumbai Ratan Satta Matka ❋ Fast Matka ❋ Milan Market ❋ Kalyan Matka Results ❋ Satta Game ❋ Matka Game ❋ Satta Matka ❋ Kalyan Satta Matka ❋ Mumbai Main ❋ Online Matka Results ❋ Satta Matka Tips ❋ Milan Chart ❋ Satta Matka Boss❋ New Star Day ❋ Satta King ❋ Live Satta Matka Results ❋ Satta Matka Company ❋ Indian Matka ❋ Satta Matka 143❋ Kalyan Night Matka..
The Most Inspiring Entrepreneurs to Follow in 2024.pdfthesiliconleaders
In a world where the potential of youth innovation remains vastly untouched, there emerges a guiding light in the form of Norm Goldstein, the Founder and CEO of EduNetwork Partners. His dedication to this cause has earned him recognition as a Congressional Leadership Award recipient.
[To download this presentation, visit:
https://www.oeconsulting.com.sg/training-presentations]
This presentation is a curated compilation of PowerPoint diagrams and templates designed to illustrate 20 different digital transformation frameworks and models. These frameworks are based on recent industry trends and best practices, ensuring that the content remains relevant and up-to-date.
Key highlights include Microsoft's Digital Transformation Framework, which focuses on driving innovation and efficiency, and McKinsey's Ten Guiding Principles, which provide strategic insights for successful digital transformation. Additionally, Forrester's framework emphasizes enhancing customer experiences and modernizing IT infrastructure, while IDC's MaturityScape helps assess and develop organizational digital maturity. MIT's framework explores cutting-edge strategies for achieving digital success.
These materials are perfect for enhancing your business or classroom presentations, offering visual aids to supplement your insights. Please note that while comprehensive, these slides are intended as supplementary resources and may not be complete for standalone instructional purposes.
Frameworks/Models included:
Microsoft’s Digital Transformation Framework
McKinsey’s Ten Guiding Principles of Digital Transformation
Forrester’s Digital Transformation Framework
IDC’s Digital Transformation MaturityScape
MIT’s Digital Transformation Framework
Gartner’s Digital Transformation Framework
Accenture’s Digital Strategy & Enterprise Frameworks
Deloitte’s Digital Industrial Transformation Framework
Capgemini’s Digital Transformation Framework
PwC’s Digital Transformation Framework
Cisco’s Digital Transformation Framework
Cognizant’s Digital Transformation Framework
DXC Technology’s Digital Transformation Framework
The BCG Strategy Palette
McKinsey’s Digital Transformation Framework
Digital Transformation Compass
Four Levels of Digital Maturity
Design Thinking Framework
Business Model Canvas
Customer Journey Map
Anny Serafina Love - Letter of Recommendation by Kellen Harkins, MS.AnnySerafinaLove
This letter, written by Kellen Harkins, Course Director at Full Sail University, commends Anny Love's exemplary performance in the Video Sharing Platforms class. It highlights her dedication, willingness to challenge herself, and exceptional skills in production, editing, and marketing across various video platforms like YouTube, TikTok, and Instagram.
Starting a business is like embarking on an unpredictable adventure. It’s a journey filled with highs and lows, victories and defeats. But what if I told you that those setbacks and failures could be the very stepping stones that lead you to fortune? Let’s explore how resilience, adaptability, and strategic thinking can transform adversity into opportunity.
How are Lilac French Bulldogs Beauty Charming the World and Capturing Hearts....Lacey Max
“After being the most listed dog breed in the United States for 31
years in a row, the Labrador Retriever has dropped to second place
in the American Kennel Club's annual survey of the country's most
popular canines. The French Bulldog is the new top dog in the
United States as of 2022. The stylish puppy has ascended the
rankings in rapid time despite having health concerns and limited
color choices.”
Storytelling is an incredibly valuable tool to share data and information. To get the most impact from stories there are a number of key ingredients. These are based on science and human nature. Using these elements in a story you can deliver information impactfully, ensure action and drive change.
Top mailing list providers in the USA.pptxJeremyPeirce1
Discover the top mailing list providers in the USA, offering targeted lists, segmentation, and analytics to optimize your marketing campaigns and drive engagement.
Brian Fitzsimmons on the Business Strategy and Content Flywheel of Barstool S...Neil Horowitz
On episode 272 of the Digital and Social Media Sports Podcast, Neil chatted with Brian Fitzsimmons, Director of Licensing and Business Development for Barstool Sports.
What follows is a collection of snippets from the podcast. To hear the full interview and more, check out the podcast on all podcast platforms and at www.dsmsports.net
Profiles of Iconic Fashion Personalities.pdfTTop Threads
The fashion industry is dynamic and ever-changing, continuously sculpted by trailblazing visionaries who challenge norms and redefine beauty. This document delves into the profiles of some of the most iconic fashion personalities whose impact has left a lasting impression on the industry. From timeless designers to modern-day influencers, each individual has uniquely woven their thread into the rich fabric of fashion history, contributing to its ongoing evolution.
Digital Marketing with a Focus on Sustainabilitysssourabhsharma
Digital Marketing best practices including influencer marketing, content creators, and omnichannel marketing for Sustainable Brands at the Sustainable Cosmetics Summit 2024 in New York
Best Competitive Marble Pricing in Dubai - ☎ 9928909666Stone Art Hub
Stone Art Hub offers the best competitive Marble Pricing in Dubai, ensuring affordability without compromising quality. With a wide range of exquisite marble options to choose from, you can enhance your spaces with elegance and sophistication. For inquiries or orders, contact us at ☎ 9928909666. Experience luxury at unbeatable prices.
Best Competitive Marble Pricing in Dubai - ☎ 9928909666
Weekly market outlook 03.03.12
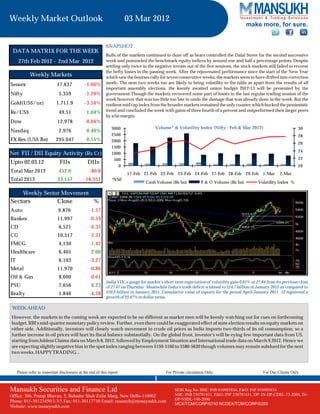
1. Weekly Market Outlook 03 Mar 2012
make more, for sure.
SNAPSHOT
DATA MATRIX FOR THE WEEK
Bulls of the markets continued to doze off as bears controlled the Dalal Street for the second successive
27th Feb 2012 - 2nd Mar 2012 week and pummeled the benchmark equity indices by around one and half a percentage points. Despite
settling only twice in the negative terrain out of the five sessions, the stock markets still failed to reverse
the hefty losses in the passing week. After the rejuvenated performance since the start of the New Year
Weekly Markets which saw the bourses rally for seven consecutive weeks, the markets seem to have drifted into correction
Sensex 17,637 -1.60% mode. The next two weeks too are likely to bring volatility to the table as apart from the results of all
important assembly elections, the keenly awaited union budget 2012-13 will be presented by the
Nifty 5,359 -1.29% government.Though the markets recovered some part of losses in the last regular trading session of the
week however that was too little too late to undo the damage that was already done in the week. But the
Gold(US$/oz) 1,711.9 -3.54% resilient mid cap index from the broader markets remained the only counter which bucked the pessimistic
Re/US$ 49.51 1.04% trend and concluded the week with gains of three fourth of a percent and outperformed their larger peers
by a fat margin.
Dow 12,978 -0.04%
3000 Volume* & Volatility Index (Nifty - Feb & Mar 2012) 30
Nasdaq 2,976 0.40%
2500 28
FX Res (US$ Bn) 295.047 0.55% 2000
26
1500
24
Net FII / DII Equity Activity (Rs Cr) 1000
500 22
Upto 02.03.12 FIIs DIIs
0 20
Total Mar 2012 452.0 -80.0 17-Feb 21-Feb 22-Feb 23-Feb 24-Feb 27-Feb 28-Feb 29-Feb 1-Mar 2-Mar
Total 2012 33,157 -18,351 *NSE
Cash Volume (Rs bn) F & O Volume (Rs bn) Volatility Index %
Weekly Sector Movement
Sectors Close %
Auto 9,876 -1.57
Bankex 11,997 -0.59
CD 6,521 -0.35
CG 10,317 -2.31
FMCG 4,130 -1.42
Healthcare 6,405 2.00
IT 6,103 -3.27
Metal 11,970 -0.86
Oil & Gas 8,600 -0.61
India VIX, a gauge for market's short term expectation of volatility gain 0.61% at 27.84 from its previous close
PSU 7,656 0.23 of 27.67 on Thursday. Meanwhile India's trade deficit widened to $14.7 billion in January 2012 as compared to
Realty 1,846 -4.28 $10.3 billion in January 2011. Cumulative value of exports for the period April-January 2011 -12 registered a
growth of 23.47% in dollar terms.
WEEK AHEAD
However, the markets in the coming week are expected to be no different as market men will be keenly watching out for cues on forthcoming
budget, RBI's mid-quarter monetary policy review. Further, even there could be exaggerated effect of state election results on equity markets on
either side. Additionally, investors will closely watch movement in crude oil prices as India imports two-thirds of its oil consumption, so a
further increase in oil prices will hurt its fiscal balance substantially. On the global front, investor's will be eying few important data from US,
starting from Jobless Claims data on March 8, 2012, followed by Employment Situation and International trade data on March 9,2012. Hence we
are expecting slightly negative bias in the spot index ranging between 5150-5160 to 5580-5630 though volumes may remain subdued for the next
two weeks. HAPPY TRADING...
Please refer to important disclosures at the end of this report For Private circulation Only For Our Clients Only
1
Mansukh Securities and Finance Ltd SEBI Reg.No: BSE: INB 010985834, F&O: INF 010985834
Office: 306, Pratap Bhavan, 5, Bahadur Shah Zafar Marg, New Delhi-110002 NSE: INB 230781431, F&O: INF 230781431, DP: IN-DP-CDSL-73-2000, IN-
DP-NSDL-140-2000
Phone: 011-30123450/1/3/5 Fax: 011-30117710 Email: research@moneysukh.com
MCX/TCM/CORP/0740 NCDEX/TCM/CORP/0293
Website: www.moneysukh.com
4. Weekly Market Outlook
make more, for sure.
FORTHCOMING CORPORATE ACTIONS
Ex-Date Company Name NSE- Symbol Purpose
6-Mar-12 Bharat Heavy Electricals Limited BHEL INTERIM DIVIDEND RS.2.72 PER SHARE
7-Mar-12 Standard Chartered PLC STAN DIVIDEND
7-Mar-12 Bharat Forge Limited BHARATFORG INTERIM DIVIDEND
9-Mar-12 GlaxoSmithKline Consumer Healthcare Ltd GSKCONS AGM AND DIVIDEND RS.35/- PER SHARE
9-Mar-12 The Andhra Pradesh Paper Mills Limited APPAPER ANNUAL GENERAL MEETING
9-Mar-12 Goldman Sachs Nifty Exchange Traded S NIFTYBEES DIVIDEND-RS.10 PER UNIT
9-Mar-12 Goldman Sachs Banking Index Exchange TS BANKBEES DIVIDEND-RS.11 PER UNIT
12-Mar-12 ACC Limited ACC DIVIDEND RS.17/- PER SHARE
13-Mar-12 K.M.Sugar Mills Limited KMSUGAR ANNUAL GENERAL MEETING
13-Mar-12 Eicher Motors Limited EICHERMOT DIVIDEND-RS.16 PER SHARE
13-Mar-12 CRISIL Limited CRISIL DIVIDEND - RS. 2.75/- PER SHARE
13-Mar-12 KPIT Cummins Infosystems Limited KPIT BONUS 1:1
14-Mar-12 Spanco Limited SPANCO AGM/ DIVIDEND RE. 1/- PER SHARE
15-Mar-12 Kewal Kiran Clothing Limited KKCL 2ND INTERIM DIVIDEND RS.6/- PER SHARE
15-Mar-12 Coal India Limited COALINDIA INTERIM DIVIDEND
16-Mar-12 Gujarat Gas Company Limited GUJRATGAS SPECIAL DIVIDEND - RS. 12/- PER SHARE
19-Mar-12 Modi Rubber Limited MODIRUBBER ANNUAL GENERAL MEETING
19-Mar-12 Oil & Natural Gas Corporation Limited ONGC INTERIM DIVIDEND
20-Mar-12 TVS Motor Company Limited TVSMOTOR INTERIM DIVIDEND
21-Mar-12 Foseco India Limited FOSECOIND AGM AND DIVIDEND RS.7/- PER SHARE
21-Mar-12 Helios And Matheson Information Tech Ltd HELIOSMATH AGM AND DIVIDEND RS.1.50 PER SHARE
21-Mar-12 Nestle India Limited NESTLEIND AGM AND DIVIDEND - RS.12.50/- PER SHARE
21-Mar-12 Lakshmi Energy and Foods Limited LAKSHMIEFL AGM AND DIVIDEND RE.0.20 PER SHARE
22-Mar-12 Colgate Palmolive (India) Limited COLPAL INTERIM DIVIDEND
26-Mar-12 KSB Pumps Limited KSBPUMPS AGM AND DIVIDEND RS.3/- PER SHARE
4
Mansukh Securities and Finance Ltd SEBI Reg.No: BSE: INB 010985834, F&O: INF 010985834
Office: 306, Pratap Bhavan, 5, Bahadur Shah Zafar Marg, New Delhi-110002 NSE: INB 230781431, F&O: INF 230781431, DP: IN-DP-CDSL-73-2000, IN-
DP-NSDL-140-2000
Phone: 011-30123450/1/3/5 Fax: 011-30117710 Email: research@moneysukh.com
MCX/TCM/CORP/0740 NCDEX/TCM/CORP/0293
Website: www.moneysukh.com
5. Weekly Market Outlook
make more, for sure.
EQUITY CALLS PERFORMANCE FOR THE WEEK ENDED 2nd Mar 2012
Total No. of Calls Profitable Calls Positional/Hold Exit/Stop Loss Success Rate
25 14 6 5 73.68%
NAME DESIGNATION E-MAIL
Varun Gupta Head - Research varungupta@moneysukh.com
Pashupati Nath Jha Research Analyst pashupatinathjha@moneysukh.com
Vikram Singh Research Analyst vikram_research@moneysukh.com
This report is for the personal information of the authorized recipient and does not construe to be any investment, legal or taxation advice to you. Mansukh
Securities and Finance Ltd (hereinafter referred as MSFL) is not soliciting any action based on it. This report is not for public distribution and has been
furnished to you solely for your information and should not be reproduced or redistributed to any person in any form.
The report is based upon information that we consider reliable, but we do not represent that it is accurate or complete. MSFL or any of its affiliates or
employees shall not be in any way responsible for any loss or damage that may arise to any person from any inadvertent error in the information contained
in this report. MSFL or any of its affiliates or employees do not provide, at any time, any express or implied warranty of any kind, regarding any matter
pertaining to this report, including without limitation the implied warranties of merchantability, fitness for a particular purpose, and non-infringement.
The recipients of this report should rely on their own investigations.
MSFL and/or its affiliates and/or employees may have interests/positions, financial or otherwise in the securities mentioned in this report. This
information is subject to change without any prior notice. MSFL reserves the right to make modifications and alterations to this statement as may be
required from time to time. Nevertheless, MSFL is committed to providing independent and transparent recommendations to its clients, and would be
happy to provide information in response to specific client queries.
5
Mansukh Securities and Finance Ltd SEBI Regn No. BSE: INB010985834 / NSE: INB230781431
SEBI Reg.No: BSE: INB 010985834, F&O: INF 010985834
Office: 306, Pratap Bhavan, 5, Bahadur Shah Zafar Marg, New Delhi-110002 NSE: INB 230781431, F&O: INF 230781431, DP: IN-DP-CDSL-73-2000, IN-
PMS Regn No. INP000002387
DP-NSDL-140-2000
Phone: 011-30123450/1/3/5 Fax: 011-30117710 Email: research@moneysukh.com
MCX/TCM/CORP/0740 NCDEX/TCM/CORP/0293
Website: www.moneysukh.com