Download as PDF, PPTX

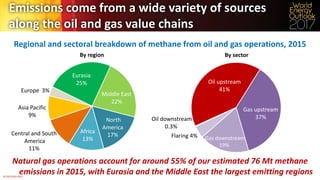
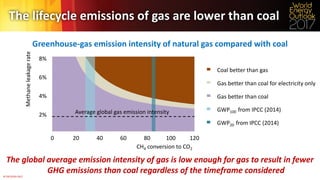
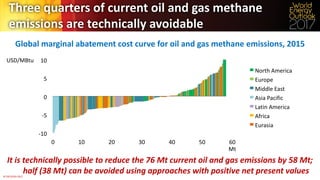
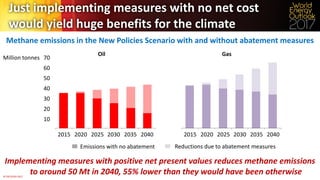

The document discusses the environmental impact of methane emissions from oil and gas operations, highlighting that natural gas contributes minimally to overall energy-related emissions but methane emissions present significant uncertainties. It emphasizes that a large portion of these emissions is technically avoidable, and implementing cost-effective measures could substantially reduce emissions by 2040. The findings indicate that addressing methane emissions could yield climate benefits comparable to shutting down all coal-fired power plants in China.