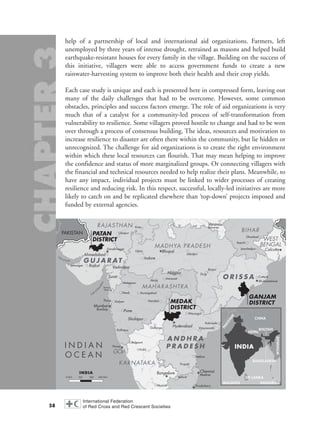
The document summarizes the 2004 World Disasters Report, which focuses on building community resilience. It discusses how communities can better cope with and recover from disasters by strengthening local capacities and self-reliance. Case studies from countries like India, Iran, and the Philippines show how participatory approaches that engage communities in disaster risk reduction and response planning can increase resilience. The report also examines threats like disease outbreaks, environmental hazards, and urban poverty that undermine resilience, and ways to help communities manage these risks.

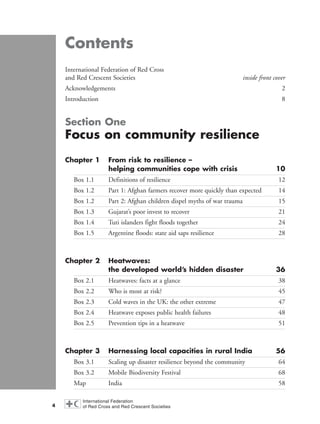
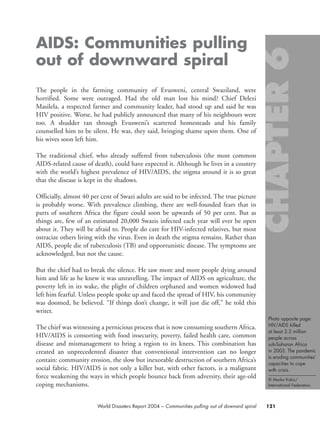
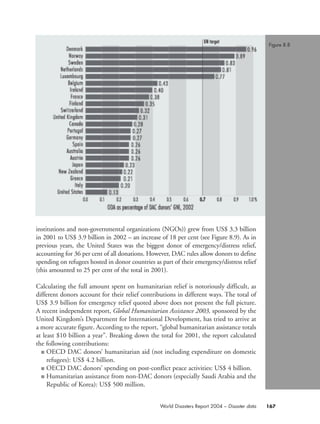
![of greenhouse gases in the Earth’s atmosphere, average summer temperatures in
central Europe will be around 4.6°C higher at the end of the century.”
Another factor, more important than an average rise in temperature, will be the
increase in temperature variability. As Schär says, “The past two summers were very
different. While drought was very widespread last year, floods grabbed the headlines
in the summer of 2002. According to our results the standard variation of summer
temperatures in central Europe will increase by up to 100 per cent. This means that
towards the end of the century the climate in summer will be extremely different from
year to year.”
The kind of uncertain climate that Schär predicts would cause major problems for
central Europe in particular. “In principle one can become accustomed to a warmer
climate if it’s more or less constant. Farmers, for example, can cultivate other plants
that do well in a warmer climate,” he says. “But if mean temperatures become erratic
and change greatly from one year to the next, it can be far more difficult to adjust to
the unpredictable conditions.”
Is the future already here? Thomas Loster, a geographer and expert in weather-related
losses with Munich Re, explains: “We used to talk in terms of floods and heatwaves
being one-in-100-year events, but in the south of France this year [2003] we have had
a one-in-100-year heatwave, and in December one-in-100-year floods – all in the
same year. This is climate change happening now and a big headache for the insurance
industry.” He adds: “The summer of 2003, with its extensive losses, is a glimpse into
the future, a ‘future summer’.”
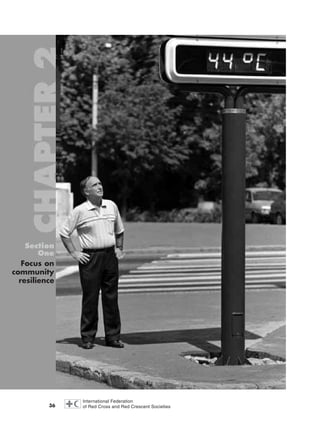
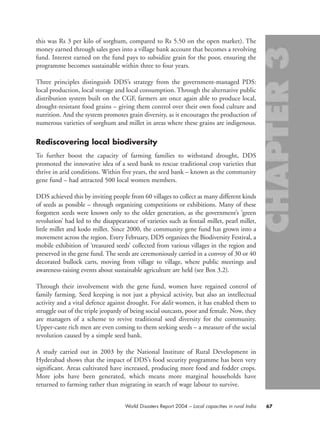
Europe bakes and burns
Sudden variations in temperature can prove more deadly than sustained heat, as the
human body needs time to acclimatize. “A heatwave is a very relative factor,” explains
Laurence S. Kalkstein, a climatologist at the University of Delaware Center for
Climatic Research, in an interview with the New York Times. A heatwave in Riyadh,
Saudi Arabia is different from a heatwave in London. As Dr Kalkstein points out: “We
respond to the normal weather conditions of wherever we live.”
A heatwave is a deviation from average temperatures. According to Kalkstein, people
living in areas with occasional but intense variability – like Paris or New York, where
summer and winter temperatures can change significantly in a few days – suffer more
than in places like Miami or Rio de Janeiro, where the weather is warmer but with
fewer fluctuations.
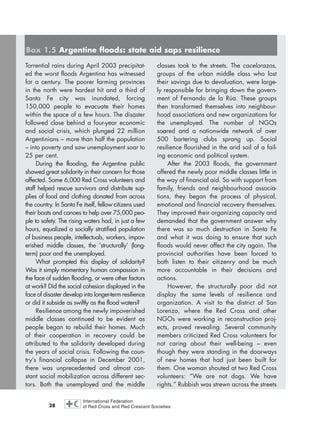
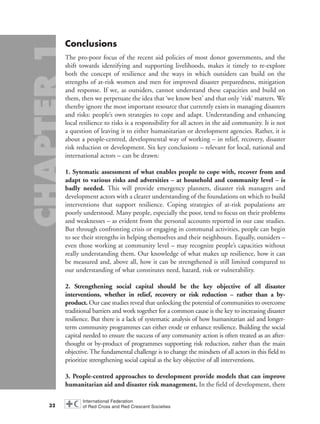
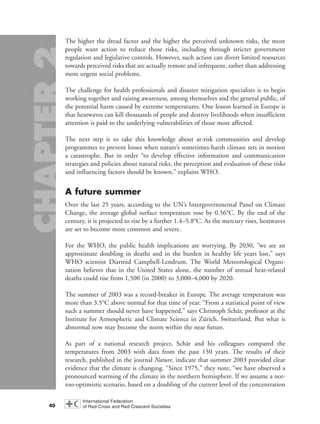
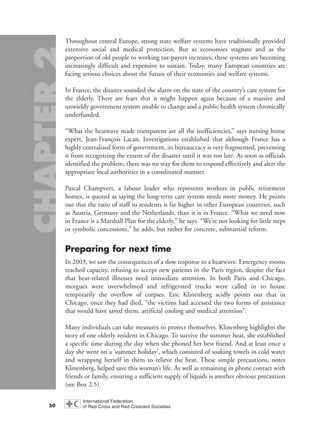
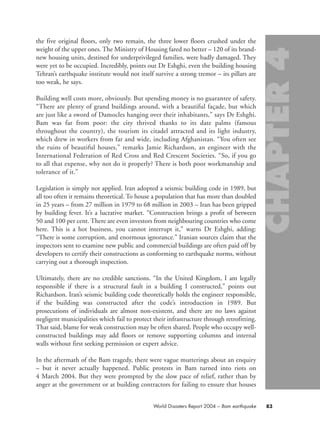
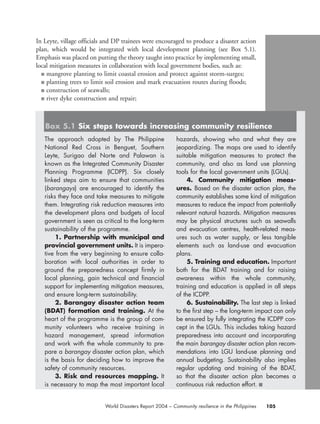
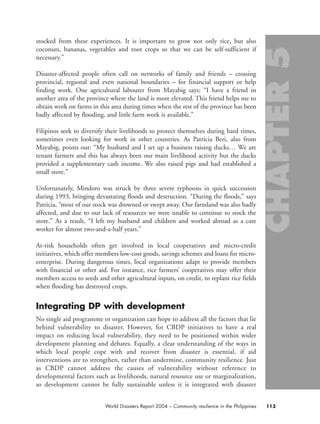
It does not take a lot of extra heat to kill the vulnerable. In extreme heat, the body
maintains its temperature of 37°C by circulating blood to the skin and perspiring.
41World Disasters Report 2004 – Heatwaves
chap02 16.8.2004 10:40 Page 41](https://image.slidesharecdn.com/wdr-2004-130731042145-phpapp02/85/Wdr-2004-42-320.jpg)
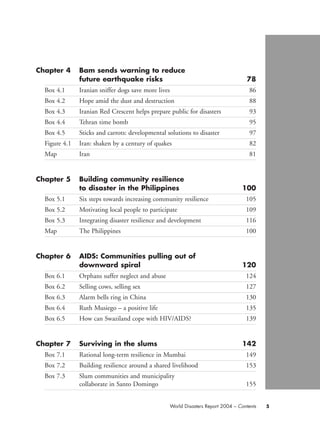
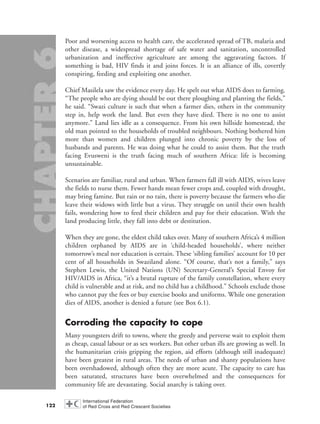
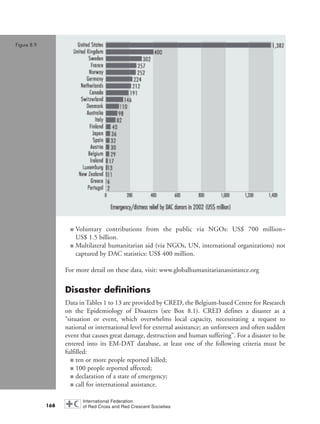
![enough flat roof space to build a green roof almost the size of Brooklyn’s Prospect
Park. This, say the project leaders, could form “a huge heat-absorbing sponge of
roughly 500 acres [200 hectares], all at roof height”.
However, while climate scientists debate what impacts climate change will have,
where and when, it is crucial to view heatwaves as more than simply a climate issue.
They are first and foremost a health and care issue. As Eric Klinenberg explains:
“Heatwaves are like urban particle accelerators. They speed up and make visible
conditions that are always there but are difficult to perceive. Living and dying alone
is one of those conditions.” The social ecology of an urban area often has a far greater
impact on death rates than the effect of physical structures.
In his study of the Chicago heatwave of 1995, Klinenberg found that not all urban
communities suffered equally. One poor neighbourhood, with a high percentage of
violence and abandoned buildings, had a death rate ten times higher than that of a
similarly poor adjacent area (with the same proportion of elderly, solitary residents),
which had a more active street life. “The areas of the city that had high concentrations
of deaths are areas that had lost the viable public spaces, the busy sidewalks, the
commercial streets,” Dr Klinenberg says. “Those are the things that draw people out
of the home and into social contact.”
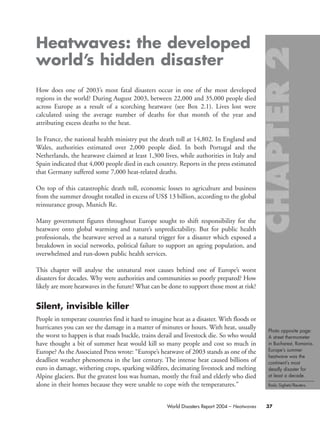
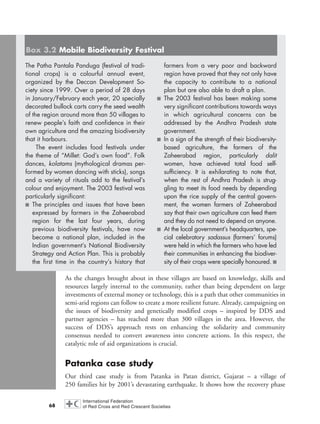
Isolated elderly suffer most
Those worst affected by heatwaves live in urban areas, and for complex and often
different reasons, elderly people tend to make up the bulk of them. In many cases,
they are likely to be disproportionately invisible to researchers and aid workers alike,
rarely willing or able to call much attention to their plight. As proof of this, a study
of the 1995 Chicago heatwave confirmed that those people most at risk were in
poor health, unable to care for themselves, isolated and lacking air-conditioning
(see Box 2.2).
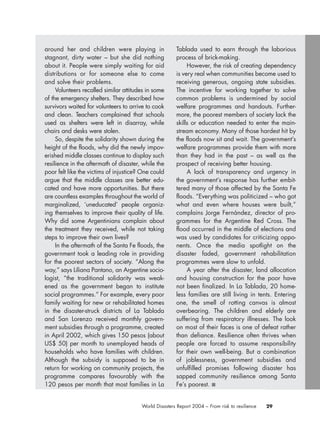
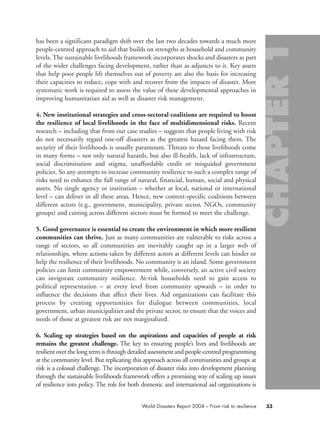
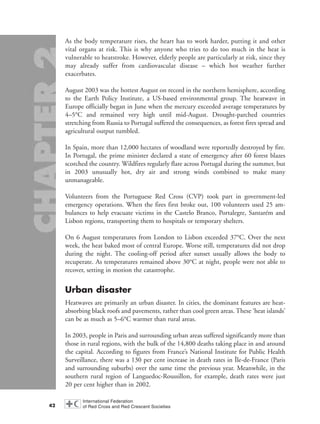
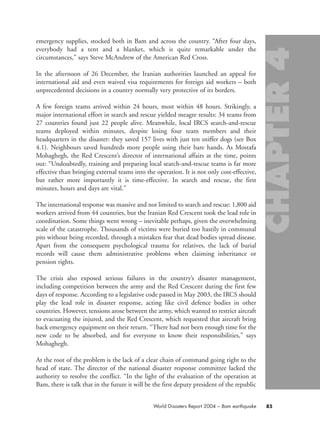
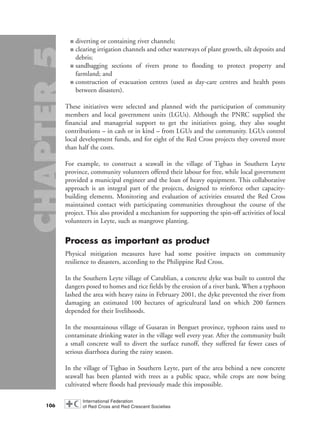
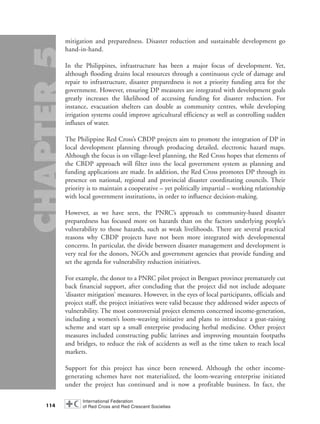
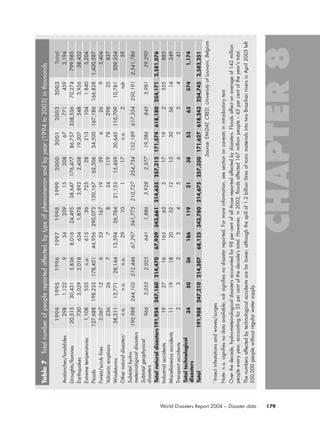
The 2003 heatwave in France affected primarily those over 75 years of age, who
accounted for 70 per cent of the 14,802 deaths. But the 45- to 74-year-old age group
also suffered, accounting for 30 per cent of deaths. Women died in higher proportions
than men, as they form the largest part of this population group. But in most studies
on heatwaves, gender has little impact on who is at risk.
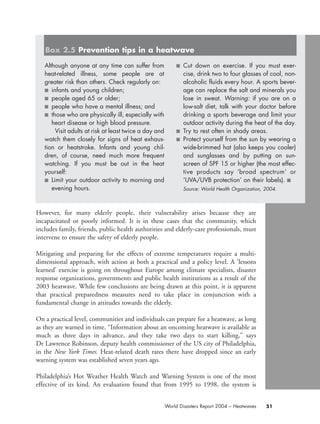
Researchers from other countries have confirmed the high vulnerability of the elderly
to heatwaves. The National Institute of Environmental Health in Hungary studied
heatwaves in Budapest from 1993 to 2000. They found that mortality was highest
among the population aged over 75 years. And in Chicago in 1995, government
authorities indicated that 73 per cent of the 739 heat-related victims were older than
65 years. In contrast to Europe, men in the Chicago heatwave were more than twice
44
chap02 16.8.2004 10:40 Page 44](https://image.slidesharecdn.com/wdr-2004-130731042145-phpapp02/85/Wdr-2004-45-320.jpg)
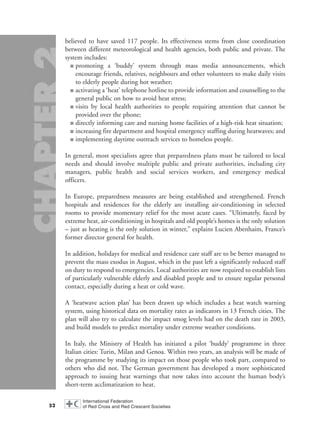
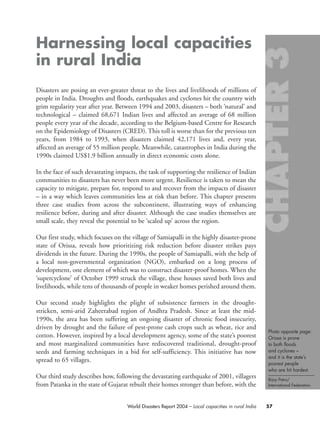
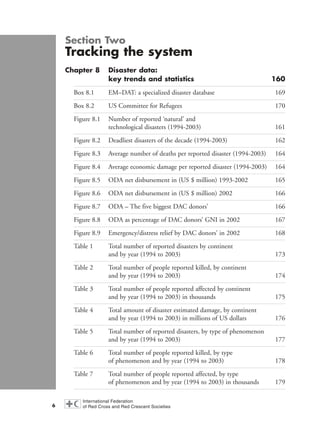
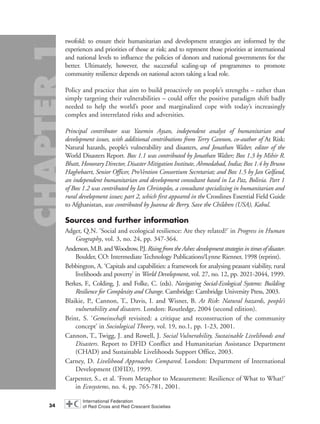
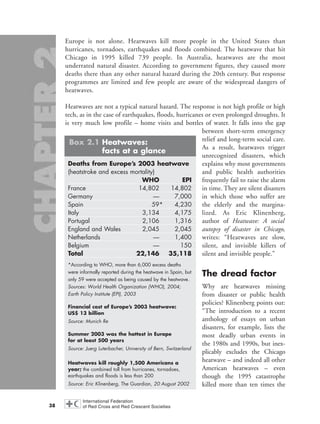
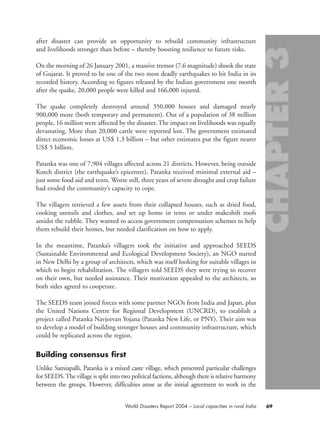
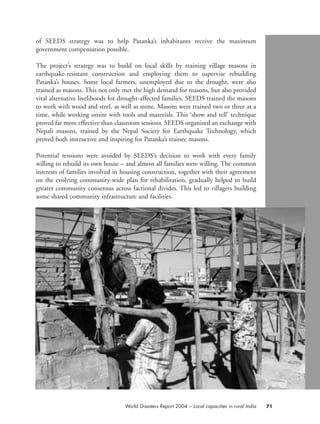
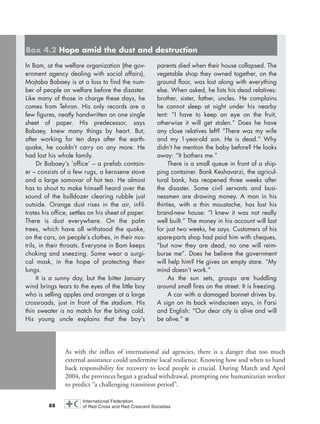
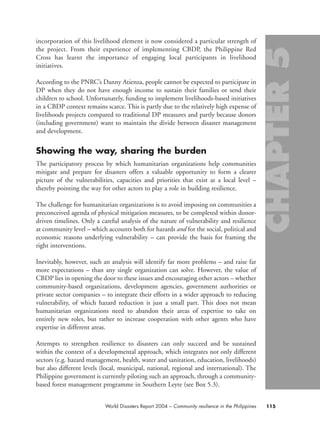
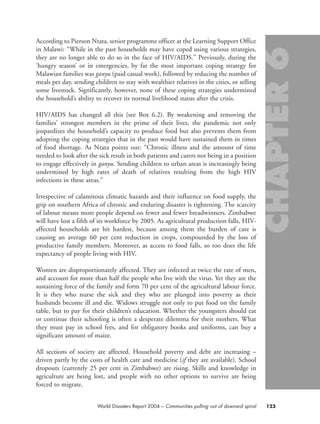
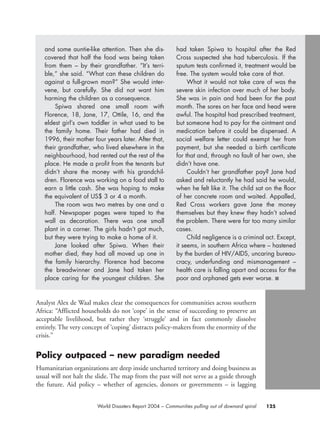
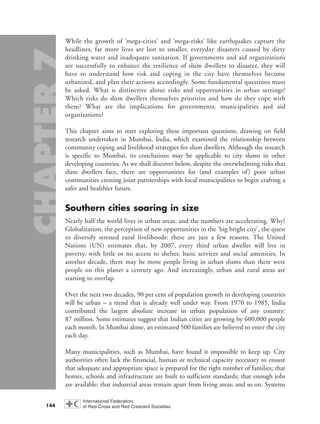
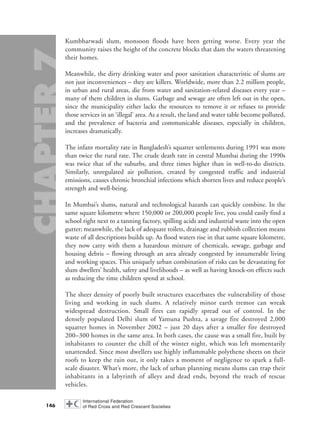
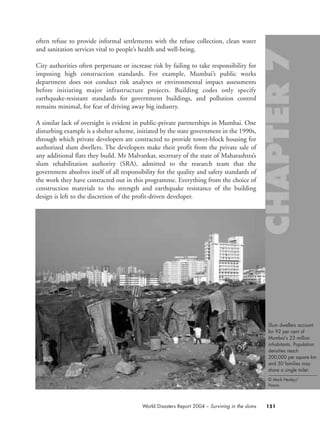
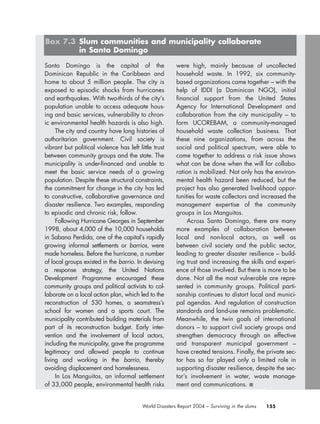
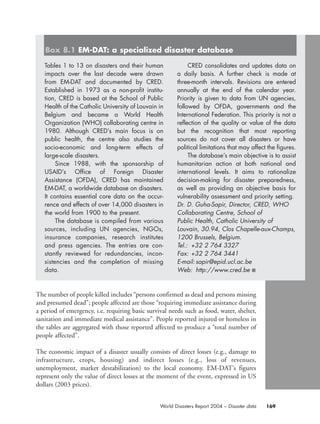
![Many farmers, who took out loans to cover the high costs of inputs necessary for
cash crops, have become bankrupt as their crops fail to grow or sell well. Suicides
among Andhra Pradesh’s 12 million farmers have been rising. Trapped by debt
and driven by despair, an estimated 4,000 to 5,000 farmers have killed
themselves across the state in the last six years, according to P. Chengala Reddy,
honorary chairperson of Andhra Pradesh’s Federation of Farmers Associations.
“While the suicides in the past were confined to a few districts and regions, this
year every district is witnessing the deaths,” said Reddy during an interview in
May 2004.
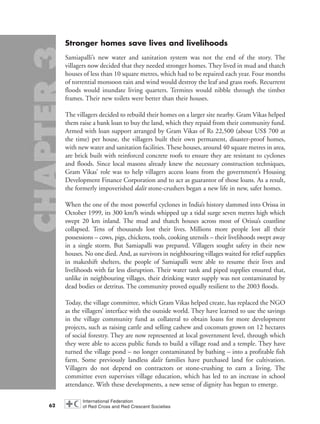
65World Disasters Report 2004 – Local capacities in rural India
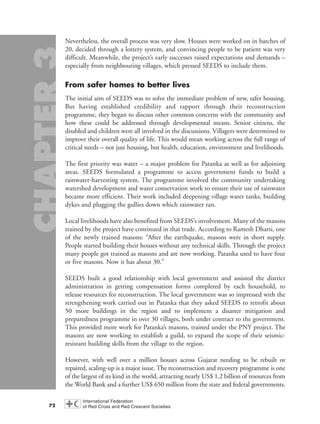
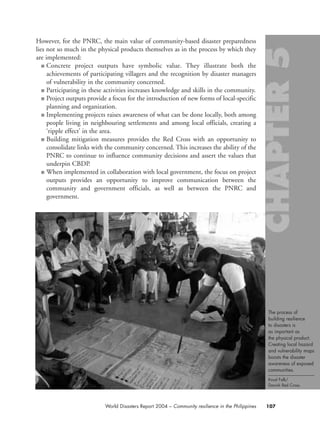
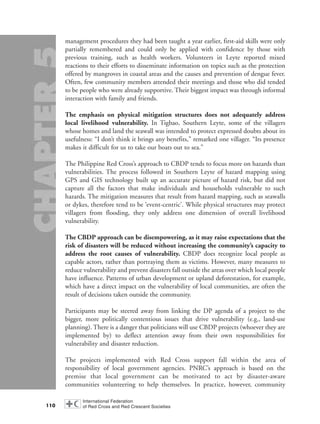
The second batch to undergo training includ-
ed 200 trainees from 40 villages in four dis-
tricts. Community commitment to the DMTFs is
strong, as villagers already recognize the
value of their existing village development
committees. Moreover, memories of 1999’s
devastating cyclone are still fresh.
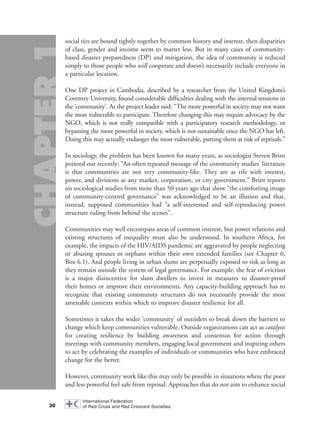
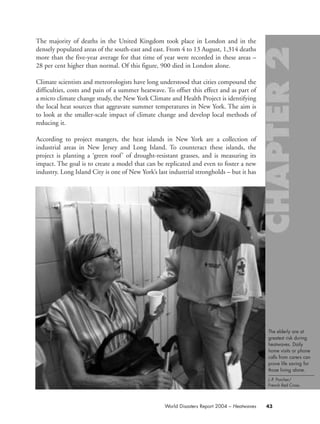
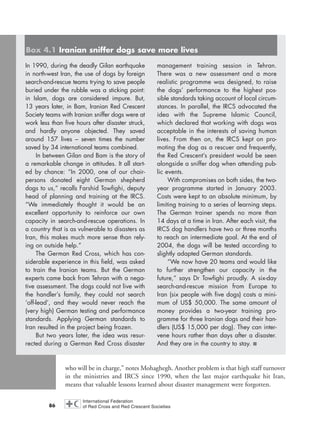
During the floods of 2003, task force mem-
bers were key to ensuring that possible
embankment breach points were sandbagged,
stranded people were rescued, first aid was
administered and the shelters, which were con-
structed following the 1999 disaster, were
effectively managed. As Birabar Mohapatra of
Khursia village in Kendrapara district says:
“Children of my village have saved me and my
family, otherwise in the last flood we wouldn’t
even have got the dry food.”
Building on the success of the task forces
in Orissa, CASA, with support from Britain’s
Department for International Development,
promoted DMTFs as an integral part of their
flood rehabilitation programme in the neigh-
bouring state of West Bengal. As a result,
DMTFs now play a key role in 110 villages
across the 22 catchment areas of the pro-
gramme.
From the success at village level demon-
strated by CASA, the value of DMTFs has
been widely recognized. They now form an
important part of community-based disaster
management initiatives implemented by the
United Nations Development Programme
(UNDP), notably in its recently completed
Orissa pilot project working with 1,603 vil-
lages in ten blocks to create community con-
tingency plans and mitigation solutions
through participatory risk assessment and
mapping.
UNDP’s aim was “to reduce social, eco-
nomic and physical vulnerabilities” by pro-
moting “disaster preparedness as a socio-
economic development process to prevent
loss of development gains and to empower
the community with appropriate skills and
access to all development institutions”. In
order to organize and systematize disaster
response at the local level, UNDP trained dis-
aster management committees and task
forces not only within communities but also at
higher administrative levels.
According to a recent impact assessment
study: “The [UNDP] project has been suc-
cessful in putting disaster preparedness on
the agenda of local government and the
Panchayati Raj Institutions (PRIs)… [it] has
built capacity in disaster preparedness and in
the integration of disaster management into
the development programming process at the
Block and Gram Panchayat levels to support
disaster preparedness and mitigation at the
community level.” ■
chap03 16.8.2004 10:51 Page 65](https://image.slidesharecdn.com/wdr-2004-130731042145-phpapp02/85/Wdr-2004-66-320.jpg)
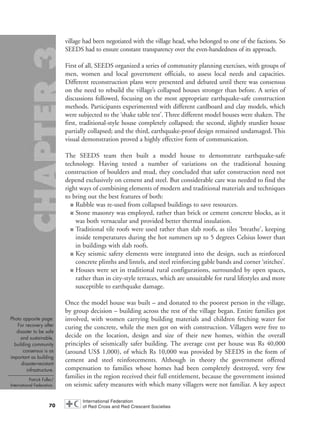
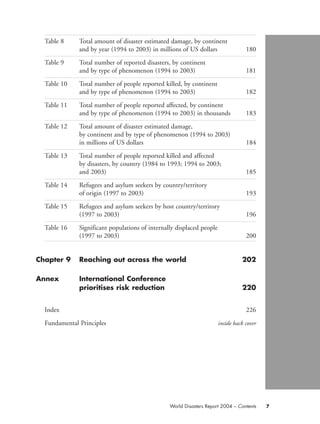
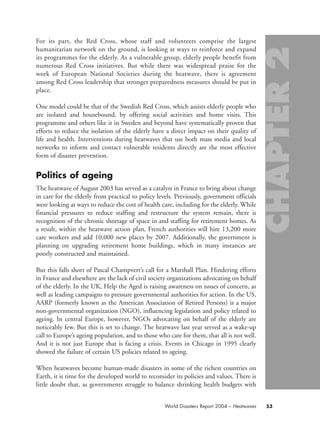
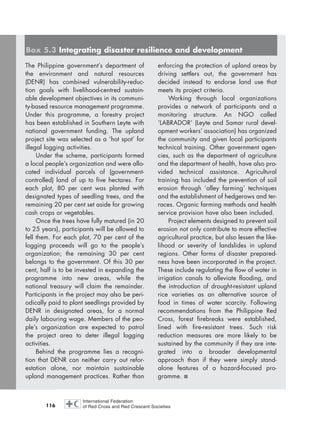
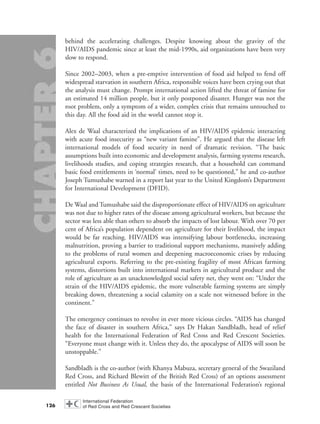
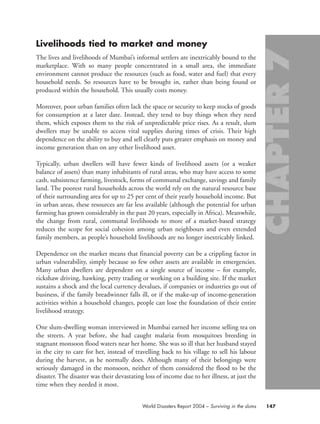
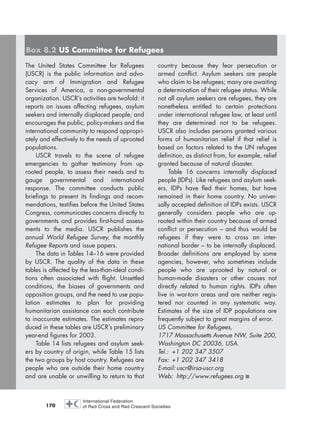
![were earthquake-proof in the first place. This reveals a lack of awareness among
many Bam inhabitants of the systemic weaknesses that caused the disaster.
Lack of disaster awareness may in turn fuel or feed off a wider sense of fatalism.
According to Dr Eshghi: “Nobody thinks this is an earthquake country! We live
outwardly in a modern style, but we think in a fatalistic way. Maybe it [fatalism] is
linked to religion, but it is wrong: God is merciful! Our religious people should
remind the population of this.”
It should be said that fatalism is common in many other countries – including the
West. Psychologically, it is an attitude that helps at-risk or traumatized populations to
accept the status quo, rather than taking responsibility (to mitigate the risk) or blame
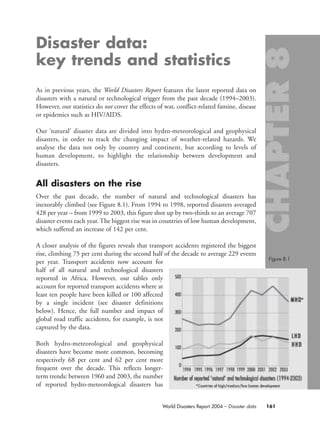
(for not doing more to mitigate the risk) upon their own shoulders. Fatalism may also
help people, who are unaware of the technical reasons for structural failure, to explain
why some buildings survive a quake while other apparently similar buildings nearby
collapse.
In a highly centralized country like Iran, a strong government has, in principle, the
capability to enforce building codes, fight corruption and spread disaster awareness, if
it so chooses. Given Iran’s history of devastating earthquakes, why weren’t more
measures taken to reduce the risk? Dr Eshghi suggests that perhaps part of the fault
lies with people like himself: “We have failed to communicate to the public in a
proper way,” he says. Wherever the blame lies, a lethal combination of ignorance,
fatalism and greed conspired with the forces of nature beneath Bam to create a
massive disaster.
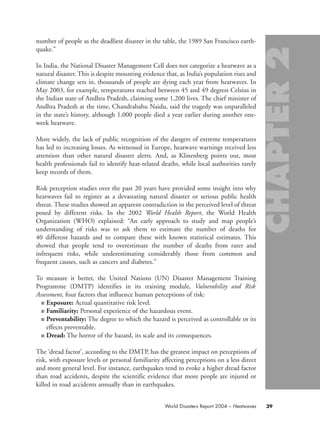
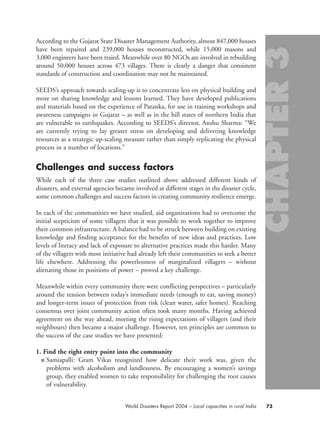
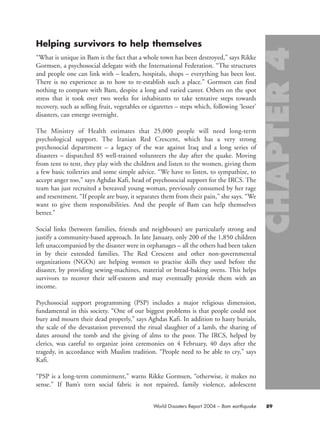
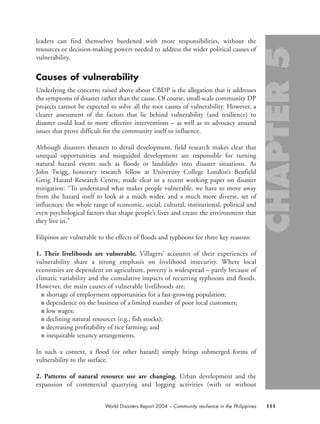
Iranians lead disaster response
On the morning of 26 December 2003, Bam found itself deprived of water, electricity
and all means of communication with the outside world. Its government structures
were destroyed, its streets littered with corpses. Nearly half the doctors and nurses
were dead and not a single medical centre was left to take in the injured. At night,
temperatures fell to freezing.
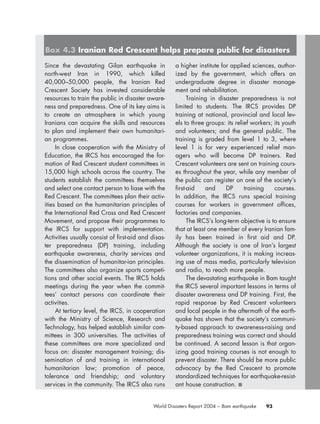
Barely two hours after the quake, the first Iranian Red Crescent teams arrived by road
from Kerman, 190 km away. The army followed. By the afternoon, the airport was
again operational, thanks to three mobile control towers. Around 10,000 seriously
injured people were evacuated – by air or overland – to 72 hospitals throughout the
country. Enormous traffic jams built up, as thousands of citizens from outside Bam
responded to the appeal of Kerman’s governor and rushed in to help.
Around 8,500 Red Crescent staff and volunteers – trained and experienced in disaster
response – were deployed. Survivors’ most pressing needs were met by IRCS
84
chap04 16.8.2004 10:42 Page 84](https://image.slidesharecdn.com/wdr-2004-130731042145-phpapp02/85/Wdr-2004-85-320.jpg)
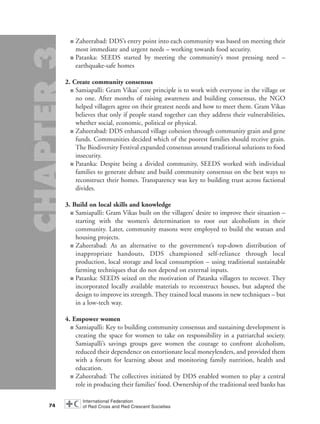
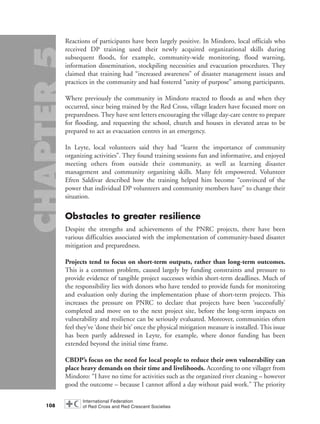
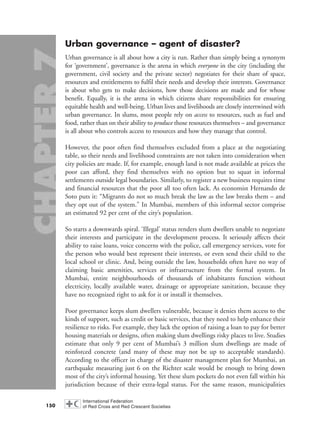
![its destroyed offices. The Swiss Agency for Development and Cooperation has a
construction training project which aims to “restore the links between theory and
practice”. Its representative in Bam, Tom Schacher, insists on “using local technology,
i.e. bricks and concrete, so that people can carry on the day we’re no longer here”. The
Swiss aim to publish an easily understandable, illustrated building manual for
Iranians.
Meanwhile, the World Bank aims at targeting US$ 140 million of its US$ 300 million
loan at reconstructing domestic housing and commercial buildings “with improved
standards and less vulnerability to future earthquakes”. The Bank points out that
one of the major benefits of its proposed loan will be to provide “training on
self-construction and quality assurance [which] will enhance the confidence of the
population to deal with natural disasters”.
The Bank has also set aside US$ 15 million of its loan for disaster preparedness in
Kerman province. This would finance the retrofitting of essential infrastructure
such as hospitals, local administration buildings and emergency stores to resist
earthquakes, as well as to buy emergency search-and-rescue equipment for the
province.
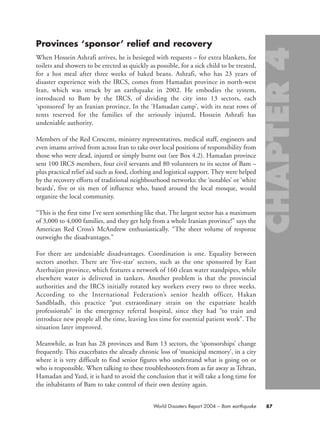
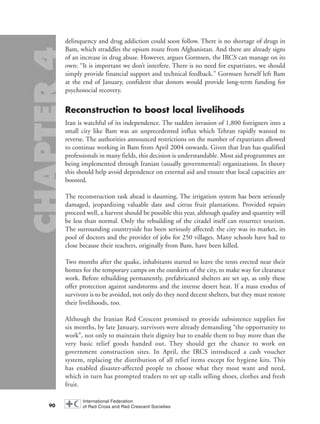
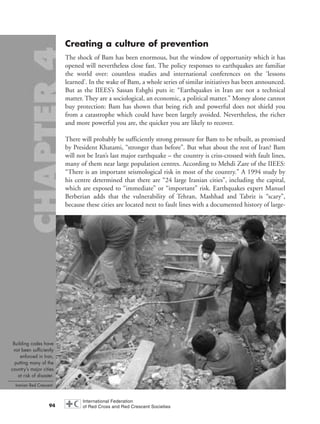
The IRCS has had an ambitious programme of awareness-raising and disaster
preparedness for several years (see Box 4.3). They conduct emergency drills three
times a year in public places such as town squares and parks. Through its provincial
branches, the Red Crescent is able to provide children and young adults in almost
every school and university across the country with courses in disaster awareness and
preparedness. The courses include training on first aid, how to evacuate the injured,
and immediate actions in the event of fire or earthquake. The IRCS also uses
television and radio media to get its messages across. The programme has already
reached 3 million Iranians. Ultimately the aim is to train one person per family. “We
can and should do more,” asserts Farshid Towfighi, the deputy head of planning and
training at the IRCS. “After all, it is our mandate. Disasters like this one will happen
again.”
The IRCS had conducted community-based disaster preparedness (CBDP)
training at their youth centre in Bam before the earthquake struck. When asked
how those who were trained had fared in the earthquake, the Red Crescent’s
Hassan Esfandira said: “The situation was very chaotic and many people that had
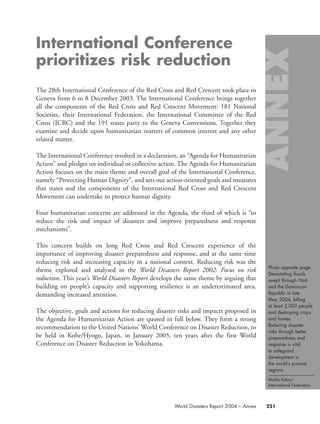
been trained for an emergency had actually been killed. But yes, those who had
been trained for rescue performed better than others, especially for rescuing their
families.” Clearly, in the event of a quake as massive as Bam’s, CBDP alone is not
enough to protect lives. A complete transformation of building practices is
required. Nevertheless, the role of CBDP in spreading disaster awareness is a very
valuable start.
92
chap04 16.8.2004 10:43 Page 92](https://image.slidesharecdn.com/wdr-2004-130731042145-phpapp02/85/Wdr-2004-93-320.jpg)
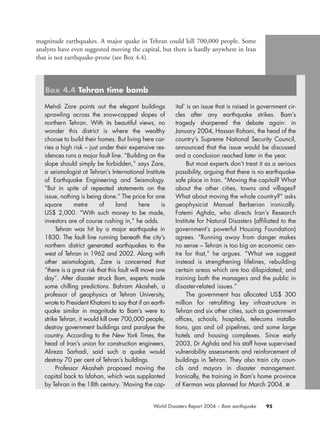
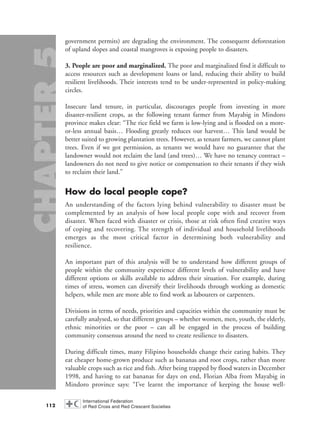
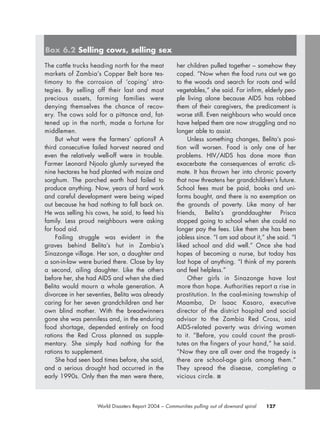
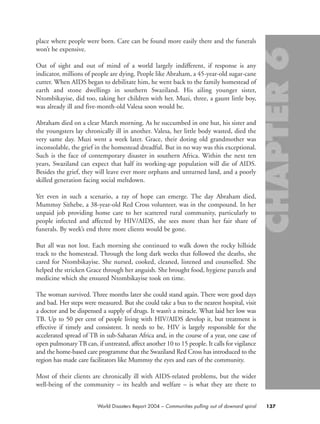
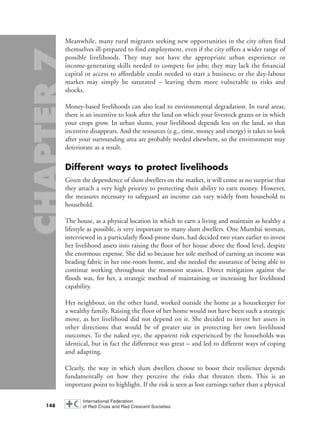
![protect. The provision of health education is part of it, whether on HIV or hygiene.
The care programme is centred on a clinic in the small community of Silele, which
serves ten districts in a radius of 40 kilometres. Importantly, the home care is linked
to targeted food distribution and much-needed water and sanitation programmes.
“Most people have no latrines,” said water and sanitation officer Mduduzi Nkonyane.
“People defecate in the bush. They do not cover their faeces and do not wash their
hands because water isn’t close. When it rains the faeces are washed into the rivers.
People drink from the rivers, the water is dirty, it is kept in dirty containers and
nothing is done to purify it. Often homesteads do not have refuse pits. You find cow
dung all over the yard. Food like vegetables isn’t washed before cooking or eating and
flies are everywhere.”
Nkonyane was busy changing things. In the hills close by, streams were fed into
filtration and purification tanks and a pipeline carried water down to the clinic. A
mountain of coiled pipe revealed other plans: to take the clean water into hundreds
of homesteads. The digging of trenches had started. It was the first such project in the
area and other communities were interested – evidence that health information
campaigns were paying dividends.
But other needs loomed – agricultural, infrastructural – and given community
momentum, it was time for new partners to step in and support the Red Cross. If it
is the coping capacity of the whole community that needs to be strengthened, not
simply that of the most vulnerable, who would be the partners?
According to Milly Katana, a member of the Commission on HIV/AIDS and
Governance in Africa (established last year by UN Secretary-General Kofi Annan):
“In Africa it’s only governments that have the capacity to do things [nationally]. The
NGOs have good intentions, but their capacity just cannot match the needs.” For its
part, Swaziland’s government has taken some proactive steps to combat the pandemic
(see Box 6.5).
Build response on local resilience
The HIV/AIDS pandemic has exposed a weak link in the chain of international aid
– the link between relief and development. The colossal US$ 600 million intervention
during 2002–2003 to provide 14 million people across sub-Saharan Africa with food
aid was hailed as a successful new form of pre-emptive humanitarian action. Yet it
achieved little more than deferring death. At worst, it sent the wrong signal to the
international community that ‘disaster’ was averted – when in fact, an ongoing,
chronic disaster continues day in, day out across the continent. Last year, AIDS
claimed over 3 million victims worldwide, according to UNAIDS, of whom between
2.2 million and 2.4 million died in sub-Saharan Africa alone.
138
chap06 16.8.2004 10:45 Page 138](https://image.slidesharecdn.com/wdr-2004-130731042145-phpapp02/85/Wdr-2004-139-320.jpg)
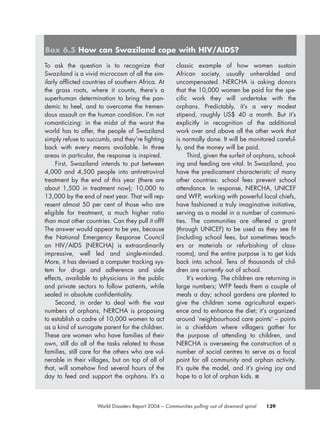
![author of The vulnerability of cities, points out: “The municipality is a democratically
governed body, which many [organizations] in civil society are not.”
“Now we’re unstoppable”
Where this support to municipalities has been tried, there have been some promising
results. For example, the Slum Sanitation Programme in Greater Mumbai was created
in 1997 to provide a number of slum pockets with proper sanitation facilities. The
critical state of health among some of the city’s more crowded slums made the
intervention an urgent priority. The programme sought to introduce a community-
based approach to toilet provision, which was different from anything previously
attempted.
The World Bank sponsored the building of the physical infrastructure, while local
community-based organizations (CBOs) took responsibility for the ownership,
administration and management of the facilities. During the process of planning and
construction, the municipality helped enhance the CBOs’ administration and
management skills, based on the needs and capacities of each individual group. The
municipality also supported the development of the project design, the user payment
scheme and the management strategy, according to the particular needs of each
community.
The toilets are now administered by CBOs on a pay-per-use or monthly fee basis.
Unlike municipality-owned facilities, the money never leaves the community. Any
funds left over from repairs and upkeep are reinvested into the neighbourhood,
through new or ongoing local projects of the community’s choosing.
A similar grass-roots approach was adopted with the Slum Adoption Scheme, which
aims to tackle the chronic problems of garbage and waste matter contaminating
Mumbai’s slums, exacerbating flood and fire risks, and contributing to chronic ill-
health. In this scheme, each household pays a local CBO a certain amount per month
for the removal of garbage and the maintenance of clean gutters and drains. Usually,
unemployed youths or marginalized community members are hired to do the work,
thereby creating a source of income for the poorest in the community.
The money raised is matched on a one-to-one basis by the municipality, which
supplies basic equipment and helps to enhance local administration and management
capacities. As with the Slum Sanitation Programme, the profit made each month by
the scheme is reinvested into the community, through the creation of local projects
chosen by the participants.
Both schemes have increased resilience in slum areas by stimulating the growth of
social cohesion and creating a mechanism for that unity to begin producing tangible
156
chap07 16.8.2004 10:49 Page 156](https://image.slidesharecdn.com/wdr-2004-130731042145-phpapp02/85/Wdr-2004-157-320.jpg)


![Social capital report of norms, networks, and trust [low res]](https://cdn.slidesharecdn.com/ss_thumbnails/socialcapitalreportofnormsnetworksandtrustlowres-130731023640-phpapp02-thumbnail.jpg?width=640&height=640&fit=bounds)


