Download as PDF, PPTX

![World Disasters Report 2013
Chapter 1 Humanitarian technology
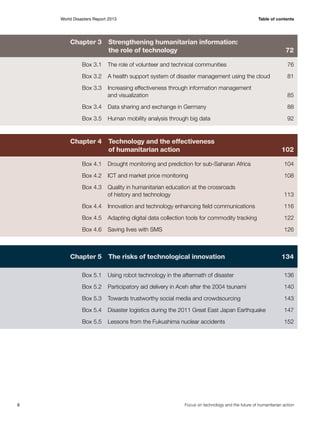
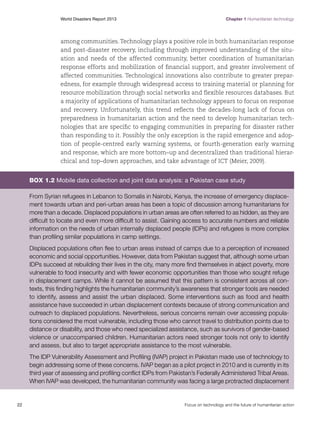
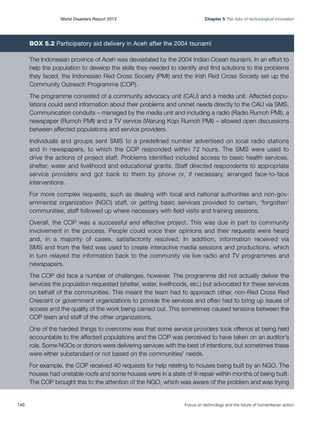
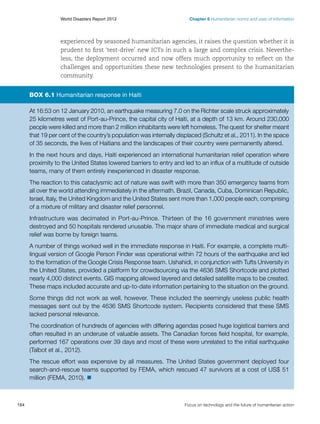
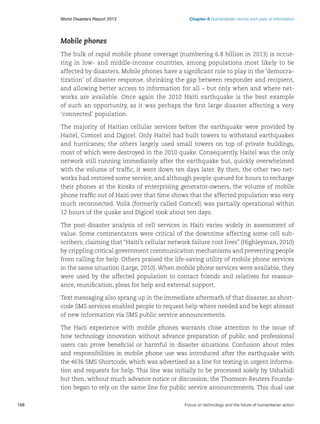
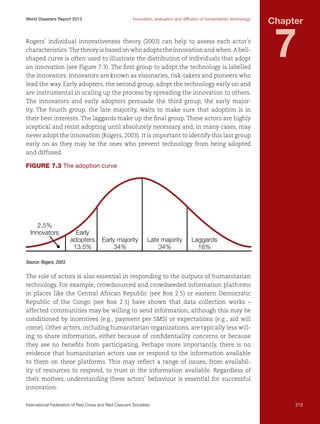
Developed with everyday people in mind, the presentation of first-aid content was a reversal to the
traditional method of teaching first aid, with the new approach engaging the learner directly with the
intended change, or outcome, for the ill or injured person. This avoids the complicated mechanics,
diagnoses and technicalities which can distract people from learning the principal aim of any first-aid
act: to preserve life, promote recovery and prevent worsening of the condition. Reduced complexity
might also assist the first-aid helper in an emergency, enabling them to adapt to their circumstances
and recall the most important part of the skill they need.
Of course, simplifying the material is only part of the story. The rapid development of smartphone
mobile technology provided the means to make first-aid content more available to potential helpers
by literally putting the information at people’s fingertips.
Analysis of mobile technology trends shows an explosion in its use, with the UK mobile market totalling some 84 million subscribers by the end of 2012 (Paterson and Lane, 2010). By 2016, 65 per
cent of the UK population will access this technology via smartphones (eMarketer, 2013) and, of the
8.06 million app users in the UK in 2010, some 76 per cent accessed via a smartphone (Paterson
and Lane, 2010). In the case of first aid, the mobility of smartphones provides a dual opportunity:
smartphones offer the possibility to provide rapid emergency advice when it is needed and also
permit people to browse and learn from content at their own leisure.
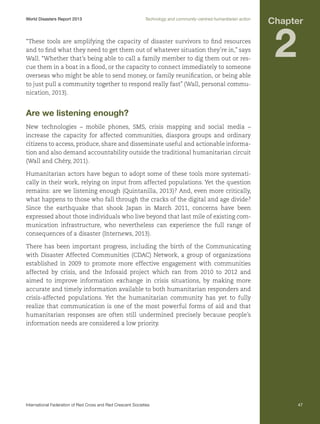
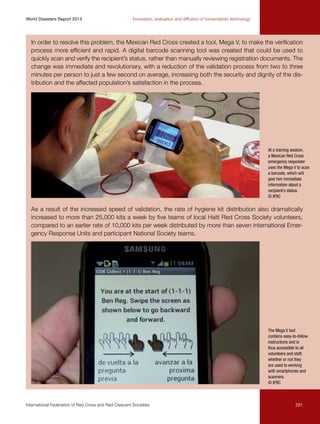
In developing their app, the British Red Cross decided that it should be more than functional – it
needed to be a compelling market leader, of excellent educational quality, free, easy to navigate
and offer wider emergency preparedness advice. Interaction was also important, with different tabs
allowing users to decide what to focus on. The ‘learn’ section is predominantly video-led since
research shows that viewing video demonstrations, even without practising them, enables people to
perform some skills more effectively than untrained individuals could (Eisenburger and Safar, 1999).
The ‘emergency’ section, a defining feature of the app, gives emergency support tools in simple,
straightforward steps, such as calling emergency services, and timing devices for managing burns
and resuscitation. Finally, the ‘test’ section tests skills through quizzes.
Since its launch in December 2011, the first-aid app has won two industry awards, the first for best
app in the Digital Communications Awards (Europe) (Quadriga, 2012) and the second for best use
of digital media in the CorpComms Awards (Dunne, 2012). While these awards are satisfying, it is
the feedback from people who use the app that shows its real contribution to reducing vulnerability.
One person wrote via the ‘tell us your story’ function: “This app is great. I am a fast response paramedic in London and I was called to a category one [life-threatening] call at a school; there was a
student with this app that used it to revive the patient. If this app was not out there then there would
be one less person in the world.”
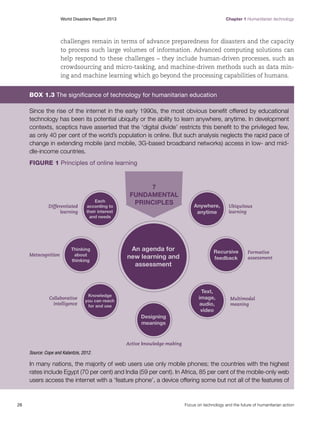
Billed as building ‘real-world’ resilience via a digital model, the app has certainly succeeded in its aim
to put first-aid advice, literally, in the hands of thousands of people. The target of 30,000 downloads
was shattered within nine days of its launch and the current total number of downloads is more than
500,000.
Analysis shows the app is primarily used to learn first aid before an emergency, using the ‘learn’ or
the equally popular ‘test’ tab. To a lesser extent, people also access the app during emergencies.
28
Focus on technology and the future of humanitarian action](https://image.slidesharecdn.com/worlddisasterreport2013-131023092004-phpapp01/85/World-disaster-report-2013-27-320.jpg)
![World Disasters Report 2013
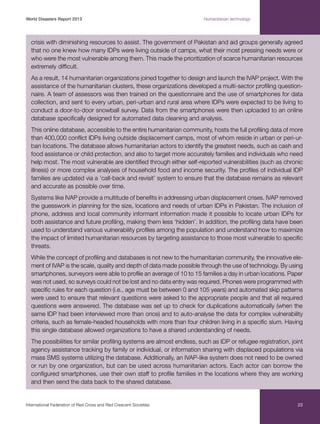
Technology and community-centred humanitarian action
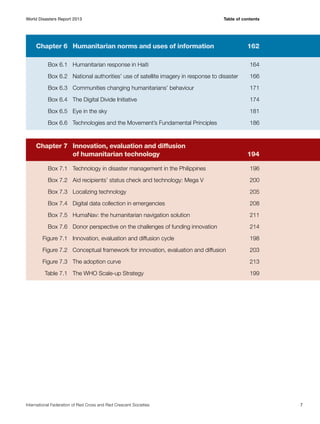
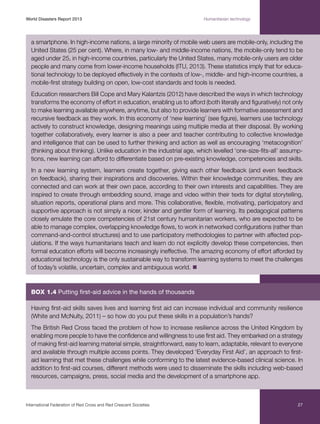
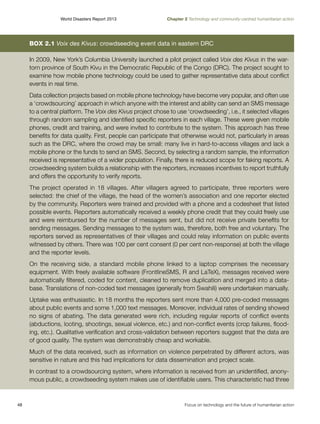
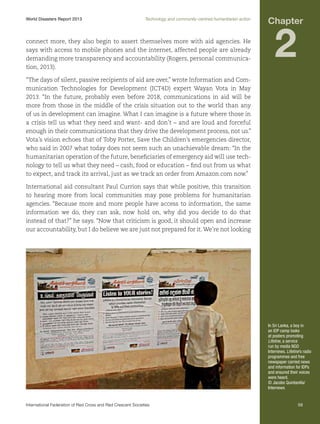
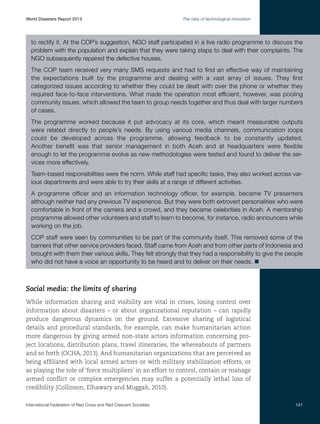
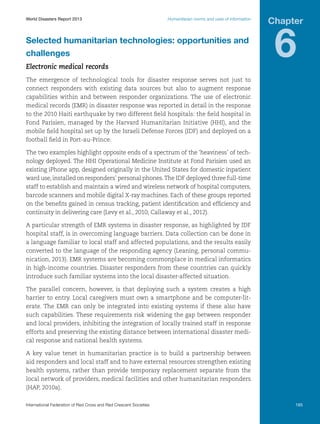
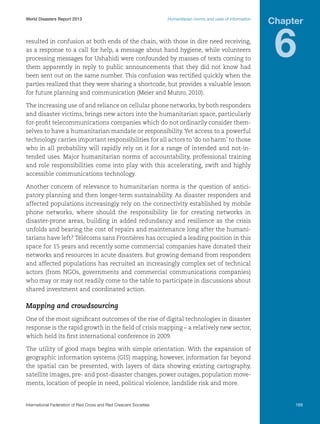
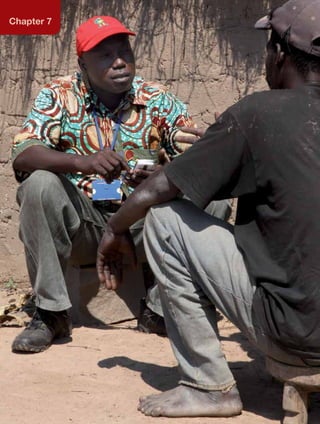
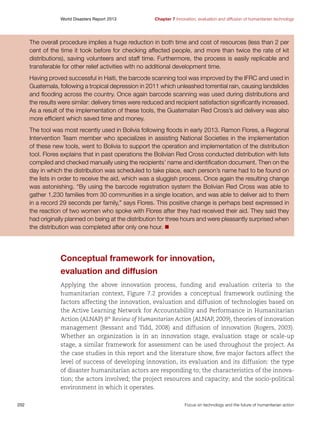
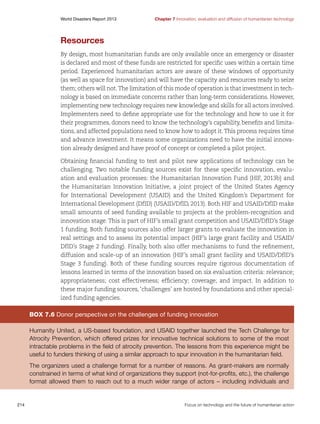
From this experience Kallidis created a mobile application called Jointly, which
helps connect people affected by disaster directly with volunteers who can help.
The start screen invites users to ‘get help’ or ‘give help’. Moving forward through
the application, people can select the specific help they need or skill they have,
and then put a call out to get connected. “It will not solve every problem, but it
gives people tools so they are able to start doing small things that really make the
biggest difference in the recovery process. Even connecting people strengthens
the community, being able to use resources more efficiently,” she says.
Chapter
2
Kallidis’s theory behind Jointly is that communities are capable of dealing with
many facets of disasters. Her app simply organizes the talents and needs available in a geographic area and mobilizes them. It also begins to build a community
before disaster strikes, which enables the community to communicate, organize
and get things done quicker after the event.
Consultant Paul Currion says it is increasingly clear that communities are better
equipped to communicate and share important information with each other.
“In the last five years, humanitarian organizations have become less important, particularly in politicized emergencies” (Currion, personal communication,
2013). Whether it is sending information, remittances, clothes, building materials or food, diasporas and local citizens, aided by technology, are increasingly
creating a do-it-yourself approach, in some ways competing with humanitarian
agencies.
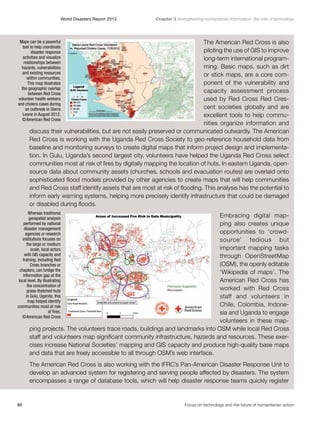
When tornadoes devastated parts of Oklahoma in May 2013, groups of citizens
from New York City areas damaged by Hurricane Sandy jumped in trucks to
transport donations and relief materials to the affected areas. Currion says that
enthusiasm to ‘pitch in’ is a positive trend in many ways. And although he does
not foresee the humanitarian sector becoming totally obsolete, he does worry
that a diminished professional humanitarian presence is problematic in other
ways. “I think the humanitarian sector is not a delivery mechanism for humanitarian assistance, it’s a delivery mechanism for humanitarian values. But, if our
role of deliverers of humanitarian assistance is put by the wayside, becomes less
important and we become less relevant, then we can no longer deliver humanitarian values. So we face this problem: at the same time [as] people are able to
help themselves more, the basis of humanitarianism as we understand it, as a
principled approach to helping people, could itself become eroded” (Currion, personal communication, 2013).
But this debate about who will provide humanitarian assistance in the future has
more than two potential scenarios. Messages of resilience and empowerment –
and information as a form of assistance – are often best delivered by individuals
who have connections to both local communities and humanitarian agencies.
International Federation of Red Cross and Red Crescent Societies
63](https://image.slidesharecdn.com/worlddisasterreport2013-131023092004-phpapp01/85/World-disaster-report-2013-62-320.jpg)
![World Disasters Report 2013
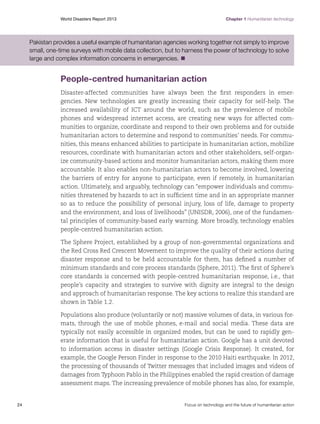
Technology and community-centred humanitarian action
that it is time for these kinds of private–public partnerships to become more
common, between humanitarian actors, governments and technology and telecom businesses. “I think it’s in everyone’s interest, especially [that] of the
private sector, to have those partnerships developed before a disaster occurs
because nobody in the immediate aftermath wants to be dealing with MOUs
[memoranda of understanding] and figuring out the right people to talk to in
different agencies. That kind of preparedness and professionalization make
those relationships more sustainable and more predictable when disasters do
happen” (Reid, personal communication, 2013).
Chapter
2
In this sense, it is important to note the role played by the CDAC Network, a
ground-breaking cross-sector initiative between aid agencies, UN organizations, the Red Cross Red Crescent Movement and media development
organizations, that recognizes information and two-way communication as key
humanitarian deliverables.
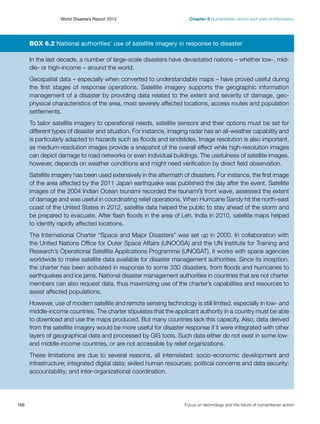
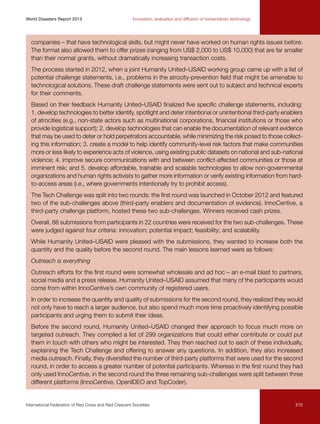
Ultimately, the best way to create empowerment and resilience within disaster-affected communities is by investing in developing the capacity of community
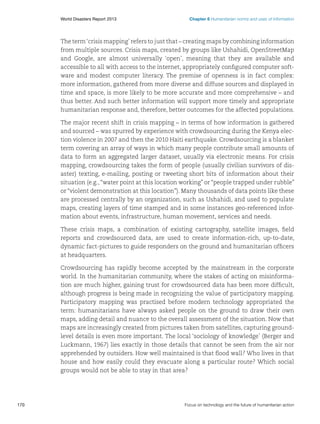
members to be the responders and organizers of their own relief. When Port-auPrince, Haiti was hit by the 2010 earthquake, one of the most effective responses
was by a radio DJ, Carel Pedre, who realized his station’s signal was still working,
got on the air and, within days, had improvised an internationally accessed family reunification system, using the radio, Facebook, Twitter and a small staff to
locate loved ones around Haiti (Wall, personal communication, 2013). Pedre was
sharing information gathered from the humanitarian sector and was the
ideal messenger, because he was a local voice, with a built-in audience and
community trust.
Chapter 2 was written by Jesse Hardman, an independent reporter, writer and international media development specialist, and Jacobo Quintanilla, Director of Humanitarian
Information Projects at Internews. Box 2.1 was written by Peter van der Windt and
Macartan Humphreys, Center for the Study of Development Strategies, Columbia University, New York. Box 2.2 was written by Maya Arii, International Emergency Medicine
Fellow, Harvard Medical School. Box 2.3 was written by Hélène Juillard, Coordinator
a.i., Cash Learning Partnership. Box 2.4 was written by Omar Abou-Samra, Wendy
Harman and Sheila Thornton of the American Red Cross. Box 2.5 was written by Jacobo
Quintanilla.
International Federation of Red Cross and Red Crescent Societies
67](https://image.slidesharecdn.com/worlddisasterreport2013-131023092004-phpapp01/85/World-disaster-report-2013-66-320.jpg)
![World Disasters Report 2013
Chapter 3 Strengthening humanitarian information: the role of technology
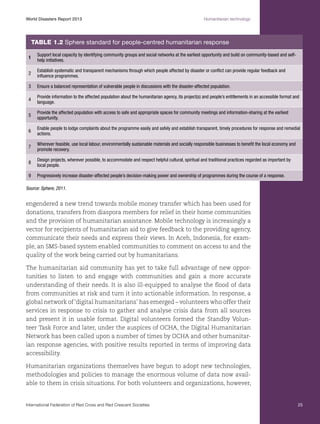
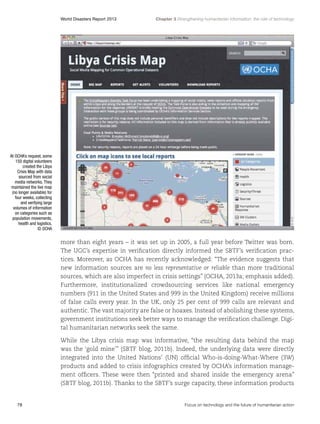
to self-organize […]” (Tulane University, 2012). This capacity is in part reliant on available information. But an overflow of information and data can be as paralysing as the
absence of it when it comes to mobilizing response both locally and internationally.
Access to information that is relevant and manageable is thus critical for effective
humanitarian assistance and as a critical lifeline for local self-help operations. In
fact, information is just as important as access to food, water or shelter, for without
information, who would know where the nearest shelter is, or whether the water is
safe to drink? This highlights the imperative of prioritizing two-way communication
with disaster-affected communities. The major consequences of the information
revolution are the rise of self-help actions directed by and for disaster-affected communities, and the unparalleled volume of real-time crisis information generated
following a disaster.
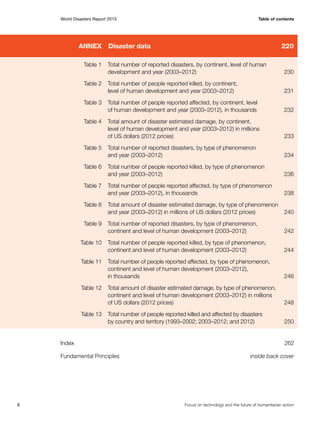
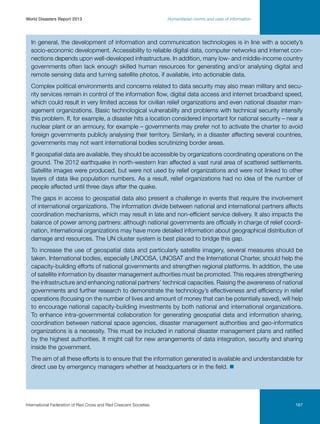
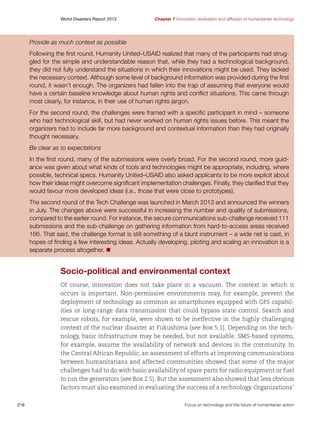
Big crisis data
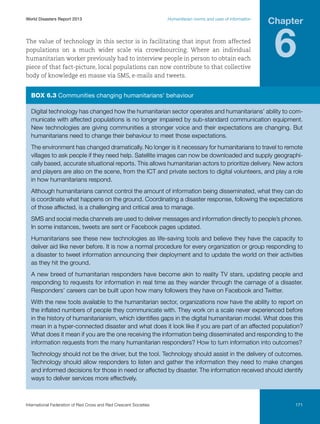
Almost 250 million people were affected by disasters in 2010 alone (OCHA, 2013a).
Since then, the number of new mobile phone subscriptions has increased by well
over 1 billion. As a result, disaster-affected communities today are increasingly likely
to be ‘digital communities’ as well – that is, both generators and consumers of digital
information. More than 100 countries now have more mobile phone subscriptions
than they have people. In addition, more than 70 per cent of Africa’s total population
already subscribes to a mobile phone service; while one in four individuals in lowand middle-income countries already use the internet, a figure set to double within
the next 20 months (OCHA, 2013a).
In early 2012, Filipinos, for example, sent an average of 2 billion text messages (SMS)
every day and more than 92 per cent of Filipinos who are online have used Facebook (OCHA, 2013a). When disaster strikes, many of these SMS and Facebook posts
relay critical crisis information. Indeed, recent data-driven research on social media
use during disasters has shown that user-generated content posted on Twitter, for
instance, can be informative and relevant for disaster response. In fact, these studies
reveal that 8 per cent to 65 per cent of all tweets generated during disasters were
informative and relevant (Meier, 2012a). This research, however, is typically carried
out months if not years after the disasters in question because collecting, cleaning
and analysing these datasets often takes a disproportionate amount of time. Moreover, the datasets are getting increasingly large. More than half-a-million Instagram
pictures and 20 million tweets were posted during Hurricane Sandy, for example. In
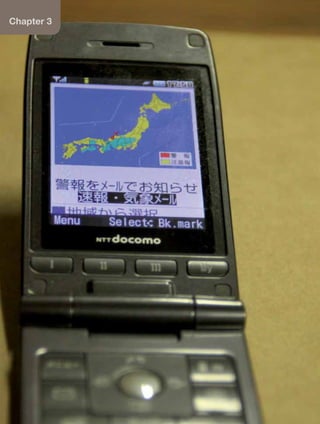
Japan, Twitter users posted more than 177 million disaster-related tweets the day
after the 2011 earthquake – that is, 2,000 tweets a second on average. In addition,
over 500,000 new Twitter accounts were created that same day. Welcome to the rise
74
Focus on technology and the future of humanitarian action](https://image.slidesharecdn.com/worlddisasterreport2013-131023092004-phpapp01/85/World-disaster-report-2013-73-320.jpg)
![World Disasters Report 2013
Chapter 3 Strengthening humanitarian information: the role of technology
– Buckee, C.O. et al. ‘The impact of biases in mobile phone ownership on estimates of
human mobility’ in Interface, Journal of the Royal Society, 6 February 2013. Available
online: www.ncbi.nlm.nih.gov/pubmed/23389897.
– Burrell, J. The Ethnographer’s Complete Guide to Big Data: Answers (part 2 of 3). Ethnography
Matters, 11 June 2012. Available online: http://ethnographymatters.net/2012/06/11/
the-ethnographers-complete-guide-to-big-data-part-ii-answers/.
– Castillo, C., Mendoza, M. and Poblete, B. ‘Predicting Information Credibility in TimeSensitive Social Media’, accepted for publication in Internet Research, special issue on The
Predictive Power of Social Media, 2013.
– Crawford, K. ‘Think Again: Big Data’ in Foreign Policy, 9 May 2013. Available online:
www.foreignpolicy.com/articles/2013/05/09/think_again_big_data.
– Crisis Mappers: The humanitarian technology network: www.crisismappers.net.
– Department for International Development (DfID). Promoting innovation and evidencebased approaches to building resilience and responding to humanitarian crises: A DfID
Strategy Paper. London: DfID, 2012. Available online: http://reliefweb.int/report/world/
promoting-innovation-and-evidence-based-approaches-building-resilience-andresponding.
– Digital Humanitarian Network (DHN). UN Activation for Typhoon Pablo (Philippines). Posted
17 December 2012. Available online: http://digitalhumanitarians.com/profiles/blogs/
typhoon-pablo.
– Frias-Martinez, V. On the Relation between Socio-Economic Status and Physical Mobility. 2012.
Available online: www.vanessafriasmartinez.org/uploads/JITDVFrias.pdf.
– German Federal Ministry for Education and Research, Framework Programme: Research
for Civil Security: www.bmbf.de/en/6293.php.
– Gilbert, C. ‘Studying Disaster: Changes in the Main Conceptual Tools’ in Quarantelli, E.L.
(ed.), What is a Disaster? Perspectives on the Question. London and New York: Routledge, 1998.
– GSMA. Code of Conduct for Use of SMS in Disaster Response. London: GSMA Disaster Response,
Souktel and The Qatar Foundation, 2013. Available online: www.gsma.com/mobilefor
development/towards-a-code-of-conduct-guidelines-for-the-use-of-sms-in-naturaldisasters.
– Horrigan, M.W. Big Data: A Perspective from the BLS [Bureau of Labor Statistics]. Amstatnews:
The membership magazine of the American Statistical Association, 1 January 2013.
Available online: http://magazine.amstat.org/blog/2013/01/01/sci-policy-jan2013/.
– Humanitarian OpenStreetMap: http://hot.openstreetmap.org.
98
Focus on technology and the future of humanitarian action](https://image.slidesharecdn.com/worlddisasterreport2013-131023092004-phpapp01/85/World-disaster-report-2013-97-320.jpg)
![World Disasters Report 2013
Chapter 3 Strengthening humanitarian information: the role of technology
– Meier, P. Big Data Philanthropy for Humanitarian Response. Posted 4 June 2012(d).
Available online: http://irevolution.net/2012/06/04/big-data-philanthropy-forhumanitarian-response/.
– Meier, P. Using #Mythbuster Tweets to Tackle Rumors During Disasters. Posted 27 January 2013a.
Available online: http://iRevolution.net/2013/01/27/mythbuster-tweets
– Meier, P. Automatically Identifying Fake Images Shared on Twitter During Disasters.
Posted 1 July 2013(b). Available online: http://iRevolution.net/2013/07/01/
automatically-identifying-fake-images.
– MicroMappers: www.MicroMappers.com.
– Morrow, N. et al. Independent Evaluation of the Ushahidi Haiti Project: Final Report. Development
Information Systems International, 2011. Available online: https://sites.google.com/site/
haitiushahidieval/news/finalreportindependentevaluationoftheushahidihaitiproject.
– NetMob 2013: Third conference on the Analysis of Mobile Phone Datasets, 1–3 May 2013:
http://perso.uclouvain.be/vincent.blondel/netmob/2013/
– Nurmi, P. Data Analysis from Mobile Networks. Helsinki: University of Helsinki, 2012. Available
online: www.cs.helsinki.fi/u/ptnurmi/teaching/LA12/Location_Awareness_LECTURE_VIII.pdf.
– Pentland, A. Reinventing Society in the Wake of Big Data. Edge, 30 December 2012. Available
online: www.edge.org/conversation/reinventing-society-in-the-wake-of-big-data.
– Puschmann, C. and Burgess, J. The Politics of Twitter Data. HIIG Discussion Paper
Series, No. 2013-01, 2013. Available online: https://papers.ssrn.com/sol3/papers.
cfm?abstract_id=2206225.
– Security System for Public Institutions in Disastrous Emergency Scenarios: www.spiderfederation.org/en.html.
– Standby Task Force (SBTF) blog. Libya Crisis Map Deployment 2011 Report. Posted 1
September 2011(a). Available online: http://standbytaskforce.wordpress.com/2011/09/01/
libya-crisis-map-report/.
– Standby Task Force (SBTF) blog. The [unexpected] Impact of the Libya Crisis Map and the
Standby Volunteer Task Force. Posted 19 December 2011(b). Available online: http://
standbytaskforce.wordpress.com/2011/12/19/sbtf-libya-impact/.
– State, B., Weber, I. and Zagheni, E. Using IP Geolocation to Study Human Mobility. Stanford
University, 2013. Available online: www.stanford.edu/~bstate/mig_poster.pdf.
– Subik, S. et al. SPIDER: Enabling Interoperable Information Sharing between Public Institutions
for Efficient Disaster Recovery and Response. Institute of Electrical and Electronics Engineers
(IEEE) International Conference on Technologies for Homeland Security, Waltham, MA,
USA, November 2010.
100
Focus on technology and the future of humanitarian action](https://image.slidesharecdn.com/worlddisasterreport2013-131023092004-phpapp01/85/World-disaster-report-2013-99-320.jpg)
![World Disasters Report 2013
Chapter 6 Humanitarian norms and uses of information
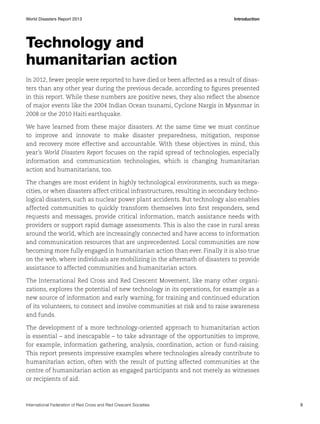
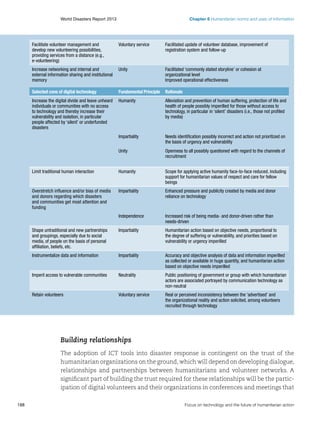
principles, codes of conduct and historical lessons. They do not understand field
constraints and issues of access and security. They are not familiar with concepts
of vulnerability and voice. They relish problems but resort to technological solutions
without apparent respect for the friction introduced by context, culture and politics.
OCHA recently released Humanitarianism in the Network Age (2013b), a policy document that examines the opportunities and challenges marked by the rising
importance of crowdsourcing, digital humanitarian response and the next generation in humanitarian technology. The changing paradigm is described as: “not
simply a technological shift [but] also a process of rapid decentralization of power.
With extremely low barriers to entry, many new entrants are appearing in the fields
of emergency and disaster response. They are ignoring the traditional hierarchies,
because the new entrants perceive that there is something they can do which benefits others” (OCHA, 2013b).
Crowdsourcing can help affected populations to shape the response to their plight –
the more crowdsourced crisis information there is available, the more it can reflect
the needs and priorities of the citizens in need of help.
But substantial ethical risks are attached to the current methods used to gather and
aggregate crowdsourced data and to the crisis mapping approach more generally.
In terms of gathering information, crowdsourced data can rapidly be crippled by
countermeasures, such as flooding the system with misinformation or invading the
programs with malware. Information obtained through crowdsourcing can also be
used to track backwards, so that individual or aggregated sources, defined by a certain geographic area settled by certain groups of interest, could be identified and
potentially targeted for exposure or reprisal. Reports of human rights abuses, which
are important to obtain, would require layers of encryption to travel on electronic
pathways with a secure veil of confidentiality or anonymity. But this would complicate or vitiate the easy utility of crowdsourcing.
Aggregating crowdsourced data demands substantial technical and ethical expertise. Are all data points of equal relevance, accuracy and substance? What choices
are implied by the selection of a particular unit of analysis – can an individual speak
for a population? How is a community defined? Is one person’s expressed suffering
equivalent to another’s, when lives are at stake?
Taking information building blocks at face value and then building a data edifice on
them may mask some essential errors – is the library map derived from a politicized
source or time? Are there omissions of importance on the map supplied by that one
clan? Are translators reporting key nuances? Do these pre-existing health records
convey adequate information to serve as a baseline?
180
Focus on technology and the future of humanitarian action](https://image.slidesharecdn.com/worlddisasterreport2013-131023092004-phpapp01/85/World-disaster-report-2013-179-320.jpg)

The document is the World Disasters Report 2013, which focuses on technology and the future of humanitarian action. It explores how information and communication technologies can help humanitarian organizations, governments, and communities prepare for and respond to disasters. The report examines how technologies can help put communities at the center of humanitarian response. It also considers the challenges of technologies, such as reduced direct interaction between aid workers and communities, and the involvement of new actors not grounded in humanitarian principles. The report argues for more systematic evaluation of how technologies contribute to humanitarian action.


