
Download to read offline
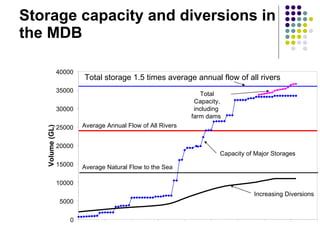
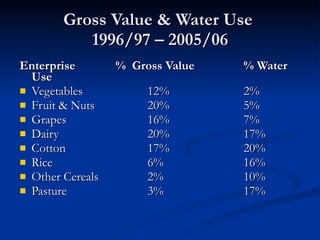
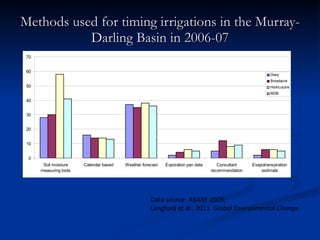
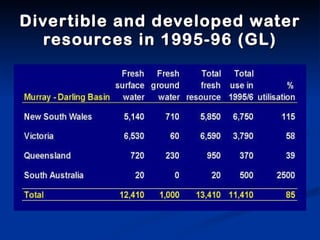
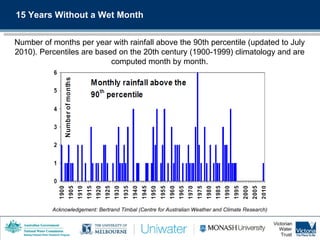
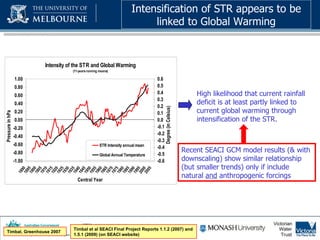
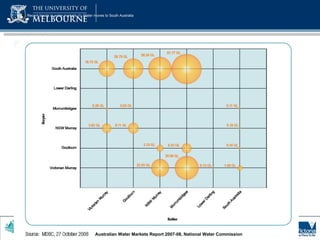


1) Total storage capacity in the Murray-Darling Basin (MDB) has increased to 1.5 times the average annual flow of all rivers in the basin between 1920-2010 due to increased development of major storages and farm dams. 2) Dairy production accounts for 20% of the gross value of production but uses 17% of water in the MDB, while cotton accounts for 17% of value but uses 20% of water. 3) Recent climate trends in the MDB show a decrease in the number of wet months per year and an intensification of drought conditions linked to global warming.


![5G Explained! A High Level Overview [Introduction]](https://cdn.slidesharecdn.com/ss_thumbnails/5gexplainedahighleveloverview-260119165306-cc137a3e-thumbnail.jpg?width=640&height=640&fit=bounds)


