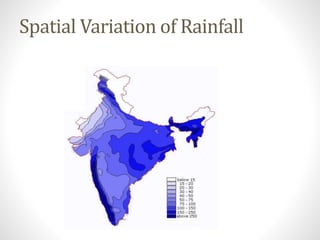
WATER RESOURCES
Presented to: Dr. JK Gupta
Presented by: Mr. Rahul bhati
16STUJPCS0012
DISTRIBUTION OF GLOBAL WATER
Rainfall
Average Annual Rainfall - 1170 mm
Maximum Average Annual Rainfall - 11000 mm
#Cherrapunji
Minimum Average Annual Rainfall - 100 mm
#Western Rajasthan
Spatial Variation of Rainfall
Demands of Various Sectors
0
200
400
600
800
1000
1200
1400
1997 2010 2025 2050
Demand(Billioncubicmetre)
Evaporation Losses
Environment
(Ecology)
Inland Navigation
Power
Industries
Domestic
Irrigation
India, with more than a billion people, needs a lot of water to grow food for its population
Agriculture
Source: http://www.unep.org/dewa/assessments/ecosystems/water/vitalwater/15.htm
Why India is a Water deficient
country ?
•Total land area --- 2.5%
•Population --- 16.7%
•Animal population --- 15%
•Renewable fresh water --- 4%
Note :-Percentage world-wide
Step to be taken to over come
water deficient: -
• Afforestation
• Reduction of over-gazing
• Population Control
• Community participation
• Use of non- conventional sources of energy
Temporal Variation
0
100
200
300
400
500
600
700
800
900
1000
Winter
Monsoon
(Jan-Feb)
Pre
Monsoon
(Mar-May
Monsoon
(Jun-Sep)
Post
Monsoon
(Oct-Dec)
Rainfallinmm
All India
Per Capita Availability
0
1000
2000
3000
4000
5000
6000
1951 1991 2001 2025 2050
WaterAvailibilty(Cubicmeterper
capitaperyear)
Water Stress Line
Water Scarcity Line
Sources of Irrigation
2.89 (5%)
2.53 (5%)
11.55 (21%)
15.98 (29%)
21.72 (40%)
Canals Tanks Tube Wells
Other Wells Other Sources
Every item
that we use needs
water for production
CAUSES FOR WATER STRESS
Water evaporation
from reservoirs of large
hydro power projects
Domestic
Extensive farming.
High usage of water
Industry
Increase in Population
Water stress!!!!
Power
Agriculture
People require
food to eat
Increased demand
for goods
bathing, flushing, washing,
cooking, drinking…
Water resources

Water resources